In this paper we test the southern California network earthquake catalog and ... Two different catalogs of earthquake data are considered: the USGS-CALTECH.
Bulletin of the SeismologicalSociety of America, Vol. 79, No. 4, pp. 1282-1286, August 1989
THE FORTNIGHTLY TIDE AND THE TIDAL TRIGGERING OF EARTHQUAKES BY S T E P H E N HARTZELL AND THOMAS HEATON
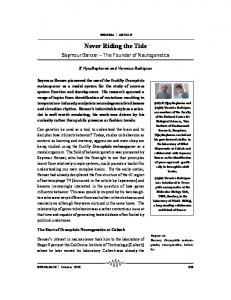
In this paper we test the southern California network earthquake catalog and the world-wide earthquake catalog for a fortnightly tidal periodicity and find none. In studies that test the hypothesis of tidal triggering of earthquakes, it is usually necessary to resolve the tidal shear stress onto the plane of the fault and in the direction of the slip vector to determine if the stress is compatible with the fault motion (Heaton, 1975, 1982). This analysis requires accurate focal mechanisms and knowledge of the focal plane on which slip occurred for as many earthquakes as possible to improve the statistical sampling of the data set. However, if we consider the fortnightly tide, which is a simple amplitude modulation, focal mechanism information is not required. Our analysis assumes that we have a large data base of earthquakes with varying mechanisms. The alignment of the slip vector with the tidal shear stress will vary from earthquake to earthquake. However, if tidal triggering of earthquakes does occur, more earthquakes should be triggered out of the total population when the tidal stress is large than when it is small. If the largest semi-diurnal tide is normalized to an amplitude of 1.0, the fortnightly tide would have an amplitude of 0.17 on this scale and a period of about 2 weeks (Munk and MacDonald, 1960). Therefore, the effect on the occurrence of earthquakes by the tidal shear stress will be modulated with a 2 week period. Considering the fortnightly tide allows us to utilize entire catalogs of data to test the tidal triggering hypothesis without knowledge of the focal mechanisms. A simple Fourier transform of the times of occurrence of earthquakes should in principle show any periodicities present in the data. However, as was recognized by Knopoff (1964), the Fourier spectrum can be very difficult to interpret due to the many spectral lines of the tidal function and due to the fact that even the simplest time domain sampling function with events at a constant time interval has a rather complex spectrum (Bracewell, 1965). The method of analysis we have found to be most useful consists of searching the data for one periodicity at a time by plotting the times of occurrence of earthquakes on a rose diagram. A rose diagram can be viewed as the face of a clock for which one complete revolution is equal to the period in question. We divide each diagram into 24 sections into which the earthquakes are sorted as the clock wraps upon itself. A periodicity in the data manifests itself as a clustering of events in one or more of the sections of the diagram. The statistical significance of the clustering is evaluated by a method developed by Rayleigh (1919). Consider a random walk in two dimensions (Fig. 1). Let the phase of each earthquake ~i be given by its azimuth on the rose diagram and represent a unit step in the ~bi direction. If the magnitude of the vector sum of m unit twodimensional vectors is denoted by R, then the probability PR that a random set of m phases will produce a vector sum whose magnitude exceeds R is approximately _R 2
equal to e - - . This approximation holds when m is larger than 10. Thus, the m smaller PR is, the greater the significance of the periodicity in the data. Two different catalogs of earthquake data are considered: the USGS-CALTECH southern California network catalog and the NEIC world-wide catalog. Three different periodicities are tested: fortnightly period of 13.6626 days, 1 day, and 365 1282
SHORT NOTES
1283
days. Tidal triggering effects are not expected to be seen at periods of 1 day and 365 days, but they are included as points of comparison. The results are shown in Table 1. The tabulated information includes the years covered by the catalogs, the lower magnitude cutoff if any, the periodicity being tested for, the number of earthquakes included, and the probability PR. Consider the results for the southern California catalog first. They show an initially surprising outcome. Statistically significant periodicities are obtained for not only 13.6626 days but also 1 day and 365 days. However, two important factors have been overlooked: the lower magni-
i I I I
R
/
m
3
R =/(~sin "
i=1
2
m
2
f.) + ( E cos f.) I
i:1
I
R2 PR = exp (--~-- ) FIG. 1. Geometric interpretation of PR, the probability t h a t a random walk consisting of m steps will traverse a distance of R or greater.
TABLE 1 RESULTS OF TESTS FOR PERIODICITIES CATALOG
Southern Calif. S o u t h e r n Calif. S o u t h e r n Calif. S o u t h e r n Calif. S o u t h e r n Calif. Declustered South. Declustered South. Declustered South. Declustered South. Declustered South. Declustered South. Declustered South. World-Wide World-Wide World-Wide World-Wide World-Wide World-Wide World-Wide World-Wide
Calif. Calif. Calif. Calif. Calif. Calif. Calif.
Years
Magnitude Cutoff
Periodicity (days)
Number of Events
1932-1988 1932-1988 1932-1988 1932-1988 1932-1987 1932-1988 1932-1988 1932-1988 1932-1988 1932-1988 1932-1987 1932-1987 1900-1988 1900-1988 1900-1988 1900-1988 1900-1988 1900-1987 1900-1988 1900-1987
none 2,5 none 2.5 none none 2.0 2.5 none 2.5 none 2.5 none 5.0 none 5.0 none none 5.0 5.0
1. 1. 13.6626 13.6626 365. 1. 1. 1. 13.6626 13.6626 365. 365. 1. 1. 13.6626 13.6626 365. 365. 365. 365.
151834 25484 151834 25484 141984 30366 25191 14979 30366 14979 25506 12048 189385 38630 189385 38630 189385 184057 38630 37951
Probability PR
1.33 x 7.30 x 8.94 x 4.95 x 7.52 x 3.07 x 1.78 x 0.292 0.984 0.785 9.66 x 0.126 7.86 × 0.195 0.144 0.074 6.60 × 7.01 x 2.35 x 0.892
10 -24 10 -3 10 -~6 10 -~3 10 -~°9 10 -~ 10 -~
10 -7 10 -7
10 -°° 10 -1~ 10 -4
1284
SHORT NOTES
tude completeness level of the catalog and clustering of events in aftershock sequences. If a lower magnitude limit of 2.5 is introduced, PR increases markedly, indicating a reduction in the significance of the periodicity. However, the values of PR are still low enough that the observed periodicities are significant. Since many of the earthquakes in the southern California catalog occur in aftershock sequences and are not independent events, the same periodicities are tested for using a declustered catalog (Lucile Jones, personal comm.). The declustering is done using the method of Reasenberg (1985) in which events are removed that are closely related to each other temporally and spatially. Using the declustered catalog reduces the significance of the periodicities substantially, however they are not removed (PR on the order of 0.1 or larger) until a magnitude cutoff of 2.5 is also introduced. Figure 2 shows the rose diagram for the fortnightly tidal period and the declustered southern California earthquake catalog. The results are displayed in two ways; with all the events plotted, and with the number of events in the least populated segment of the diagram subtracted out. One may argue that aftershocks and smaller earthquakes in general might be more sensitive to tidal effects because they are closer to failure. McNutt and Beavan (1981) observed a correlation for volcanic induced seismicity, between the occurrence of small earthquakes and the solid earth tide. However, it is not possible to isolate periodicities in aftershock sequences that are caused by earth tides from those that are a result of the nonindependent nature of the events. What we can say is that at a level at which the declustered catalog is complete there is no tidal effect seen. The low probabilities obtained for periods of I day and 365 days from
Southern California Earthquake Catalog 0
~70
Periodicity in days Interval runs from
I
9O
13.6626 1932 to 1988
0
270
9C
J ~
180
180
r
Number of earthquakes Sum of cosines Sum of sines Probability
= = = =
14979 -8.1 -59.6 0,785
FIG. 2. Rose diagram for the fortnightlytidal period and the declusteredsouthern Californiaearthquake catalog. A lowermagnitude cutoff of 2.5 is used. The results are displayedwith all events plotted (a), and with the number of events in the least populated segment subtracted out (b).
SHORT NOTES
1285
the declustered southern California network catalog assuming no magnitude cutoff most likely have different explanations. At a period of I day, we may be seeing the result of lower noise levels at night with the resulting detection of more events. At a period of 365 days, the periodicity may be a result of expansions or improvements in the network which take place at periods on the order of years. T h e results for the world-wide catalog are given at the b o t t o m of Table 1. Because of the larger magnitude completeness level of the world-wide catalog, clustering of events in aftershock sequences is apparently not a problem. However, erroneously small values of PR are again obtained if a magnitude cutoff limit of 5.0 is not used. With this limit in place, no periodicities are found in the data. T h e rose diagrams for the fortnightly period and the world-wide catalog are shown in Figure 3. An additional effect is seen in testing for a periodicity of 365 days. If an integer n u m b e r of years is not used, an apparent periodicity is obtained. F r o m Table I the probability for years 1900 through 1988 is 2.35 x 10 -4 and 0.892 for years 1900 through 1987. These values are a result of the fact t h a t the world-wide catalog in use is current through May 1988. Therefore, the runs in Table I covering years 1900 through 1988 include 88.5 years, whereas the runs covering years 1900 through 1987 include 88 years. A much longer time sample would be required before a partial year could be included and still obtain a valid probability. In summary, no statistically significant periodicity is seen in either the southern California network catalog or the world-wide catalog at the fortnightly tidal period or at periods of I day or 365 days. However, perhaps even more interesting are the m a n y pitfalls t h a t exist in performing this kind of statistical analysis. Clustering of
World-Wide Earthquake Catalog Periodicity in days Interval runs from
13.6626 1900 to 1988
0
7.7Q
0
90
270
90
180
180
Number of earthquakes
= 38630
Sum of cosines Sum of sines Probability
= = =
316.5 19.0 0.074
FIG. 3. Rose diagram for the fortnightly tidal period and the world-wide earthquake catalog. A lower magnitude cutoff of 5.0 is used. The results are displayed with all the events plotted (a), and with the number of events in the least populated segment subtracted out (b).
1286
SHORT NOTES
earthquakes in aftershock sequences, lower magnitude completeness levels, and insufficient number of sampling cycles can all lead to erroneous periodicities. REFERENCES Bracewell, R. (1965). The Fourier Transform and Its Applications, McGraw-Hill, New York. Heaton, T. H. (1975). Tidal triggering of earthquakes. Geophys. J. 43, 307-326. Heaton, T. H. (1982). Tidal triggering of earthquakes, Bull. Seism. Soc. Am. 72, 2181-2200. Knopoff, L. (1964). Earth tides as a triggering mechanism for earthquakes, Bull. Seism. Soc. Am. 54, 1865-1870. McNutt, S. R. and R. J. Beavan (1981). Volcanic earthquakes at Pavlof Volcano correlated with the solid earth tide. Nature 294, 615-618. Munk, W. H., and G. MacDonald (1960). The Rotation of the Earth, Cambridge University Press, London. Rayleigh, L. (1919). On the problem of random vibrations and of random flights in one, two, or three dimensions, Phil. Mag. J. Sci. 37, 321-347. Reasenberg, P. (1985). Second-order moment of central California seismicity, 1969-1982, J. Geophys. Res. 90, 5479-5495. U. S. GEOLOGICALSURVEY 525 SOUTHWILSONAVENUE PASADENA,CALIFORNIA91106 Manuscript received 8 February 1988