BIOINFORMATICS APPLICATION NOTE Systems biology
Vol. 28 no. 21 2012, pages 2849–2850 doi:10.1093/bioinformatics/bts516
Advance Access publication August 24, 2012
The GlycomeAtlas tool for visualizing and querying glycome data Yoshitsugu Konishi and Kiyoko F. Aoki-Kinoshita* Department of Bioinformatics, Faculty of Engineering, Soka University, 1-236 Tangi-machi, Hachioji, Tokyo 192-8577, Japan Associate Editor: Trey Ideker
ABSTRACT Motivation: The development of glycomics technologies in recent years has produced a sufficient amount of data to begin analyzing the glycan structures present in various organisms and tissues. In particular, glycan profiling using mass spectrometry (MS) and tandem MS has generated a large amount of data that are waiting to be analyzed. The Consortium for Functional Glycomics (CFG) has provided a web resource for obtaining such glycan profiling data easily. Although an interactive spectrum viewer is provided on the website as a Java applet, it is not necessarily easy to search for particular glycans or to find commonalities between different tissues in a single organism, for example. Therefore, to allow users to better take advantage of the valuable glycome data that can be obtained from mass spectra and other leading technologies, we have developed a tool called Glycome Atlas which is pre-loaded with the data from the CFG and is also able to visualize local glycan profiling data for human and mouse. Results: We have developed a tool to allow users to visualize and perform queries of glycome data. This tool, called GlycomeAtlas, is pre-loaded with glycome data as provided by the CFG. Moreover, users can load their own local glycome data into this tool to visualize and perform queries on their own data. Availability: This tool is available at the following URL: http://www .rings.t.soka.ac.jp/GlycomeAtlas/GUI.html. Contact:
[email protected] Received and revised on June 20, 2012; accepted on August 13, 2012
1 INTRODUCTION Recent advancements in glycomics technologies have enabled the glycome profiling of various cells and tissues. This is evidenced by the Consortium for Functional Glycomics (CFG) (Ismail et al., 2011; North et al., 2012; Raman et al. 2005, 2006), which has made available a large amount of such profiling data for various human and mouse samples, obtained from electrospray tandem mass spectrometry (ES-MS/MS) and matrix-assisted laser desorption/ionization time-of-flight mass spectrometry (MALDI-TOF MS) analysis. The majority of these data have been annotated with glycan structures using Cartoonist (Goldberg et al., 2009). The CFG web page at http://www.functionalglycomics.org/ also provides a Java applet which allows users to interactively view the actual mass spectra for each sample, in addition to PDF and JPG images of the spectra. Using this Java applet, users can zoom into a particular mass peak and see the glycan structures corresponding to *To whom correspondence should be addressed.
each peak. Although useful, however, users who would want to view commonalities between different samples, or patterns of glycans between different tissues or even organisms, would not be able to do so. Therefore, we have developed the GlycomeAtlas, which is a Flash-based application that can visualize the glycan structures across different tissues in human and mouse. Users can also search for particular glycans across the different tissues, and new glycome data can also be uploaded using the Profile Input option for users to visualize their own data.
2
IMPLEMENTATION
Text versions of the profiling data were obtained from the CFG website for each wild-type tissue sample in human and mouse. These data are stored in a MySQL database on the RINGS resource (Akune et al., 2010) at http://www.rings.t.soka.ac.jp/. GlycomeAtlas was built using Adobe Flash Professional CS4, using Adobe Flex and Flash Builder 4. ActionScript 3.0 was used to implement the web interface functionality, and Java Server Pages (JSP) was used to interact with the database.
3
FEATURES
The main features of GlycomeAtlas include glycan profile visualization of human and mouse tissue samples, as provided by the CFG, glycan structure search of profile data and visualization of results, and glycan profile input for users who have their own glycome data which they wish to analyze. Each of these features is described in detail here.
3.1
Glycan profile visualization
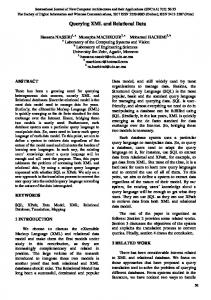
The main interface of GlycomeAtlas is depicted in Figure 1. The left-hand list of buttons provide a variety of functionality. The ‘Home’ button will jump to the RINGS web resource where this tool is housed. The ‘Help’ button will display the Help page of RINGS, the ‘Feedback’ button will display the Feedback form of RINGS in a new window and the ‘Data source’ button will display a dialog listing the tissue sample data that are stored in the database for this tool. In Figure 1, the heart of human has been selected. The glycan structures annotated to have been found in the selected sample are illustrated on the right panel, using the monosaccharide symbols as defined by the CFG (Varki et al., 2009). The center panel has two tabs of illustrations: one for human and the other for mouse samples. The list of available tissues is also listed next to the drawings, along with the number of glycans
ß The Author 2012. Published by Oxford University Press. All rights reserved. For Permissions, please e-mail:
[email protected]
2849
Y.Konishi and K.F.Aoki-Kinoshita
From the glycan list on the right panel, a similar search can be performed. Clicking on any glycan structure, that structure will be copied into the bottom panel and all tissues containing that structure will be highlighted. Unneeded glycan structures in the bottom panel can be removed by clicking the ‘X’ at the upper right corner of the particular structure. Also, adding multiple copies of the same glycan structure is avoided as glycans that are added are checked beforehand, and a message window will be displayed indicating if it has already been selected.
3.3
Fig. 1. The main interface of GlycomeAtlas. Here, the user has clicked on the heart in the diagram. Therefore, the right panel displays the glycan structures that have been annotated to be present in the human heart sample
annotated for each sample. In addition to clicking directly on the diagram, the tissue name in the list can also be clicked to obtain the same data (in the case of skin or lymph node, which may be more difficult to click directly). Note that the glycans listed have been analyzed using MALDI-TOF MS, so the glycosidic bond information is unavailable and some glycans have ambiguous linkages (such as the upper right-most glycan structure in Fig. 1 where the final terminal mannose residue exists but its parent residue is undetermined).
3.2
Glycan structure search
To search for a particular glycan structure, the user can click the ‘Glycan search’ button in the menu list on the left and a new dialog box will appear. Here, a glycan structure should be specified in LinearCodeÕ (Banin et al., 2002) format. This format is available from the CFG website for all of the glycan structures registered in their database. It is a linear string format, allowing it to be easily stored in text files. For example, the five-residue N-glycan core structure would be represented as Ma3(Ma6)Mb4GNb4GN, where M represents mannose, GN represents N-acetylglucosamine a and b represent alpha and beta, respectively, and numbers indicate the linkage position. Note, however, that since linkage information is not annotated for the data from the CFG, the following string representation would find hits in the database: M??(M??(M??)M??)M?? GN??GN. After inputting the query string and clicking the ‘draw’ button, a figure of the glycan structure will be displayed for the user to confirm the structure. Then clicking ‘input’, the query structure will be displayed in the area below the drawing. Multiple glycans can be repeatedly added to this area by using the ‘Glycan search’ dialog repeatedly. Then by moving the mouse over any of the query structures, the tissues containing that exact structure will be highlighted in both the drawing and in the data list.
2850
Glycan profile input
When a user has their own customized list of glycan structures for a particular human or mouse sample, the data can be visualized with this tool. The ‘Profile input’ button will display a dialog box for the user to specify a text file containing this information. A sample dataset is also provided to illustrate the format, which consists of three tabbed columns for organism (human or mouse), organ and glycan structure in LinearCode[textregistered] format. When the data are loaded, the table below will display the parsed list for the user to confirm. Errors in the text will be displayed in red in this table. Then by clicking the ‘input’ button, the data will be loaded into the display.
4
DISCUSSION
We present an innovative tool for analyzing glycan profiling data, without regard to the manner in which it has been obtained. Although the current database contains glycan structures with undefined linkage information, this tool can also handle fully defined glycan structures. With the visualization of glycan structures in various tissues, the user can get an idea of glycan structure localization, and this tool can aid as an educational resource as well. We plan on further developing this tool to perform higher level analyses to compare differences between tissues and animals. Moreover, easier methods for inputting glycan structures are also being investigated. Conflict of Interest: none declared.
REFERENCES Akune,Y. et al. (2010) The RINGS resource for glycome informatics analysis and data mining on the web. OMICS, 14, 475–486. Banin,E. et al. (2002) A novel linear code(r) nomenclature for complex carbohydrates. Trends Glycosci Glycotechnol., 14, 127–137. Goldberg,D. et al. (2009) Glycan family analysis for deducing n-glycan topology from single ms. Bioinformatics, 25, 365–371. Ismail,M.N. et al. (2011) High-sensitivity o-glycomic analysis of mice deficient in core 2 beta1,6-n-acetylglucosaminyltransferases. Glycobiology, 21, 82–98. North,S.J. et al. (2012) Glycomic analysis of human mast cells, eosinophils and basophils. Glycobiology, 22, 12–22. Raman,R. et al. (2005) Glycomics: an integrated systems approach to structure-function relationships of glycans. Nat Methods, 2, 817–824. Raman,R. et al. (2006) Advancing glycomics: Implementation strategies at the consortium for functional glycomics. Glycobiology, 16, 82R–90R. Varki,A. et al. (2009) Essentials of Glycobiology. Vol. 2, Cold Spring Harbor Laboratory Press, New York.