The Image Server System: A High-Speed Parallel Distributed Data Server Brian L. Tierney, William E. Johnston1, Hanan Herzog, Gary Hoo, Guojun Jin, Jason Lee, Ling Tony Chen*, Doron Rotem* Imaging and Distributed Computing Group and *Data Management Research Group Lawrence Berkeley Laboratory, 2 Berkeley, CA 94720
1.0 Introduction
Abstract
This distributed data system was developed in the context of the MAGIC3 gigabit testbed and our DOE program in high-speed distributed imaging systems. While much work has been done on using networks to provide the interconnect for workstation-based parallel computing systems (“clusters”) (see, for example [5]), not much attention has been paid to the potential of the network to provide high-speed data storage systems. In the MAGIC testbed a high-speed imaging application motivates the work of the collaborating organizations. The general goal in MAGIC is to explore the concept of using large, on-line image archives like those at the USGS’s EROS Data Center as a source of data for a terrain visualization application that ultimately might let one “walk” or “drive” through the landscape anywhere on the surface of the Earth (or elsewhere). The application combines terrain elevation models with high-resolution aerial or satellite images to produce a virtual reality - type interaction with the landscape. This type of application requires data that has been processed in such a way that the surface imagery and elevation models can be combined to form a 3-dimensional image of the landscape, algorithms that can navigate though this virtual landscape, and a way of getting the image data to the application based on the requisites of the navigator. The combination of having large data archives that might be in many different locations, the need for high-speed data delivery (300400 Mbits/s), and a desire to allow the application to be
We describe the design and implementation of a distributed parallel storage system that uses high-speed ATM networks as a key element of the architecture. Other elements include a collection of network-based disk block servers, and an associated name server that provides some file system functionality. The implementation is based on user level software that runs on UNIX workstations. Both the architecture and the implementation are intended to provide for easy and economical scalability. This approach has yielded a data source that scales economically to very high speed. Target applications include on-line storage for both very large images and video sequences. This paper describes the architecture, and explores the performance issues of the current implementation.
1. Correspondence should be directed to W. Johnston (
[email protected]), Lawrence Berkeley Laboratory, MS: 50B - 2239, Berkeley, CA, 94720. Tel: 510-486-5014, fax: 510-486-6363; or Brian Tierney (
[email protected]), Tel: 510-486-7381. (WWW: http:// george.lbl.gov) 2. This work is jointly supported by ARPA - CSTO, and by the U. S. Dept. of Energy, Energy Research Division, Office of Scientific Computing, under contract DE-AC03-76SF00098 with the University of California. This document is LBL report LBL-36002 Reference herein to any specific commercial product, process, or service by trade name, trademark, manufacturer, or otherwise, does not necessarily constitute or imply its endorsement or recommendation by the United States Government or the University of California. The views and opinions of authors expressed herein do not necessarily state or reflect those of the United States Government or the University of California, and shall not be used for advertising or product endorsement purposes. The following terms are acknowledged as trademarks: UNIX (Novell, Inc.), Sun and SPARCStation (Sun Microsystems, Inc.), DEC and Alpha (Digital Equipment Corp.), SGI and Indigo (Silicon Graphics, Inc.).
3. MAGIC (Multidimensional Applications and Gigabit Internetwork Consortium) is a gigabit network testbed that was established in June 1992 by the U. S. Government’s Advanced Research Projects Agency (ARPA)[13]. The testbed is a collaboration between Mitre, LBL, Minnesota Supercomputer Center, SRI, Univ. of Kansas, Lawrence, KS, USGS - EROS Data Center, Sprint, Northern Telecom, U. S. West, Southwest Bell, and Splitrock Telecom. More information about MAGIC may be found on the WWW home page at: http://www.magic.net/
1
LBL-36002
fully applied across servers to provide reliability in the face of network problems).
sited anywhere on the network, leads to the general requirement for a distributed source of image data. This requirement has led us to investigate the general problem of high-speed, network-distributed storage systems.
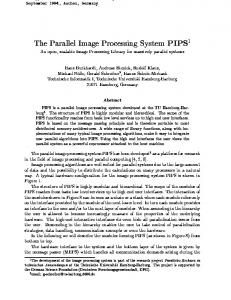
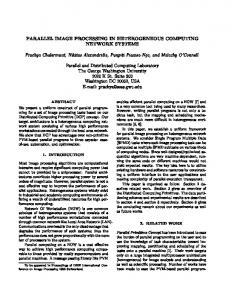
Overview The Image Server System (ISS) is an implementation of a distributed parallel data storage architecture. It is essentially a “block” server that is distributed across a wide area network to supply data to applications located anywhere in the network. See Figure 1: Parallel Data and Server Architecture Approach to the Image Server System. There is no inherent organization to the blocks, and in particular, they would never be organized sequentially on a server. The data organization is determined by the application as a function of data type and access patterns, and is implemented during the data load process. The usual goal of the data organization is that data is declustered (dispersed in such a way that as many system elements as possible can operate simultaneously to satisfy a given request) across both disks and servers. This strategy allows a large collection of disks to seek in parallel, and all servers to send the resulting data to the application in parallel, enabling the ISS to perform as a high-speed image server. The functional design strategy is to provide a highspeed “block” server, where a block is a unit of data request and storage. The ISS essentially provides only one function - it responds to requests for blocks. However, for greater efficiency and increased usability, we have attempted to identify a limited set of functions that extend the core ISS functionality while allowing support for a range of applications. First, the blocks are “named.” In
Background Current disk technology delivers about 4 Mbytes/s (32 Mbits/s), a rate that has improved at about 7% each year since 1980 [12], and there is reason to believe that it will be some time before a single disk is capable of delivering streams at the rates needed for the applications mentioned. While RAID [12] and other parallel disk array technologies can deliver higher throughput, they are still relatively expensive, and do not scale well economically, especially in an environment of multiple network distributed users, where we assume that the sources of data, as well as the multiple users, will be widely distributed. Asynchronous Transfer Mode (ATM) networking technology, due to the architecture of the SONET infrastructure that will underlie large-scale ATM networks of the future, will provide the bandwidth that will enable the approach of using ATM network-based distributed, parallel data servers to provide high-speed, scalable storage systems. The approach described here differs in many ways from RAID, and should not be confused with it. RAID is a particular data strategy used to secure reliable data storage and parallel disk operation. Our approach, while using parallel disks and servers, deliberately imposes no particular layout strategy, and is implemented entirely in software (though the data redundancy idea of RAID might be useISS disk server
ISS disk server
ISS disk server
workstation
workstation
workstation
image segments
ATM
image segments
ATM network interface ATM switch
ATM
ISS server
ATM network interface
image segments
ATM
ISS server
single high-bandwidth sink (or source)
ATM network (interleaved cell streams representing multiple virtual circuits)
Figure 1: Parallel Data and Server Architecture Approach to the Image Server System
2
LBL-36002
other words, the view from an application is that of a logical block server. Second, block requests are in the form of lists that are taken by the ISS to be in priority order. Therefore the ISS attempts (but does not guarantee) to return the higher priority blocks first. Third, the application interface provides the ability to ascertain certain configuration parameters (e.g., disk server names, performance, disk configuration, etc.) in order to permit parameterization of block placement-strategy algorithms (for example, see [2]). Fourth, the ISS is instrumented to permit monitoring of almost every aspect of its functioning during operation. This monitoring functionality is designed to facilitate performance tuning and network performance research; however, a data layout algorithm might use this facility to determine performance parameters. At the present state of development and experience, the ISS that we describe here is used primarily as a large, fast “cache”. Reliability with respect to data corruption is provided only by the usual OS and disk mechanisms, and data delivery reliability of the overall system is a function of user-level strategies of data replication. The data of interest (tens to hundreds of GBytes) is typically loaded onto the ISS from archival tertiary storage, or written into the system from live video sources. In the latter case, the data is also archived to bulk storage in real-time.
an application at about 400 Mbits/s (50 Mbytes/s) using these relatively low-cost, “off the shelf” components by exploiting the parallelism provided by approximately five servers, twenty disks, ten SCSI host adaptors, and five network interfaces. Prototypes of the ISS have been built and operated in the MAGIC network testbed. Other papers on the ISS are [16], which focus on the major implementation issues, [17], which focuses on the architecture and approach, as well as optimization strategies, and [18], which focuses on ISS applications and ISS performance issues.
2.0 Related Work There are other research groups working on solving problems related to distributed storage and fast multimedia data retrieval. For example, Ghandeharizadeh, Ramos, et al., at USC are working on declustering methods for multimedia data [3], and Rowe, et al., at UCB are working on a continuous media player based on the MPEG standard [14]. Similar problems are also being solved by the Massively-parallel And Real-time Storage (MARS) project [1], which is similar to the ISS, but uses special purpose hardware such as RAID disks and a custom ATM Port Interconnect Controller (APIC). In some respects, the ISS resembles the Zebra network file system, developed by John H. Hartman and John K. Ousterhout at the University of California, Berkeley [4]. However, the ISS and the Zebra network file system differ in the fundamental nature of the tasks they perform. Zebra is intended to provide traditional file system functionality, ensuring the consistency and correctness of a file system whose contents are changing from moment to moment. The ISS, on the other hand, tries to provide very highspeed, high-throughput access to a relatively static set of data.
Client Use The client-side (application) use of the ISS is provided through a library that handles initialization (for example, an “open” of a data set requires discovering all of the disk servers with which the application will have to communicate), and the basic block request / receive interface. It is the responsibility of the client (or its agent) to maintain information about any higher-level organization of the data blocks, to maintain sufficient local buffering so that “smooth playout” requirements may be met locally, and to run predictor algorithms that will pre-request blocks so that application response time requirements can be met. None of this has to be explicitly visible to the user-level application, but some agent in the client environment must deal with these issues, because the ISS always operates on a best-effort basis: if it did not deliver a requested block in the expected time or order, it was because it was not possible to do so.
3.0 Applications There are several target applications for the initial implementation of the ISS. These applications fall into two categories: image servers and multimedia / video file servers. 3.1 Image Server The initial use of the ISS is to provide data to a terrain visualization application in the MAGIC testbed. This application, known as TerraVision [9], allows a user to navigate through and over a high resolution landscape represented by digital aerial images and elevation models. TerraVision is of interest to the U.S. Army because of its ability to let a commander “see” a battlefield environment. TerraVision is very different from a typical “flight simulator”-like program in that it uses high-resolution aerial imagery for the visualization instead of simulated terrain.
Implementation In our prototype implementations, the typical ISS consists of several (four - five) UNIX workstations (e.g. Sun SPARCStation, DEC Alpha, SGI Indigo, etc.), each with several (four - six) fast-SCSI disks on multiple (two three) SCSI host adaptors. Each workstation is also equipped with an ATM network interface. An ISS configuration such as this can deliver an aggregated data stream to
3
LBL-36002
Tiled ortho images of landscape.
11
13 14 15 16 17 21 22 23 24 25 26 27 31 32 33 34 35 36 37 43 44 42 41 45 46 47 53 52 54 55 56 57 51 64 67 62 61 63 65 66 73 74 71 75 76 77 72
Tiles intersected by the path of travel: 74, 64, 63, 53, 52, 42, 32, 33
12
Data placement algorithm results in mapping tiles along path to several disks and servers. tile 74 64 63 53 52 42 32
Path of travel.
ISS server 1 D1
TerraVision
D2
ISS server 2
64 42
74 53
ATM
server and disk S1D1 S1D2 S2D1 S1D1 S2D2 S1D2 S2D1
D1
network
D2
63
52
32
ATM
Servers and disks operate in parallel to supply tiles to the application.
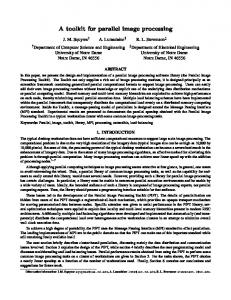
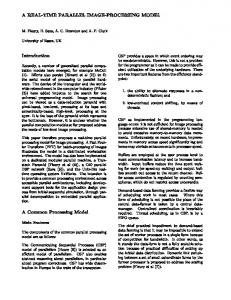
Figure 2: ISS Parallel Data Access Strategy as Illustrated by the TerraVision Application
TerraVision requires large amounts of data, transferred at both bursty and steady rates. The ISS is used to supply image data at hundreds of Mbits/s rates to TerraVision. No data compression is used with this application because the bandwidth requirements are such that real-time decompression is not possible without using special purpose hardware. In the case of a large-image browsing application like TerraVision, the strategy for using the ISS is straightforward: the image is tiled (broken into smaller, equal-sized pieces), and the tiles are scattered across the disks and servers of the ISS. The order of tiles delivered to the application is determined by the application predicting a “path” through the image (landscape), and requesting the tiles needed to supply a view along the path. The actual delivery order is a function of how quickly a given server can read the tiles from disk and send them over the network. Tiles will be delivered in roughly the requested order, but small variations from the requested order will occur. These variations must be accommodated by buffering, or other strategies, in the client application. Figure 2: ISS Parallel Data Access Strategy as Illustrated by the TerraVision Application shows how image tiles needed by the TerraVision application are declustered across several disks and servers. More detail on this declustering is provided below. Each ISS server is independently connected to the network, and each supplies an independent data stream into and through the network. These streams are formed into a single network flow by using ATM switches to combine the streams from multiple medium-speed links onto a single high-speed link. This high-speed link is ultimately
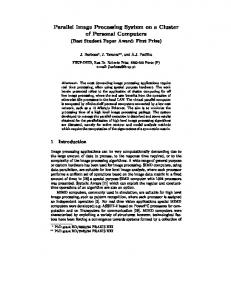
connected to a high-speed interface on the visualization platform (client). On the client, data is gathered from buffers and processed into the form needed to produce the user view of the landscape. This approach could supply data to any sort of largeimage browsing application, including applications for displaying large aerial-photo landscapes, satellite images, X-ray images, scanning microscope images, and so forth. Figure 3: Use of the ISS for Single High-Bandwidth App. shows how the network is used to aggregate several medium-speed streams into one high-speed stream for the image browsing application. For the MAGIC TerraVision Large Image Browsing Scenario (MAGIC TerraVision application) ISS ISS ISS
ATM ATM
ATM switch
MAGIC application
ISS
Figure 3: Use of the ISS for Single High-Bandwidth App.
application, the application host (an SGI Onyx) is using multiple OC-3 (155 Mbit/s) interfaces to achieve the bandwidth requirements necessary. These multiple interfaces will be replaced by a single OC-12 (622 Mbit/s) interface when it becomes available. In the MAGIC testbed (see Figure 4: MAGIC Testbed Application and Storage System Architecture), the ISS has
4
LBL-36002
EROS Data Center USGS ISS disk server
ISS load (implements data placement strategy)
ISS disk server
archival storage
MSC
ATM
ATM switch
ATM
UNI ISS disk server
HIPPI ATM Gateway
ATM
to other ISS servers US Army, Ft. Leavenworth application platform (e.g. TerraVision) application ISS interface ATM
Minneapolis, MN ATM backbone (Sprint, OC-48 SONET network)
Sioux
Falls,
SD
Sprint Technology Integration Center, Kansas City
S
City, K Kansas
S
nworth, K
w
La
Ft. Leave
application
nc
re
UNI
e,
ISS disk server ATM UNI U. of Kansas, Lawrence
KS
ATM
applicatio application
application
ISS disk server
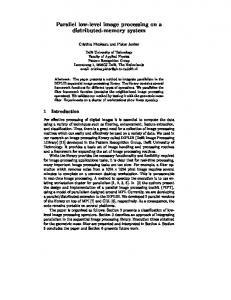
Figure 4: MAGIC Testbed Application and Storage System Architecture
been run in several ATM WAN configurations to drive several different applications, including TerraVision. The configurations include placing ISS servers in Sioux Falls, South Dakota (EROS Data Center), Kansas City, Kansas (Sprint), and Lawrence, Kansas (University of Kansas), and running the TerraVision client at Fort Leavenworth, Kansas (U. S. Army’s Battle Command Battle Lab). The ISS disk server and the TerraVision application are separated by several hundred kilometers, the longest link being about 700 kilometers.
Video File Server Scenario ISS
ATM
Receiver
ISS
ATM
Receiver
ISS
ATM
Receiver
ISS
ATM
Receiver
Figure 5: Use of the ISS to Supply many Low-Bandwidth Streams
the Time Warner / Silicon Graphics video server [8]. Because of the relatively low cost and ease of scalability of our approach, it may address a wider scale, as well as a greater diversity, of data organization strategies so as to serve the diverse needs of schools, research institutions, and hospitals for video-image servers in support of various educational and research-oriented digital libraries. 4.0 Sample Medical Application4
3.2 Video Server Examples of video server applications include video players, video editors, and multimedia document browsers. A video server might contain several types of streamlike data, including conventional video, compressed video, variable time base video, multimedia hypertext, interactive video, and others. Several users would typically be accessing the same video data at the same time, but would be viewing different streams, and different frames in the same stream. In this case the ISS and the network are effectively being used to “reorder” segments (see Figure 5: Use of the ISS to Supply many Low-Bandwidth Streams). This reordering affects many factors in an image server system, including the layout of the data on disks. Commercial concerns such as Time Warner and U.S. West are building large-scale commercial video servers such as
An example of a medical application where we will be using this technology is the collection and playback of
4. This work is being done in conjunction with Dr. Joseph Terdiman, Kaiser Permanente Division of Research, and Dr. Robert Lundstrum, San Francisco Kaiser Hospital Cardiac Catheterization Laboratory. The implementation is being done with the support of a Pacific Bell CalREN grant (ATM network access), and in collaboration with Sun Microsystems and Phillips Palo Alto Research Laboratory.
5
LBL-36002
all over the network. In this case, “coherent” means “in the order needed by the application”. No one disk server will ever be capable of delivering the entire stream. The network is the server. • The ISS should be affordable. While something like a HIPPI-based RAID device might be able to provide functionality similar to the ISS, this sort of device is very expensive, is not scalable, and is a single point of failure.
angiography images. Procedures used to restore coronary blood flow, though clinically effective, are expensive and have contributed significantly to the rising cost of medical care. To minimize the cost of such procedures, medical care providers are beginning to concentrate these services in a few high-volume tertiary care centers. Patients are usually referred to these centers by cardiologists at their home facilities; the centers then must communicate the results back to the local cardiologists as soon as possible after the procedure. The advantages of providing specialized services at distant tertiary centers are significantly reduced if the medical information obtained during the procedure is not delivered rapidly and accurately to the treating physician in the patient's home facility. The delivery systems currently used to transfer patient information between facilities include interoffice mail, U.S. Mail, fax machine, telephone, and courier. Often these systems are inadequate and potentially could introduce delays in patient care. With an ATM network and a high-speed image file server, still image and video sequences can be collected from the imaging systems. These images are sent through an ATM network to storage and analysis systems, as well as directly to the clinic sites. Thus, data can be collected and stored for later use, data can be delivered live from the imaging device to remote clinics in real-time, or these data flows can all be done simultaneously. Whether the ISS servers are local or distributed around the network is entirely a function of the optimal logistics. There are arguments in regional healthcare information systems for centralized storage facilities, even though the architecture is that of a distributed system. See, for example, [7].
5.2 Approach A Distributed, Parallel Server The ISS design is based on the use of multiple lowcost, medium-speed disk servers which use the network to aggregate server output. To achieve high performance we exploit all possible levels of parallelism, including that available at the level of the disks, controllers, processors / memory banks, servers, and the network. Proper data placement strategy is also key to exploiting system parallelism. At the server level, the approach is that of a collection of disk managers that move requested data from disk to memory cache. Depending on the nature of the data and its organization, the disk managers may have a strategy for moving other nearby and related data from disk to memory. However, in general, we have tried to keep the implementation of data prediction (determining what data will be needed in the near future) separate from the basic data-moving function of the server. Prediction might be done by the application (as it is in TerraVision), or it might be done be a third party that understands the data usage patterns. In any event, the server sees only lists of requested blocks. As explained below, the dominant bottlenecks for this type of application in a typical UNIX workstation are first memory copy speed, and second, network access speed. For these reasons, an important design criterion is to use as few memory copies as possible, and to keep the network interface operating at full bandwidth all the time. Another important aspect of the design is that all components are instrumented for timing and data flow monitoring in order to characterize ISS and network performance. To do this, all communications between ISS components are timestamped. In the MAGIC testbed, we are using GPS (Global Positioning System) receivers and NTP (Network Time Protocol) [11] to synchronize the clocks of all ISS servers and of the client application in order to accurately measure network throughput and latency.
5.0 Design 5.1 Goals The following are some of our goals in designing the ISS: • The ISS should be capable of being geographically distributed. In a future environment of large scale, high-speed, mesh-connected national networks, network distributed storage should be capable of providing an uninterruptable stream of data, in much the same way that a power grid is resilient in the face of source failures, and tolerant of peak demands, because of the possibility of multiple sources multiply interconnected. • The ISS approach should be scalable in all dimensions, including data set size, number of users, number of server sites, and aggregate data delivery speed. • The ISS should deliver coherent image streams to an application, given that the individual images that make up the stream are scattered (by design)
Data Placement Issues A limiting factor in handling large data sets is the long delay in managing and accessing subsets of these data sets. Slow I/O rates, rather than processor speed, are
6
LBL-36002
chiefly the cause of this delay. One way to address this problem is to use data reorganization techniques based on the application’s view of the structure of the data, analysis of data access patterns, and storage device characteristics. By matching the data set organization with the intended use of the data, substantial improvements can be achieved for common patterns of data access[2]. This technique has been applied to large climate-modeling data sets, and we are applying it to TerraVision data stored in the ISS. For image tile data, the placement algorithm declusters tiles so that all disks are evenly accessed by tile requests, but then clusters tiles that are on the same disk based on the tiles’ relative nearness to one another in the image. This strategy is a function of both the data structure (tiled images) and the geometry of the access (e.g., paths through the landscape). The declustering method used for tiles of large images is a lattice-based (i.e., vector-based) declustering scheme, the goal of which is to ensure tiles assigned to the same server are as far apart as possible on the image plane. This minimizes the chance that the same server will be accessed many times by a single tile request list. Tiles are distributed among K disks by first determining a pair of integer component vectors which span a parallelogram of area K. Tiles assigned to the same disk are separated by integer multiples of these vectors. Mathematical analysis shows that for common visualization queries this declustering method performs within seven percent of optimal for a wide range of practical multiple disk configurations. Within a disk, however, it is necessary to cluster the tiles such that tiles near each other in 2-D space are close to each other on disk, thus minimizing disk seek time. The clustering method used here is based on the Hilbert Curve because it has been shown to be the best curve that preserves the 2-D locality of points in a 1-D traversal.
ble branch points. (A “branch point” occurs where a user might select one of several possible play clips, see Figure 6: Image Stream Management / Prediction Strategy). As a database structure Multimedia program that consists of multiple threads (M+A+B+C), whose play order is not known in advance. 16 15 14 13 12 C
program that will be played
13 12 11 10 9 8 7 6 5 4 3 2 1 M 13 12 11 10 9a 8a A current play position 15 14 13 12 11 B client (multimedia player) structure of the image database
ISS request list (based on all play thread possibilities in the immediate future)
predictor
user interaction current location
{ 7, 8, 9, 8a, 9a, 10, 10a, 11 }
fold in rerequested tiles { 9, 10, 10a } re-request list
11
X X 9a 8a X 8 recv buffer (X=missing)
7
Figure 6: Image Stream Management / Prediction Strategy
branch point is approached by the player, the predictor (without knowledge of which branch will be taken) will start requesting images (frames) along both branches. These images are cached first at the disk servers, then at the receiving application. As soon as a branch is chosen, the predictor ceases to send requests for images from the other branches. Any “images” (i.e., frames or compressed segments) cached on the ISS, but unsent, are flushed as better predictions fill the cache. This is an example where a relatively independent third party might do the prediction. The client will keep asking for an image until it shows up, or until it is no longer needed (e.g., in TerraVision, the application may have “passed” the region of landscape that involves the image that was requested, but never received.) Applications will have different strategies to deal with images that do not arrive in time. For example, TerraVision keeps a local, low-resolution data set to fill in for missing tiles. Prediction is transparent to the ISS, and is manifested only in the order and priority of images in the request list. The prediction algorithm is a function of the client application, and typically runs on the client.
Path Prediction Path prediction is important to ensure that the ISS is utilized as efficiently as possible. By using a strategy that always requests more tiles than the ISS can actually deliver before the next tile request, we can ensure that no component of the ISS is ever idle. For example, if most of a request list’s tiles were on one server, the other servers could still be reading and sending or caching tiles that may be needed in the future, instead of idly waiting. The goal of path prediction is to provide a rational basis for prerequesting tiles. See [2] for more details on data placement methods. As a simple example of path prediction, consider an interactive video database with a finite number of distinct paths (video clips), and therefore a finite number of possi-
7
LBL-36002
The Significance of ATM Networks The design of the ISS depends in part on the ability of ATM switches and networks to aggregate multiple data streams from the disk servers into a single high-bandwidth stream to the application. This is feasible because most wide area ATM network aggregate bandwidth upward that is, the link speeds tend to increase from LANs to WANs, and even within WANs the “backbone” is the highest bandwidth. (This is actually a characteristic of the architecture of the SONET networks that underlie ATM networks.) Aggregation of stream bandwidth occurs at switch output ports. For example, three incoming streams of 50 Mbits/s that are all destined for the same client will aggregate to a 150 Mbit/s stream at the switch output port. The client has data stream connections open to each of the ISS disk servers, and the incoming data from all of these streams typically put data into the same buffer.
tile (image)
name server
other ISS servers
network
ISS disk server
read tile list
send tiles
cache manager cache
disk reader
disk reader
disk reader
disk reader
Figure 7: ISS Architecture
Server usage to avoid network or ISS Disk Server bottlenecks. Name Server The Name Server listens for tile request lists from the application. After receiving a list, the Name Server does a table lookup to determine where the data is located (i.e. which server, which disk, and the disk offset). The Name Server then passes this list to the ISS Disk Server.
6.0 ISS Architecture and Implementation The following is a brief overview of a typical ISS operation. A data set must first be loaded across a given set of ISS hosts and disks, and a table containing disk/offset locations for each block of data is stored on each host. The application sends requests for data (images, video, sound, etc.) to the Name Server process on each Disk Server host, which does a lookup to determine the location (server disk - offset) of the requested data. If the data is not stored on that host, the request is discarded with the assumption that another host will handle it; otherwise the list of locations is passed to the ISS Disk Server. Each Disk Server then checks to see if the data is already in its cache, and if not, fetches the data from disk and transfers it to the cache. Once the data is in the cache, it is sent to the requesting application. In the following sections, we describe the basic software modules, their functions, how they relate to each other, and some of the terms and models that were used in the design of the ISS. Figure 7: ISS Architecture shows how the components of the relate to each other.
ISS Disk Server There is one ISS Disk Server process for each ISS host. It is responsible for all ISS memory buffer and request list management on that host. The Disk Server receives image requests from the Master process, and determines if the image is already in its buffer cache. If it is already in the buffer cache (which is kept entirely in available memory), the request is added to the “to send” list. Otherwise, it is added to a “to read” list. Tile requests that have not been satisfied by the time the next list from the Master process arrives are “flushed” (discarded) from the lists. All requests that haven’t been either read off of disk or written to the network interface are removed from all request lists, and any memory buffers waiting to be written are returned to the hash table. Note that if a tile read has completed, but the tile has not yet been sent to the network, the data stays in the cache, so that if that tile is in the next request list it will be sent first. Those buffers that were waiting to be filled with data from the disk are put at the head of an LRU (Least Recently Used) list so they may be used for requests in the newly arrived list. The Disk Server process also periodically sends status information to the Master. ISS buffer management is very similar to that of the UNIX operating system, and many of the ideas for lists, hashing, and the format of the headers have been adopted from UNIX for use within the ISS [10]. A buffer can be
ISS Master The ISS Master process is responsible for applicationto-ISS startup communication, Disk Server process initialization, performance monitoring, and coordination between multiple ISS Disk Servers. This includes the ability to collect performance and usage statistics of all ISS components. In the future, we plan to extend the functionality of the Master to dynamically reconfigure ISS Disk
8
LBL-36002
freed from the hash table in one of two ways. If a buffer was allocated to a list (read/send) and that list was flushed, the buffer is returned to the head of the LRU list so that it is the next buffer to be reused. A buffer may also naturally progress through the LRU list until it has reached the end of the list, at which time it is recycled. The Disk Server handles three request priority levels: • high: send first, with an implicit priority given by order within the list. • medium: send if there is time. • low: fetch into the cache if there is time, but don't send. The priority of a particular request is set by the requesting application. The application’s prediction algorithm should use these priority levels to keep the ISS fully utilized at all times without requesting more data than the application can process. For example, the application should send low priority requests to pull data into the ISS cache that the application will need in the near future; this data is not sent to the application until the application is ready. Another example is an application that plays back a movie with a sound track, where audio might be high priority requests, and video medium priority requests.
bandwidth of various components of a fairly typical highend UNIX workstation (a Sun SPARCStation Model 10/ 41). Disks: 3.5”, 7200 rpm; 2.5 GBytes; 8 ms seek (avg); 7 Mbytes/sec read
Disk controller
SCSI-2 Bus: 10 Mbytes/sec
Disk controller
network Network interface
I/O subsystem interface
7 Mbytes/sec (actual for 3-4 disks)
Disk controller 40 MBytes/sec workstation I/O buses
Memory system
SCSI host adaptor
SCSI host adaptor
C CPUs C C
100+ MBytes/ sec system bus
I/O subsystem interface
Data Movement Characteristics for a Typical Workstation (performance figures are manufacture’s spec, unless indicated)
Figure 8: Workstation Speeds
The numbers listed below are specs from the manufacturer, followed by our measurements using 49152-byte data blocks (the size currently used by TerraVision) on a Sun SPARCStation 10-41. • Seagate Barracuda Disks: - 7 Mbytes/s (56 Mbits/s) sustained, 8 msec average seek time (spec) - 2.6 Mbytes/s (21 Mbits/s) (measured) • Fast-SCSI Host adaptor: - 10 Mbytes/s (80 Mbits/s) (spec) - 5 Mbytes/s (40 Mbits/s) using two disks (measured) • Other limits: - Sbus: 40 Mbytes/s (320 Mbits/s) (spec) - CPU to RAM Interconnect (MBus): 105 Mbytes/ s (840 Mbits/s) (spec) - UNIX “memcpy” speed: 22 Mbytes/s (176 Mbits/s) (measured) - network ATM interface: 9.4 Mbytes/s (75 Mbits/s) (measured, UDP) From these numbers we conclude that three to four disks are needed to saturate a SCSI host adaptor, that three to four SCSI adaptors are needed to saturate the I/O bus, and that the main bottleneck is the speed of a memory to memory copy.
ISS Reader The ISS Reader process reads data off of disk and puts it into the buffer cache that is managed by the Disk Server process. There is one Reader per physical disk. This process continually checks for requests in the “to read” list, starts a read operation on that disk if a request is pending, then waits for the data to be read. Once the data is read off of disk the request is moved into the list of data that is to be written out. There are two distinct lists of data that are to be written out, one for each of the high and medium priority levels described above. ISS Sender The ISS Sender process sends all data in the “to send” list out to the application that requested it. There is one sender per network interface. This process continually checks the list of data that is ready to be written out, looking for data that is of high or medium priority (as described above). Note that data of medium priority will only be sent if there is no data of high priority in the cache. However, it is possible for medium priority data to be written out before higher priority data, as in the case where the medium priority data is in the memory cache, and higher priority data is resident on disk.
7.1 Performance Limits The bandwidth limits of all hardware components are shown in the previous section. Using a Sun SPARCStation 10-41 with two Fast-SCSI host adaptors and four disks, and reading into memory random 48-Kbyte blocks from all disks simultaneously, we have measured a single server
7.0 Workstation Technology Issues To analyze the performance of the ISS software, we first need to examine the characteristics of the hardware components. Figure 8: Workstation Speeds shows the data
9
LBL-36002
disk-to-memory throughput of 9 Mbytes/s. When we add a process which sends UDP packets to the ATM interface, this reduces the disk-to-memory throughput to 8 Mbytes/s (64 Mbits/s). The network throughput under these conditions is 7.5 Mbytes/s (60 Mbits/s). This number is an upper performance limit that does not include the ISS overhead of buffer management, semaphore locks, and context switching. The SCSI host adaptor and Sbus are not yet saturated, but adding more disks will not help the overall throughput without a faster access to the network (e.g. multiple interfaces).
For a detailed description of factors that affect highspeed network I/O, including memory copy speed, see Steenkiste[15].
7.3 TCP/IP Performance TCP speeds are bounded by the window size divided by the round trip time. The TCP window is the amount of buffer space available on the receiver end of a TCP connection. The larger the buffer space, the more packets the receiver can accept before the host has to process them or tell the sending application to slow down. The buffer size also affects the number of packets that can be outstanding, or “in the pipe” [6]. We have found that with long distance ATM networks, a large TCP window is extremely important, as is expected for a high-bandwidth, large-delay network. Table 1 shows TCP speeds vs. TCP window size as measured using ttcp5 in an ATM LAN and ATM WAN environment. This table clearly shows the importance of
7.2 Memory Copy Speed Since the main bottleneck appears to be memory copy speed, we performed some tests on several high-end workstations, including some newer workstations that use interleaved memory. Figure 9: Memory Speed shows our results.The following systems were tested: Sun SPARCS-
Aggregate memory copy speed (MBytes/s)
Memory copy bandwidth as a function of number of processors and processes
TABLE 1.
100 SGI Onyx; 4 CPUs
TCP speed over ATM
4 CPUs
80
Window size 16K
6 CPUs 2 CPUs
60 1 CPU
LAN Sun to Sun (Mb/s) LAN Alpha to Alpha WAN Sun to Sun WAN Alpha to Alpha
Sun Sparc-1000 6 CPUs SGI Challenge L; 2 CPUs
40 DEC Alpha 3000 / 400; 1 CPU
20 1 CPU
Sun S10/41; 1 CPU
0 1 2 4 6 8 Number of processes (1.2 MBy copy buffer)
10
24K
32K
64K
96K 128K 192K 256K
30
34
54
*
*
*
*
*
62
56
60
110
117
126
118
114
11
12
27
37
46
47
47
48
6.5
7.2
12.5
25
35.9 48.7 72.5 91.8
Note: all speeds for are 64K Byte transfers of data; * = data not available Alpha to Alpha speeds are courtesy of Joseph Evans, University of Kansas, Lawrence, KS. ATM interface for Sun (SS 10/41) is SBA-200 from FORE Systems, ATM for Alpha (DEC-3000/400) is the “Otto” card from DEC. ATM switch is from FORE Systems. Sun to Sun: LAN RTT = 2 ms (through 1 ATM switch), WAN RTT = 8 ms (through 2 ATM switches). Alpha to Alpha: LAN RTT = 1 ms (no switch), WAN RTT = 16 ms (through 2 ATM Switches).
Figure 9: Memory Speed
tation 10/41 (one processor), Sun SPARCserver-1000 (six processors), a DEC Alpha 3000/400 (one processor), an SGI Challenge L (two processors), and an SGI Onyx (four processors). Our first results indicated poor memory copy bandwidth relative to the hardware potential of the memory subsystem for all of the workstations that we considered. Subsequent testing on multiprocessor systems (illustrated in Figure 9) showed that the problem apparently lies in the OS or memory controller, because each CPU can get almost the same memory bandwidth simultaneously, up to the memory subsystem performance level. In the multiprocessor machines where a single CPU could not saturate the memory subsystem (true for both multiprocessor machines that we tested), the addition of more disks and multiple network adaptors operated by different CPUs should result in linear speedup, up to the memory subsystem bandwidth.
the TCP window size with ATM networks, especially in the WAN environment when some other factor is not the limit. Using the default TCP window sizes of 24 KBytes (Sun) or 32 KBytes (DEC and SGI), an ATM-based application would only see Ethernet-like speeds!
8.0 Current Status All ISS software is currently tested and running on Sun workstations (SPARCstations and SPARCserver 1000’s)
5. ttcp is a utility that times the transmission and reception of data
between two systems using the UDP or TCP protocols.
10
LBL-36002
running SunOS 4.1.3 and Solaris 2.3, DEC Alpha’s running OSF/1, and SGI’s running IRIX 5.x. Demonstrations of the ISS with the MAGIC Terrain Visualization application TerraVision have been done using several WAN configurations in the MAGIC testbed. Using enough disks (48, depending on the disk and system type), the ISS software has no difficulty saturating current ATM interface cards. We have worked with 100 Mbit and 140Mbit TAXI S-Bus and VME cards from Fore systems, and OC-3 (155 Mbit/s) cards from DEC.
As an example, a typical TerraVision request list contains fifty tiles. Of these fifty tiles, forty are read into ISS cache, twenty-five are written to the network, and ten are not processed at all. This behavior is reasonable because, as discussed in the section on data path prediction above, the application will keep asking for data until it shows up or is no longer needed. The requesting application will anticipate this behavior, and predict the tiles it needs far enough ahead that “important” tiles are always received by the time they are needed. Tiles are kept in the cache on an LRU basis, and previously requested but unsent tiles will be found in the cache by a subsequent request. The overhead of re-requesting tiles is minimal compared with moving them from disk and sending them over the network. During ISS operation, the average CPU usage on the disk server platform is 10% user, 60% system, and 30% idle, so the CPU is not a bottleneck. With the TerraVision application and 40 Mbytes of disk cache memory on the ISS server, on average 2% of requested tiles are already in cache. Increasing the cache size will not increase the throughput, but may improve latency with effective path prediction by the application.
Table 2, below, shows various system ttcp speeds and ISS speeds. The first column is the maximum ttcp speeds using TCP over an ATM LAN with a large TCP window size. In this case, ttcp just copies data from memory to the network. For the values in the second column, we ran a program that continuously reads from all ISS disks simultaneously with ttcp operation. This gives us a much more TABLE 2. Max ATM System LAN ttcp Sun SS10/41 70 Mbits/sec Sun SS1000 75 Mbits/sec (2 processors) SGI Challenge L 82 Mbits/sec (2 processors) DEC Alpha 3000/400 127 Mbits/s
ttcp w/ disk read 60 Mbits/sec
Max ISS speed 55 Mbits/sec
65 Mbits/sec
60 Mbits/sec
72 Mbits/sec
65 Mbits/sec
95 Mbits/sec
88 Mbits/sec
8.2 Bottlenecks The main bottleneck for the server is the speed of moving data into and out of memory. A SPARCStation 10, for example, uses 70ns SIMMs (RAM chips), which means that memory copies are limited to about 22 Mbytes/s (176 Mbits/s). When writing to the network, the situation is even worse because data are moved to the interface via UNIX “mbufs” [10], adding additional overhead. We have measured the speed of an mbuf copy as 19 Mbytes/s (152 Mbits/s), and there are two mbuf copies required to send a packet to the network. Along with the other overhead required to assemble packets, this limits the speed with which we can write to the network to 9.2 Mbytes/s (74 Mbits/s). If the network sends were faster, i.e., 19.4 Mbytes/s (155 Mbits/s - the OC-3 rate, ignoring ATM overhead), the next bottleneck would be the disk reading speed, which in this configuration is 9 Mbytes/s (72 Mbits/s). This bottleneck is trivially removed by adding more disks. This brings us back the “memcpy” limit of 22 Mbytes/s as the next bottleneck. The other bottlenecks are not likely to be relevant in the near future. Increasing the speed of workstation memory is the key to increased performance for this application.
realistic value for what network speeds the system is capable of while the ISS is running. The last column is the actual throughput values measured from the ISS. These speeds indicate that the ISS software adds a relatively small overhead in terms of maximum throughput.
8.1 Actual Performance The current throughput of a single ISS server on a Sun SPARC 10/41 platform is 7.1 Mbytes/s (55 Mbits/s), or 91% of the possible maximum of 7.5 Mbytes/s (60 Mbits/s) derived above. This seems a reasonable result considering the overhead required. We have achieved this speed using a TerraVision-like application simulator which we developed that sends a list of requests for data at a rate of five request lists per second. Five request lists per second does not force the application to predict and buffer too far into the future, but is not so fast that disk read latency is an issue. This application simulator sends request lists that are long enough to ensure that no disk ever is idle. When the ISS receives a request list, all previous requests are discarded. Under these conditions, about one-half of the requests in each request list will never be satisfied (either they will be read into the cache but not written to the network, or they will not be read at all before the next request list arrives).
8.3 Expected Performance Using next generation workstations, most of these bottlenecks are alleviated considerably. The most important improvement is that of interleaved memory. For example, a Sun SPARCServer 1000 provides two-way interleaved
11
LBL-36002
memory, up to four SBuses at 50 Mbytes/s (400 Mbits/s) and a 250 Mbytes/s (2 Gbits/s) interconnect. The SGI Challenge L has eight-way interleaved memory and a 1250 Mbytes/s bus. Using this type of system should improve ISS performance considerably. These systems also can be configured with up to twelve processors. An ISS running on a multiprocessor system with interleaved memory should have substantially higher throughput.
[7]
[8] [9] [10]
9.0 Future Work We plan to expand the capabilities of the ISS considerably during the next year or so. These enhancements (and associated investigation of the issues) will include: • Multiple data set data layout strategy; • Capability to write data to the ISS; • Ability to monitor the state of all ISS servers and dynamically assign bandwidth of individual servers to avoid overloading the capacity of a given segment of the network (i.e., switches or application host); • Mechanisms for handling video-like data, including video data placement algorithms and the ability to handle variable size frames (JPEG/MPEG); • Name server redesign to accommodate information about server performance and availability and to provide a mechanism to request tiles from the “best” server (fastest or least loaded); • Issues involved in dealing with data other than image- or video- like data. Many of these enhancements will involve extensions to the data placement algorithm and the cache management methods. Also we plan to explore some optimization techniques, including using larger disk reads, and conversion of all buffer and device management processes to threads-based light weight processes.
[11] [12]
[13] [14]
[15] [16]
[17]
[18]
Johnston, W., and Allen, A., M.D., “Regional Health Care Information Systems: Motivation, Architecture, and Implementation”, Lawrence Berkeley Laboratory report no. 34770, Berkeley, CA, 94720. Langberg, M., “Silicon Graphics Lands Cable Deal with Time Warner Inc.”, San Jose Mercury News, June 8, 1993. Leclerc, Y.G. and Lau, S.Q., Jr., “TerraVision: A Terrain Visualization System”, SRI International, Technical Note #540, Menlo Park, CA, 1994. Leffler, S.J., McKusick, M.K., and Quarterman, J.S., “The Design and Implementation of the 4.3BSD UNIX Operating System”, Addison-Wesley, Reading, Mass., 1989. Mills, D., “Simple Network Time Protocol (SNTP)”, RFC 1361, University of Delaware, August 1992. Patterson, D., Gibson, R., and Katz, R., “The Case for RAID: Redundant Arrays of Inexpensive Disks”, Proceedings ACM SIGMOD Conference, Chicago, IL, May, 1988 (pp. 106-113) Richer, I. and Fuller, B.B., “An Overview of the MAGIC Project,” M93B0000173, The MITRE Corp., Bedford, MA, 1 Dec. 1993. Rowe, L. and Smith, B.C., “A Continuous Media Player”, Proc. 3rd International Workshop on Network and Operating System Support for Digital Audio and Video, San Diego, CA, Nov. 1992. Steenkiste, P.A., “A Systematic Approach to Host Interface Design for High Speed Networks”, IEEE Computer, Vol 27, No 3, March 1994. Tierney, B., Johnston, W., Herzog, H., Hoo, G., Jin, G., and Lee, J., “System Issues in Implementing High Speed Distributed Parallel Storage Systems”, Proceedings of the USENIX Symposium on High Speed Networking, Aug. 1994, LBL-35775. Tierney, B., Johnston, W., Chen, L.T., Herzog, H., Hoo, G., Jin, G., Lee, J., and Rotem, D., “Distributed Parallel Data Storage Systems: A Scalable Approach to High Speed Image Servers”, Proceedings of ACM Multimedia ‘94, Oct. 1994, LBL-35408. Tierney, B., Johnston, W., Chen, L.T., Herzog, H., Hoo, G., Jin, G., Lee, J., “Using High Speed Networks to Enable Distributed Parallel Image Server Systems”, Proceedings of Supercomputing ‘94, Nov. 1994, LBL-35437.
10.0 References [1] [2] [3]
[4] [5] [6]
Buddhikot, M. M., Parulkar, G., and Cox, J., “Design of a Large Scale Multimedia Storage Server”, Proceedings of INET '94 / JENC5, 1994. Chen L. T. and Rotem D., “Declustering Objects for Visualization”, Proc. of the 19th VLDB (Very Large Database) Conference, 1993. Ghandeharizadeh, S. and Ramos, L, “Continuous Retrieval of Multimedia Data Using Parallelism”, IEEE Transactions on Knowledge and Data Engineering, Vol 5, No 4, August 1993. Hartman, J. H. and Ousterhout, J. K., “Zebra: A Striped Network File System”, Proceedings of the USENIX Workshop on File Systems, May 1992. Hayes, A., Brooks III, E.D., Nash, T., and Winkler, K.H., “The Role of Computational Clusters”, Proceedings of Supercomputing ‘92, Nov. 1992. Jacobson, V., Braden, R.T., and Borman D.A. “TCP Extensions for High Performance,” RFC 1323, LBL, 1992.
12
LBL-36002