The CMEIAS shape classifier had an accuracy of 96.0% on a training set of. 1,471 cells and 97.0% on a .... using Adobe Photoshop (San Jose, CA). To facilitate ...
MICROBIAL ECOLOGY Microb Ecol (2001) 41:173–194 DOI: 10.1007/s002480000004 © 2001 Springer-Verlag New York Inc.
CMEIAS: A Computer-Aided System for the Image Analysis of Bacterial Morphotypes in Microbial Communities J. Liu,1,3 F.B. Dazzo,2,3 O. Glagoleva,2,3 B. Yu,1,3 A.K. Jain1,3 1
Department of Computer Science and Engineering, Michigan State University, East Lansing, MI 48824, USA Department of Microbiology, Michigan State University, East Lansing, MI 48824, USA 3 Center for Microbial Ecology, Michigan State University, East Lansing, MI 48824, USA 2
Received: 9 August 1999; Accepted: 10 December 1999; Online Publication: 28 February 2001
A
B S T R A C T
A major challenge in microbial ecology is to develop reliable and facile methods of computerassisted microscopy that can analyze digital images of complex microbial communities at single cell resolution, and compute useful quantitative characteristics of their organization and structure without cultivation. Here we describe a computer-aided interactive system to analyze the high degree of morphological diversity in growing microbial communities revealed by phase-contrast microscopy. The system, called “CMEIAS” (Center for Microbial Ecology Image Analysis System) consists of several custom plug-ins for UTHSCSA ImageTool, a free downloadable image analysis program operating on a personal computer in a Windows NT environment. CMEIAS uses various measurement features and two object classifiers to extract size and shape measurements of segmented, digital images of microorganisms and classify them into their appropriate morphotype. The first object classifier uses a single measurement feature to analyze relatively simple communities containing only a few morphotypes (e.g., regular rods, cocci, filaments). A second new hierarchical tree classifier uses an optimized subset of multiple measurement features to analyze significantly more complex communities containing greater morphological diversity than ever before possible. This CMEIAS shape classifier automatically categorizes each cell into one of 11 predominant bacterial morphotypes, including cocci, spirals, curved rods, U-shaped rods, regular straight rods, unbranched filaments, ellipsoids, clubs, rods with extended prostheca, rudimentary branched rods, and branched filaments. The training and testing images for development and evaluation of the CMEIAS classifier were obtained from 1,937 phase-contrast grayscale digital images of various diverse communities. The CMEIAS shape classifier had an accuracy of 96.0% on a training set of 1,471 cells and 97.0% on a test set of 4,270 cells representing all 11 bacterial morphotype classes, indicating that accurate classification of rich morphological diversity in microbial communities is
Correspondence to: F.B. Dazzo; Fax: (517) 353-8953; E-mail: dazzo@pilot. msu.edu CMEIAS is copyrighted by the Michigan State University Board of Trustees.
174
J. Liu et al.
now possible. An interactive edit feature was added to address the main sources of error in automatic shape classification, enabling the operator to inspect the assigned morphotype of each bacterium based on visual recognition of its distinctive pseudocolor, reassign it to another morphotype class if necessary, and add up to five other morphotypes to the classification scheme. The shape classifier reports on the number and types of different morphotypes present and the abundance among each of them, thus providing the data needed to compute the morphological diversity within the microbial community. An example of how CMEIAS can augment the analysis of microbial community structure is illustrated by studies of morphological diversity as an indicator of dynamic ecological succession following a nutrient shift-up perturbation in two continuously fed, anaerobic bioreactors with morphologically distinct start communities. Various steps to minimize the limitations of computer-assisted microscopy to classify bacterial morphotypes using CMEIAS are described. In summary, CMEIAS is an accurate, robust, flexible semiautomatic computing tool that can significantly enhance the ability to quantitate bacterial morphotype diversity and should serve as a useful adjunct to the analysis of microbial community structure. This first version of CMEIAS will be released as free, downloadable plug-ins so it can provide wide application in studies of microbial ecology.
Introduction Microscopy is one of the most important techniques in microbial ecology, since this is the most direct approach to examine the microbe’s world from its own perspective [5, 10]. The value of quantitative microscopy in studies of microbial ecology can be increased even further when used in conjunction with computer-assisted image analysis [6, 9, 48]. There are two main advantages of using digital image processing and pattern recognition techniques in conjunction with microscopy for quantitative studies of microbial ecology. First, automatic image analysis reduces the amount of tedious work with microscopes [39] needed to perform a more accurate quantitative analysis [24, 26, 27, 41] of in situ microbial abundance and metabolic activity [2, 3, 4, 7, 17, 23, 28, 33, 35, 37, 40, 43, 44]. Secondly, these techniques provide an important quantitative tool to analyze the structures and spatial features of complex microbial communities in situ without cultivation [1, 3, 8, 14, 16, 25, 27, 37, 42]. Five major types of information useful in microbial ecology can be extracted from resolved and segmented microscopical images of growing microbial communities in situ. These include recognition of cellular morphological diversity, cell abundance, and spatial, metabolic, and phylogenetic relationships of cells to each other and their surrounding environment. The process of semi-automatic image analysis of cells to evaluate these aspects of microbial communities can be principally divided into four stages: (i) interactive
image acquisition, digitization, and segmentation to locate cells; (ii) automatic measurement to extract features of interest; (iii) classification of different cell types; and (iv) statistical analysis, computations, and interpretation of the data. One of the most important and yet most tedious tasks performed during microscopical analysis of microbial communities is the classification of observed cells into known morphological categories and recognition of new categories as well if new distinct characteristics are captured. Use of morphological diversity in evaluations of microbial community structure is more valid if the cells are actively growing rather than in a nongrowing state of quiescence, since the latter is more commonly associated with pleomorphic dwarf cells [20]. This is because distinctive cell morphologies reflect the phenotypic expression of complex networks of genes involved in the synthesis and maturation of the shapedetermining murein sacculus plus other genes dedicated to the cell division cycle primarily during active growth. Assessment of morphological diversity is also useful in evaluations of microbial evolution, as illustrated by studies showing that cells of Escherichia coli changed their characteristic size and shape during 105 generations of evolution to a derived genotype that had an ∼50% increase in average fitness on glucose-limited growth [30, 31]. Although several image analysis systems can classify microbes according to their cell size, automatic classification of cells according to their distinctive shape (a dimensionless characteristic) represents a much more challenging task. The
Image Analysis of Bacterial Morphotypes
simplest scenario would be the analysis of a community of actively growing cells consisting of only regular rods and cocci since these shapes are easily distinguished by a single measurement feature that extracts their degree of roundness or circularity [12]. Most commercial image analysis systems include such measurement features. However, the difficulty increases with morphological diversity, since automatic classification of most other bacterial morphotypes requires multiple measurement features of shape and size to resolve the distribution of their morphological space [34]. Custom image analysis systems have been designed which are adequate for automatic shape classification of planktonic bacteria in natural oligotrophic communities with morphological diversities limited to three basic shapes: spheres, prolate spheroids, and regular straight rods [14], or spheres, straight rods, and vibroids [3]. There is obviously a need for development of image analysis systems capable of automatically classifying much broader morphological diversity of bacteria. Such diversity commonly exists in complex communities within nutrientenriched habitats where bacteria are actively growing, larger in size, and typically monomorphic. Therefore, our goal was to improve on existing image analysis systems for studies of microbial ecology by introducing new measurement features and robust object classifiers capable of automatically classifying most of the predominant bacterial morphotypes encountered in digital micrographs of complex communities growing in nutrient-enriched habitats, and to implement these features in a free, flexible, and robust semi-automatic image analysis system tailored to studies of microbial community ecology. Here we describe “CMEIAS” (Center for Microbial Ecology Image Analysis System), developed as several new plug-ins for UTHSCSA ImageTool, a free downloadable open-architecture software [47] operating on a personal computer in a Windows NT environment. Included are the mathematical descriptions of the principles governing the development of CMEIAS measurement features and object classifiers to recognize the morphotypes, an assessment of the accuracy of CMEIAS in classifying 11 of the most common bacterial morphotypes from a wide variety of complex microbial communities, and examples of CMEIAS applications to augment the analysis of microbial community structure, e.g., in the assessment of gross and subtle changes in morphological diversity as dynamic indicators of ecological succession following a nutrient shift-up perturbation in continuously fed, anaerobic bioreactors. Portions of this work were presented at the 8th International Symposium on Microbial Ecology [11, 18, 32].
175
Materials and Methods Sample Preparation Coated slides were prepared according to Pfennig and Wagener [36] except that washed and autoclaved agarose (1.6% w/v, 2 ml slide−1) was used instead of agar. Boehringer Mannheim Agarose LE was used for this study, based on a prior microscopical evaluation of several commercial agarose preparations for their optical clarity, degree of background granularity, and amount of insoluble refractile debris. Community samples were freshly collected from bovine rumen fluid, glucose-fed anaerobic bioreactors derived from domestic sewage sludge, gut luminal fluid of Reticulitermes flavipes termites, and biofilms from human dental and tongue surfaces. Other samples included bacteroids of Rhizobium leguminosarum bv. trifolii from within root nodules of field-grown red clover, a pure culture of Frankia sp strain IPN Ca15, a soil isolate whose 16S rRNA sequence is similar to Agromyces ramosus, and various other unidentified bacteria isolated from soil. Community samples were suspended in water or sterile culture medium, passed rapidly several times through a 25-gauge needle to assist in achieving a uniformity of single cell dispersion, and then diluted to slight turbidity (≡107 cells ml−1). A drop containing exactly 26 µl of the diluted cell suspension was placed on the dried agarose-coated slide. The sample was immediately covered with a glass cover slip (22 × 22 mm, No. 1.5 thickness) and stored in a humid chamber until examination. This procedure generally produced an ideal spatial density of ca. 30–120 separated cells per image field from the optimized volume that exactly covered the sample area under the coverslip, and within a few minutes would be absorbed by the rehydrating agarose gel without excess free fluid remaining.
Photomicrography Phase-contrast microscopy of refractile, immobilized cells was performed on a Zeiss Photomicroscope I equipped with a 12V 100W quartz-halogen lamp illuminator, green (546 nm) interferencecontrast filter to increase resolution by reducing chromatic aberration, and 100× PlanApochromat phase 3 oil immersion objective. Because image analysis requires a high quality primary image, strict adherence to the principles of Ko¨hler illumination with careful phase condenser alignment was essential. Photomicrographs of fields of view in which most of the bacteria were sufficiently separated from one another were recorded on TMax 100 ASA film (Kodak, Rochester, NY) using 1.25× optivar and 3.2× projectionto-film settings (400× final magnification of the photographic negative).
Digital Imaging Photomicrographs were converted to 8 bit, 256 grayscale digital images by direct scanning of 35 mm negatives using a Microtek 35t-Plus Scanmaker at 1,200 dpi, or 8⬙ × 10⬙ black-and-white positive prints enlarged to full-frame (∼2,900×) using a Hewlett Packard 4C flatbed scanner at 200 dpi, and stored in uncompressed TIF
176
J. Liu et al.
file format. These grayscale TIF images were interactively discriminated to eliminate background, edited to a level that closely defined each cell’s contour and that could be segmented by interactive thresholding, and stored in uncompressed 8 bit BMP file format using Adobe Photoshop (San Jose, CA). To facilitate evaluation of the rarer morphotypes, representative cells in grayscale images were selectively highlighted and moved to a new blank image with the same resolution to construct noise-free binary composites. A bar scale was constructed from a digital image of a slide micrometer taken at the same magnification and added to all images to convert pixel data to scaled numbers for spatial calibration.
Programming Algorithms to implement new measurement features and the object classifiers for CMEIAS were written in Borland C++ Ver. 5.01 (Scotts Valley, CA) operating in Windows NT 4.0. Measurement feature selection for development of the k-NN classifier was done by a Feature Selection Package running in UNIX [22].
Host Program for CMEIAS Plug-Ins CMEIAS was developed as custom plug-ins for use with UTHSCSA ImageTool Ver. 1.27 software [47] operating in the Windows NT 4.0 environment. This host program supports standard image processing and analysis functions with 22 common file formats including TIF, BMP, JPEG, PCX, GIF, TGA, and Photo-CD, supports Twain-compliant input devices, and is designed with an open architecture that provides extensibility via custom plug-ins prepared with the software development kit provided (with source code). This program is available free of charge and can be downloaded from the UTHSCSA ImageTool Web site (http://www.uthscsa.edu/ dig/itdesc.html). Since CMEIAS plug-ins conform to ImageTool’s specifications, they should function normally on other platforms (e.g., Windows95 but not Windows98) where ImageTool can run. An anonymous reviewer also indicated that UTHSCSA ImageTool runs well on Mac G3-400 under Virtual PC, but we have not tested the CMEIAS plug-ins in that alternative system.
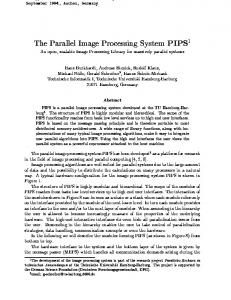
Results and Discussion Phase-Contrast Microscopy of Complex Microbial Communities Figure 1 shows a typical microscopical image of the suspended microbial community in the bovine rumen ecosystem. This micrograph, originally one of a series to illustrate the cover of the 9th edition of Bergey’s Manual of Determinative Bacteriology [21], also inspired this project by emphasizing three important points. First, microscopy does reveal significant morphological diversity in complex, actively growing microbial communities. Second, automatic morphotype classification of complex communities exhibiting high morphological diversity will require development of a
Fig. 1. A typical example of the diverse morphology of bacteria in the rumen microbial community revealed directly by phasecontrast microscopy. Reproduced with permission of Lippincott, Williams and Wilkins [21].
more flexible and robust computer-assisted image analysis system than those currently available. Third, phase-contrast microscopy of dispersed samples immobilized on agarosecoated slides is a simple yet effective method to produce differences in image intensity at high magnification that are sufficient to reveal the rich morphological diversity of bacterial communities. Its essential requirements to detect microbes are that their size exceeds the 0.2 µm limit of resolution for light microscopy and their refractive index differs from that of the surrounding medium. These features are optimized using a planaprochromat 100× phase-contrast oil immersion lens and a narrow band-pass green interference contrast filter in the light path. This method involves minimal preparation of a wet specimen without introducing drying artifacts inherent in scanning electron and transmission electron microscopy, produces significantly higher contrast images than does environmental scanning electron microscopy, and avoids the underestimation and overestimation of their size inherent in conventional stained/brightfield and epifluorescence microscopies, respectively. Although laser scanning confocal microscopy minimizes these same problems [10, 29], for many investigators it is less routinely available and more costly to acquire a sufficient data set of multiple images per community sample for quantitative community analysis. Despite the above advantages of phase-contrast microscopy for morphotype analysis, Figure 1 also illustrates the difficulty of automatically locating and extracting all relevant individual objects from digital images of complex microbial communities. This difficulty arises from complex back-
Image Analysis of Bacterial Morphotypes
ground and irrelevant objects, low image contrast of some cells despite proper microscopy to produce a high quality primary image, and object edge overlap. There are several causes of these problems. First, community samples will contain varying amounts of refractile debris, and this will be excessive for some communities, e.g., in soil. Second, some communities will contain microbes whose refractive indices approximate the surrounding aqueous agarose layer and/or a range of cell sizes that exceeds the narrow focal distance of high magnification objective lenses required to extract relevant morphological features. As a result, the brightness values in the objects often cover a range that includes some of the background, and therefore some of the microbial cells will lack contrast in the digital image. Third, some bacteria, e.g., streptococci, have a natural tendency to aggregate by adhesive forces that are not adequately broken by repeated passage through the 25-gauge needle. More rigorous treatments, such as sonication for complete dispersion of cells, are not recommended because they may destroy the in situ cell morphology. Therefore, a wide range of techniques, including low-level and high-level image-processing, selection and extraction of morphological and nonmorphological measurement features, hierarchical classifier design, and human–machine interaction, are needed to implement an interactive, semi-automatic mode to obtain useful ecological information from these images of complex microbial communities. To acquire images for this project, phase-contrast microscopy was performed on a variety of growing microbial communities and various soil bacteria grown in pure culture. A total of 1,985 digital images were prepared, 1,937 of which were edited primary grayscale images and 48 were newly created, composite images. The training set for development of the CMEIAS Morphotype Classifier used 19 edited images derived from the primary grayscale images, three overlay images hand-traced from grayscale images, and nine composite images. All the remaining images were used to produce the testing set to evaluate the accuracy of the CMEIAS Morphotype Classifier and to illustrate some CMEIAS applications in microbial community analysis.
Selection of Major Bacterial Morphotypes Microbiologists have described more than 40 shapes of bacteria that represent only a very small fraction of the microbial world [21]. Our initial task was to select the bacterial morphotypes for CMEIAS development, based on the criteria that they would be distinguishable by phase-contrast mi-
177
croscopy and represent a sufficient level of complexity to be useful in approximating the morphological diversity of most actively growing microbial communities. The set of morphotypes that fulfills these criteria and can be classified by the current version of CMEIAS includes cocci, spirals, curved rods, U-shaped rods, regular straight rods, unbranched filaments, ellipsoids, clubs, rods with extended prostheca, rudimentary branched rods, and branched filaments. Collectively, these morphotypes represent the shapes for 98.9% of the 528 genera of bacteria described in the 9th edition of Bergey’s Manual of Determinative Bacteriology [21]. Figure 2 outlines a hierarchy of descriptive shape characteristics for these 11 morphotypes, plus their letter assignments for CMEIAS data reports and examples of each. An important quantitative shape characteristic developed for this classification scheme was the assignment of a 16:1 length/width (=0.0625 width/length) border to distinguish long rods from filaments. This shape border was based on image analysis of 80 examples of these two morphotypes grouped visually by an experienced microbiologist. Frequency distribution analyses indicated that this length/width ratio was the best discriminating border between these normally distributed overlapping populations, with 100% of the rods falling below it and 85% of the filaments falling above it (data not shown). An earlier version of the shape classifier recognized 14 bacterial morphotypes, but this was reduced to the current set of 11 morphotypes to avoid overclassification of cocci and regular rods. Originally, the CMEIAS Morphotype classifier recognized ovoids, coccobacilli, and spheroid cocci as three distinct bacterial morphotypes. However, because siblings of some bacteria will exhibit each of these cell shapes (Fig. 3A), the CMEIAS© Morphotype classifier was redesigned to consolidate them into the same morphotype class A. Also, regular rods were originally distinguished as two distinct morphotypes, based on whether they had rounded or tapered ends. However, because some rods have both pole shapes (Fig. 3B) and image documentation of this small morphological feature requires very high resolution, this distinction was dropped. All regular rods are now grouped into the same morphotype class E in the CMEIAS Morphotype classifier, regardless of their pole shapes.
Measurement Features The original Object Analysis plug-in in Ver. 1.27 of UTHSCSA ImageTool can compute 19 different attributes of an object in a digital image [47]. This extracts features of object
178
Fig. 2.
J. Liu et al.
Hierarchy outline of characteristics that define the 11 bacterial morphotypes recognized by the CMEIAS Morphotype Classifier.
size (area, perimeter, Feret diameter, major and minor axis lengths), shape (roundness, elongation, compactness), orientation (major and minor axis angle), grayscale density (gray centroid, integrated density, min/mean/median/mode/ max gray level densities and their standard deviation), and spatial position (centroid [x, y] coordinates). New measurement features of CMEIAS added to this Object Analysis plug-in include maximum curvature, length, width, width/ length, length/width, area/bounding box area, eight Fourier descriptors, and aspect ratio. The lmageTool/CMEIAS interface to activate these attributes is designed with simplicity in mind so that selection of the seven shape measurement features required to operate the CMEIAS Morphotype Classifier is separated from other measurement features available (Fig. 4). The primary and derived measurement features that are important in the image analysis of bacterial morphotypes are briefly described as follows: Area: Area of the object, measured as the number of pixels in the polygonal approximation of the cell. This measurement of size tends to slightly overestimate the object’s true area because the borders of the pixels may extend beyond the true perimeter of the cell. Perimeter: Length of the outside contour of the object represented as a polygon.
Fig. 3. Consolidated morphotypes. (A) A chain of streptococci including coccoid, ovoid, and coccobacilli morphotypes. (B) A rod with a rounded end at one pole and a tapered end at the opposite pole. Bar scale equals 1 µm.
Image Analysis of Bacterial Morphotypes
179
Fig. 4. The CMEIAS/ImageTool interface to activate measurement features. Shown are the selection of the seven shape measurement features needed to operate the CMEIAS morphotype classifier, the 20 other measurement features available, and the user-defined level of measurement precision for reporting the object analysis data.
Roundness: Computed as (4 Area/Perimeter2). This shape feature measures the degree of roundness of the object, with values lying between 0 and 1. The greater the value, the rounder the object. Major Axis Length: Length of the longest line that can be drawn through the object, corresponding to the vector CD in Figure 5a. Minor Axis Length: The length of the longest line that can be drawn through the object perpendicular to the major axis. This size measurement is the vector EF in Figure 5a. Elongation: The ratio of the length of the major axis to the length of the minor axis, i.e., CD/EF in Figure 5a. The result is a value ⱖ1. If the elongation is 1, the object is roughly circular or square. The ratio increases from 1 as the object becomes more elongated. Feret Diameter: Diameter of a circle having the same area as the object. This size measurement is computed as 共公4Area Ⲑ 兲.
Compactness: Computed as 共公4Area Ⲑ Ⲑ Major axis length兲.
Fig. 5. Measurements of cell size and shape. (a) Curved rod. (b) Regular rod. Labeled coordinates are described in the text.
180
J. Liu et al.
This shape feature measures the object’s circularity, representing the ratio of the Feret diameter to the object’s major axis length, and ranges between 0 and 1. When compactness has a value of 1, the object is roughly circular. Maximum Curvature: The curvature at a point on the boundary of an object is defined as the inverse of the angle at that point; hence, the maximum curvature has the minimum angle on the object boundary. The angle itself is defined as the angle between two equidistant strings (each set at a length of eight pixels) emanating from the point. In Figure 5a, the angle at point D is ∠GDH, where GD = HD. To compute the local angle, the polygonal representation of the boundary is resampled at a constant interval along the object boundary. Length, Width, Width/Length Ratio, Length/Width Ratio: The length of the object should be theoretically computed along its principal skeleton, which is the locus of centers of maximal disks contained in the object. However, in terms of accuracy and computational cost, it is not easy to extract a useful skeleton since it is very sensitive to boundary noise. The closest approximation to cell length provided automatically by UTHSCSA ImageTool and various commercial image analysis systems is the major axis length (also commonly referred to as the “longest dimension”). Because this can significantly underestimate the length of curved cells (Figure 5a), we developed an alternative “adaptive” approach to automatically measure cell length in CMEIAS, by first classifying the objects according to their roundness value, and then applying the appropriate formulas that compute cell lengths and widths for each roundness class. In the first step, objects are automatically classified into one of two types: (i) elongated if Roundness ⱕ 0.8, and (ii) rounded if Roundness > 0.8. Referring to Figure 5b, a two-dimensional presentation of a straight rod with rounded ends can be represented by a rectangle attached to a half-circle at each of its two poles, and its length can be approximated as (a + b). On the other hand, we use the Major Axis Length feature to define the length of a more rounded object. The general CMEIAS formula for the object length is as follows:
Length =
冦
2Perimeter + 共 − 2兲公Perimeter − 4Area , 2 if Roundness ⱕ0.8; otherwise,
Width =
冦
2Perimeter − 公Perimeter2 − 4Area , if Roundness ⱕ0.8; otherwise, Area . Major Axis Length
The ratios (Width/Length and Length/Width) between the measurements Width and Length calculated using the above formulas are dimensionless normalized measures of cell shape. Area/Bounding Box Area: The ratio between the object’s area and the area of the smallest rectangular box containing the object. The four boundaries of the rectangle are parallel to the major axis and minor axis, respectively. This measurement of shape is approximately computed as (Area/ (Major Axis Length × Minor Axis Length)). Fourier Descriptors: Fourier descriptors are measurement features derived from the object contour and can be used to represent open or closed curves at different spatial scales [38, 49]. In addition, shape features can be extracted from Fourier descriptors which are invariant to translation, scaling, and rotation. To compute the Fourier descriptors, the object boundary, represented as a polygon, is resampled by a sequence of equidistant points (xk,yk), k = 0, K, N − 1, where the distance between the neighboring points is a constant. Let zk = xk + jyk, k = 0, K, N − 1 be a sequence in the complex space. Then zk can be represented by its discrete Fourier transform coefficients N−1
zk =
兺
ane
−
jnk2 N
, k = 0, K, N − 1,
n=0
where N−1
an =
jnk2 1 zke N , n = 0, K, N − 1 N k=0
兺
are the discrete Fourier transform coefficients and a0 is the mean of zk, k = 0, . . . , N− 1. Let z⬘k = Szk+t e j + T,
k = 0,K,N − 1
2
Major Axis Length.
The width of an object is defined as its average width along the skeleton and is approximately computed for these two types of objects as follows:
be a distortion of zk, where S is the scaling coefficient, T the translation vector in the complex space, the rotation angle, and t the deviation of the starting point. The corresponding Fourier coefficients are: a⬘0 = a0 + T, jtn2
a⬘n = anSe
N
e j, n = 1, K, N − 1.
(1)
Image Analysis of Bacterial Morphotypes
Fig. 6. Fourier representations of the contour of a spiral cell. (a–o) Reconstructed boundaries from a subset of Fourier coefficients were created by symmetrically adding two coefficients at each step starting from a0 until aN-1. (p) Original contour of the spiral cell.
If t is not an integer number, Eq. 1 is an approximate equality and the degree of approximation is dependent on the difference between t and its nearest integer number. It can be proved using the property of Eq. 1 that features fn = |an|/|a1|, n = 2, K, N − 1 are invariant with respect to translation, scaling and rotation. Since low-order Fourier coefficients occupy most of the energy of the signal, we use f2, f3, f4, f5, fN-1, fN-2, fN-3, and fN-4 as Fourier descriptor (FD) features in CMEIAS, which are represented as FD0–FD7 in the Object Analysis report window. Figure 6 depicts different reconstructions of the object boundary from a spiral-shaped bacterium using a subset of the Fourier coefficients. Centroid (x, y): The center point ([x, y] intercept labeled O in Figure 5a) is computed as the average of the x and y coordinates of all the pixels belonging to the object. Aspect Ratio: This shape measurement is the ratio between the minimum and the maximum distance from the points on the object boundary to its centroid (OB/OA in Figure 5a).
Object Analysis Object analysis in ImageTool/CMEIAS first involves the spatial calibration of the image, followed by segmentation step(s) to reduce the image to objects of interest, and finally computation of the selected measurement features for each object. Cells in the grayscale image can be segmented directly by interactive thresholding immediately before analysis if they are separated against a smooth background that lacks
181
extraneous objects whose brightness values fall within the range for the cells (Figure 7). Each cell in the corresponding binarized image is displayed with a colored contour and an assigned number ordered from the bottom up, and the analysis results of selected measurement features for each numbered cell are tabulated in a results window that can be either saved as a text file or exported directly into compatible spreadsheet or statistical analysis programs (Figure 7). Few grayscale images of microbial communities can be satisfactorily segmented by direct interactive thresholding using simply their original brightness values. Therefore, most images require some form of editing before binarization. In ImageTool, much of the background noise can be excluded from object analysis by adjusting contrast and brightness, by setting a minimum object size (30 pixels recommended for accurate morphotype classification), and by interactively excluding invalid objects from the polygon drawn on the image to define the area of interest prior to thresholding. The background subtraction functions supported by ImageTool were not very useful for this study because the background agarose surface itself did not contribute identically to the brightness variation of every image, and therefore its automatic subtraction often deleted too much of the dynamic range in brightness of the objects of interest. Further pre-processing of the image is required to separate touching bacterial objects. A downloadable external plug-in module called SegmentTool is available from the Internet (http://www.saske.sk/∼tomori) to perform interactive freehand drawing, edge tracking, and region growing procedures to assist in segmenting (primarily biomedical) objects directly in ImageTool [45]. In this study, Adobe Photoshop® image processing software was used to edit the original grayscale images so that interactive thresholding in ImageTool was all that was necessary to fully segment the bacterial objects and represent their original size, shape, and contour in the binary image. An efficient sequence of image editing steps in Photoshop requiring ca. 6.5 min per community grayscale image for an experienced user consisted of the following: (1) adjust image levels; (2) pencil segment touching objects; (3) wand select and grow objects of low contrast; (4) paintbucket selected objects to black; (5) paintbucket most of background to white; (6) adjust threshold; (7) filter dust and scratches; and (8) separate retouching objects with the pencil tool at one pixel width. Strategy for Object Classifiers Phase-contrast microscopy reveals three characteristics of bacteria relevant to classification of their morphology: their
182
J. Liu et al.
Fig. 7. A system workspace showing the grayscale and binary images of a bacterial culture and the results window of the resulting object analysis data. The bar scale on both images equals 5 µm. Each cell is automatically numbered from the bottom up, and the corresponding values of maximum curvature, length, and width are reported for the first 20 cells.
shape, size, and gray density relative to the surrounding environment. Typically, one first classifies cells according to their shape, and then cells with the same shape are further classified by their size and gray density. This classification analysis ultimately yields two ecologically important sets of data, namely the richness in number and types of different operational morphological units (OMUs) present and the equitability of abundance among them. From these data one can compute various morphological indices useful in describing community structure, e.g., morphological diversity index, evenness, or community similarity. Two types of object classifiers are currently operative in CMEIAS/ImageTool. One classifier operates with a single user-selected measurement feature (e.g., area) and is adequate for size classifications of all bacteria in the image, regardless of shape. This object classifier also suffices for shape classification of bacteria in certain growing communities having limited morphological diversity. The usefulness of this simple shape classifier is illustrated in Figure 8. In this
example, a binary image of an anaerobic bioreactor community containing cocci, regular rods, and unbranched filaments is shown, along with the interface to select the single shape measurement feature (width/length), the operatorassigned three bin widths for classification (0–0.0625 for filaments, >0.0625–0.5 for regular rods, and >0.5 for cocci), and the results window reporting the bin range value, the cell frequency count within each bin, and the mean and standard deviation of width/length values for the three populations of different-shaped cells within each bin. Next, we developed the more comprehensive CMEIAS Morphotype Classifier which makes use of multiple measurement features in order to accurately discriminate the 11 major morphotypes of bacteria found in a wide variety of more complex, growing microbial communities. Because shape is a dimensionless characteristic, this shape classification requires measurement features that are invariant to size, location and rotation. Fifteen of the 36 measurement features computed by CMEIAS/ImageTool fit these criteria and
Image Analysis of Bacterial Morphotypes
183
Fig. 8. Object classification using a single measurement feature. Shown (clockwise) are a binary image of a simple community; the interface to select the single measurement feature for classification and to define its bin widths; and the classification results window reporting the range value of bins, object count per bin, and mean and standard deviation of the selected measurement feature for all cells within each bin. In this example, accurate morphotype classification of cocci, regular rods, and unbranched filaments is achieved using only the shape measurement feature of Width/Length Ratio (arrow) with threshold borders of bin width set at 0.0625 and 0.5.
were selected as candidate features for shape classification. These are labeled as F1–F15 in Table 1. Two sets of images were collected for development of the classifier: a training set consisting of 1,230 binarized cells extracted from primary grayscale images and manual tracings, and a testing set consisting of 4,270 binarized cells from primary grayscale images and binary composite images. The CMEIAS Morphotype Classifier is designed to operate as a hierarchical classifier, which is generally called a tree classifier in pattern recognition literature because it looks like an inverse-positioned tree. Based on the characteristics of the 11 morphotypes in the training set, we developed a tree classifier that utilizes both structural analysis and statistical classification. The design of the structural part of this
classifier was done first by taking advantage of the fact that some of the shape categories have structural attributes that can be easily and reliably extracted and are sufficiently distinct for direct classification. Because these structural attributes are easy to compute and the rules are simple, the computational complexity of the classifier is reduced. These morphotypes are classified first by criteria using simple rules detailed below. Those object shapes that cannot be classified using structural information alone are sent to a k-Nearest Neighbor (k-NN) statistical classifier [13]. A block diagram of the CMEIAS Morphotype Classifier is shown in Figure 9, in which a light-frame box designates structural judgments and a bold-frame box designates use of a k-NN classifier. In designing this tree classifier, two of the morphotype catego-
184
J. Liu et al.
Table 1. Candidate shape measurement features to develop the CMEIAS© morphotype classifier Feature label
Feature name
F1 F2 F3 F4 F5 F6 F7 F8 F9 F10 F11 F12 F13 F14 F15
Elongation Roundness Compactness Maximum Curvature Aspect Ratio Width-to-Length Ratio (W/L) Area/Bounding-Box Area (A/BBA) FD0 FD1 FD2 FD3 Fourier FD4 Descriptors FD5 FD6 FD7
ries were split further into subcategories according to the pattern recognition techniques used. Category A (coccus) was split into three subcategories: A1 (spherical), A2 (ovoid), and A3 (coccobacillus). Category I was split into two subcategories: I1 (long prostheca) and I2 (short prostheca). CMEIAS later relabels those objects in subcategories and then counts them together at the end of the classification. Rule (r1) for Category A1. Among all the shape categories, only subcategory A1 is of spherical shape. Figure 10 depicts a two-dimensional plot of the Roundness (F2) and Com-
Fig. 10. A linear decision boundary to discriminate patterns of class A1 from the remaining classes (A2–K). Labels of morphotype classes A–K are defined in the hierarchy outline of Figure 2.
pactness (F3) values for ca. 600 cells representing all the morphotype classes from the training set. These results clearly indicate that a linear decision boundary [13] can be drawn to separate all spherical cells comprising the A1 subcategory morphotype (in the upper-right corner) from cells of all other morphotypes. This is also the reason why subcategory A1 is separated from the other two cell shapes (ovoid and coccobacilli) of category A. An input test object x is then classified as follows:
r 1:
再
if 24F2共x兲 + 25F3共x兲 − 43 ⱖ 0, x ∈ A1, if 24F2共x兲 + 25F3共x兲 − 43 ⬍ 0, x ∈ 共⍀ − A1兲,
where F2(x) and F3(x) are measurement features F2 and F3 for the input object x, respectively, A1 denotes the A1 subcategory, and ⍀ is the union of all the classes under consideration. We define ⍀1 = ⍀ − A1, i.e., ⍀1 is the union of all the classes except class A1.
Fig. 9. Block diagram of the CMEIAS tree classifier used to classify 11 major morphotypes of bacteria from a variety of growing communities. Labels of morphotype classes A–K are defined in the hierarchy outline of Figure 2. Other abbreviations: W/L, ratio of cell width to length; A/BBA, ratio of area of object to area of bounding box; F-numbers refer to candidate shape measurement features as defined in Table 1.
Rule (r2) for Elongated Morphotypes. After using Roundness (F2) and Compactness (F3) to identify class A1, we note that morphotypes B, F, and K have a distinct elongated characteristic that can be used to distinguish them from the other morphotypes. Our preliminary experiments demonstrated that the Length/Width Ratio (1/F6) is a very reliable index to separate the elongated cells from the other cell shapes. An
Image Analysis of Bacterial Morphotypes
Fig. 11. cells.
185
Poles (circle) and branch points (square) in elongated
input test object x is classified into classes elongated and (⍀1 − elongated) using the following rule:
r 2:
冦
if
1 − 16 ⱖ 0, F6共x兲
x ∈ elongated,
if
1 − 16 ⬍ 0, F共x兲
x ∈ 共⍀1 − elongated兲,
where F6(x) is feature F6 of x, elongated denotes the set of the elongated morphotypes, and ⍀1 is the union of all the morphotypes except class A1. Note that some cells belonging to category I have such a long prostheca that they will be classified as elongated. That is why category I is split into subcategories I1 (long prosthecate) and I2 (short prosthecate). So, elongated includes four categories, i. e., B, F, I1 and K. I2 is classified by the k-NN classifier described later. Rule (r3) for Categories I1 and K. In order to classify cells in the four categories of elongated, CMEIAS first counts their poles and branch points as illustrated in Figure 11. These structural features of the cell are detected by the criteria of local minimal and maximal angles along the cell’s contour. The local angle at a contour point is similar to the angle used in computing the Maximum Curvature measurement feature, but differs in that it is computed with strings whose lengths are adaptive to the Width of the object (2 × Width). This leads to the following rule to classify an elongated object x:
r 3:
冦
if K共x兲 ⬎ 0 or P共x兲 ⬎ 2,
x ∈ K;
if K共x兲 = 0 and P共x兲 = 2,
x ∈ B or F;
if K共x兲 = 0 and P共x兲 ⬍ 2, x ∈ I1,
Fig. 12. Plots of local angle: (a) for the spiral cell in Figure 11 and (b) for the unbranched filament in Figure 11.
where P(x) and K(x) are the numbers of poles and branch points in the input object x. Rule (r4) for Spiral and Unbranched Filament Morphotypes. The main characteristic that distinguishes these morphotypes is whether it has a repeated waveform. CMEIAS discriminates these morphotypes by analyzing the local angles along both sides of a cell’s contour between its two poles. Figures 12a and 12b show the plots of the local angles along one side of the spiral and unbranched filamentous cell illustrated in Figure 11, respectively. These plots show that the local angles along the side of the spiral cell fluctuate around 180° with considerably larger deviation than the local angles for the unbranched filamentous cell. Let AR (“average for ridge”) denote the mean value for all local angles less than 180° and Av (“average for valley”) denote the mean value for all local angles greater than 180°. CMEIAS locates points A and B by finding the first boundary point with a local angle ⱖ180° as it scans inward from the poles (Figure 12). AR and AV are then computed in interval AB to exclude the small local angles near the poles. Based on the measured values of AR and AV from the training set, the following rule distinguishes morphotypes B and F:
r4:
冦
if 兵共AR共x兲 + 12⬚兲 ⬍ 180⬚其 and 兵共AV共x兲 − 120⬚兲其 ⬎ 180⬚, x ∈ B; otherwise, x ∈ F,
where AR(x) and Av(x) are the values of AR and AV for the input object x, respectively.
186
Use of the k-Nearest-Neighbor (k-NN) Classifier. Design of the next stage of the CMEIAS classifier (to discriminate morphotypes A2, A3, C, D, E, G, H, I2, J) was more challenging, because some microbiological characteristics typically used to distinguish them visually (see Figure 2) cannot be reliably and automatically extracted by a computer in most situations. For example, it is very difficult to measure the shape characteristic that distinguishes the ellipsoid and club shapes, which is the position of the largest width along the cell’s longitudinal axis. We assumed that these characteristics are reflected by a combination of multiple shape measurement features listed in Table 1, and therefore decided to use a k-NN classifier which performs classification in a highdimensional feature space (each dimension per measurement feature). A k-NN classifier makes the classification decision based on the k-nearest-neighbor rule, which classifies an object by assigning it the label most frequently represented among the k nearest samples in the training set. Because classes A2 and A3 are of different shapes (ovoid and coccobacilli, respectively), cells of these two classes form two distinct clusters in the feature space. By splitting them, the k-NN classifier will have a more accurate classification boundary for category A. Two decisions needed to be made in order to implement the k-NN classifier. One was the value of k and the other was identification of a specific subset of measurement features from the list in Table 1. Since some of these measurement features are not statistically independent, a feature selection stage was implemented to reduce the dimensionality of the feature vector, i.e., retain only those measurement features that are important in discriminating among the various bacterial morphotypes. For several reasons, it is important to retain only a small number of useful and highly discriminative features in designing a classifier. First is the phenomenon of the Curse of Dimensionality, which applies when the training set is relatively small, compared to the number of features. In this case, a classifier’s performance improves initially to a peak and then deteriorates as additional measurement features are added. Hence the ratio of the size of the training set per morphotype class to the dimensionality of the feature vector should be kept large (∼10). This effect of dimensionality on the classification performance is due to the statistical interdependence of certain measurement features. Second is the Computational Cost. Use of unnecessary measurement features leads to redundant or irrelevant information to the classification task, resulting in unnecessary measurement cost and hence computing time. By performing a feature selection, we can identify the most effective
J. Liu et al. Table 2. Feature selection results using the k-NN classifier k 1 3 5
Best subset of shape measurement features
Classification accuracy (%)
F1, F2, F3, F4, F7, F8, F9, F10, F11, F12, F13, F15 F1, F2, F3, F4, F6, F7, F9, F10, F11, F12, F13, F15 F1, F3, F6, F7, F10, F11, F12, F13
94.5 94.9 94.8
measurement features in designing the classifier, thereby reducing the computational and measurement costs during its operation. The Floating Search method [22] was used in conjunction with the k-NN classification to perform the feature selection on the set of 15 candidate measurement features. In this feature selection algorithm, correct classification rates are estimated using the leave-one-out approach wherein each sample is in-turn selected as the test object while all other objects form the training set. We use the Euclidean distance in computing nearest neighbors. To treat the features used in the k-NN classifier equally, they were normalized as xi⬘ =
xi − xi , si
where xi is the ith feature and xi and si are its estimated mean value and standard deviation, respectively, based on all the samples in the training set. Table 2 shows the results of this feature selection using three different values of k on 1,155 objects belonging to classes A2, A3, C, D, E, G, H, I2, J in the training set. The table shows the best subset of measurement features for each specified value of k in the k-NN decision rule and their corresponding classification accuracy. The maximum classification accuracy of 94.9% is obtained using only 12 of the 15 measurement features in the candidate feature set. As is normally the case, a further increase in the number of measurement features in the classifier lowered the classification accuracy (lowered to 93.3% using all 15 features). Thus, feature selection has desirably decreased the computation cost by eliminating three measurement features that actually diminish rather than improve the classification results. Therefore, the k-NN classifier in the CMEIAS classification tree uses a value of 3 for k and a subset of measurement features containing: elongation (F1), roundness (F2), compactness (F3), maximum curvature (F4), width/length ratio (F6), area/bounding box area ratio (F7), and six Fourier descriptors (F9, F10, F11, F12, F13 and F15) (also see Figure 4).
Image Analysis of Bacterial Morphotypes
187
Table 3. The number of cells of each morphotype category in the training set Label
Morphotype description
# of samples
A1 A2 A3 B C D E F G H I1 I2 J K Total
Coccus (sphere) Coccus (ovoid) Coccus (coccobacillus) Spiral Curved rod U-shaped rod Regular rod Unbranched filament Ellipsoid Club Prosthecate (long prostheca) Prosthecate (short prostheca) Rudimentary branched rod Branched filament
81 76 192 22 120 68 253 109 72 198 75 22 154 29 1471
Fig. 13. Binarized images used for testing the CMEIAS morphotype classifier. (a) Derived by direct editing of a grayscale community image. The bar scale is 10 µm. (b) A composite image made by moving binarized cells into a new blank image.
Table 3 summarizes the number of cells for each morphotype in the training set used in the design of the CMEIAS Morphotype classifier. Most of these cells are noise-free hand-traced samples, and others are binarized objects from primary digital micrographs. Because the rules for structural judgments are designed using training data, we expected that their classification accuracy would be very high. In fact, the classification rate for all objects representing morphotype classes A1, B, F, and I1 (316 cells) was 100%. The remaining 1,155 cells representing the other morphotypes were classified with 94.9% accuracy using the k-NN classifier, resulting in an overall classification accuracy of 96.0% for the entire training set.
The confusion matrix in Table 4 summarizes the test results of the CMEIAS© Morphotype Classifier on a ground truth (true labels) test set of 4,270 valid cells assigned by an experienced microbiologist. Shown in this matrix are rows corresponding to the true class labels, columns identifying the classifier-assigned labels, and numbers of correctly and incorrectly classified cells in each morphotype class. The values in bold type along the descending diagonal in Table 4 indicate the number of correctly classified cells for each class. Added to the right of this matrix are two other columns showing the total number of cells tested for each morphotype class and their individual, correct classification rates. The overall accuracy rate of the CMEIAS Morphotype Classifier on these test images was 97.0% without rejection. The performances on the training and test sets are comparable, indicating that the classifier has good generalization ability.
Classification Results on the Test Set
Sources of Error in Morphotype Classification
Evaluation of the overall accuracy of the CMEIAS Morphotype Classifier was based on a test set containing cells not seen by the classifier during the training phase. These cells were present in 115 binarized images, 96 of which were derived by direct interactive editing of all valid objects in digital grayscale community micrographs, and 19 were composite images created by consolidation of selected bacterial objects from 1,889 digital grayscale micrographs (examples illustrated in Figure 13). This large number of microbial community images was needed in order to test the CMEIAS Morphotype Classifier with enough good examples of each rare morphotype.
The most common error encountered in testing the CMEIAS Morphotype classifier was the misclassification of some cells whose dimensionality of morphological space overlaps the assigned border between closely related bacterial morphotypes. Figures 14a and 14b illustrate this type of error, showing examples of misclassified cells whose shapes lie within the real-world continuum between rod/coccus and rudimentary branched rod/club, respectively. Other causes of classification error include excessive noise at the boundary of the thresholded binary object, incomplete or inaccurate editing, and compromised thresholding. Increasing image resolution and contrast as well as careful image editing (in-
Classification Results on the Training Set
188
J. Liu et al.
Table 4. Accuracy of test results of the CMEIAS© Morphotype Classifier for 11 morphotypes of bacteria
A B C D E F G H I J K
Morphotype
A
B
C
D
E
F
G
H
I
J
K
Total
Accuracy (%)
Coccus Spiral Curved rod U-shaped rod Regular rod Unbranched filament Ellipsoid Club Prostecate Rudimentary branched rod Branched filament
1212 0 0 0 24 0 3 0 0 0 0
0 399 0 0 0 1 0 0 0 0 0
0 1 156 1 13 0 0 0 0 1 0
0 0 6 132 0 0 0 0 0 0 0
4 0 2 0 1100 1 4 3 0 0 0
0 6 0 11 4 240 0 0 0 0 0
1 0 0 0 1 0 130 4 0 0 0
0 0 0 0 15 0 0 298 0 11 0
0 1 0 1 1 1 0 0 206 0 0
0 0 0 3 0 0 0 4 0 138 0
0 1 0 0 0 0 0 0 0 0 130
1217 408 164 148 1158 243 137 309 206 150 130
99.6 97.8 95.1 89.2 95.0 98.8 94.9 96.4 100 92.0 100
cluding “smoothing” steps in image processing) before interactive thresholding can minimize most of these types of errors. The problem of compromised thresholding occurs when images of complex communities containing a wide range of cell sizes are acquired using objective lenses with high numerical aperture. In this case, some very thin cells (e.g., certain spirochetes and unbranched filaments) may lie outside the optimized plane of focus for larger cells within the community, resulting in their having lower contrast (i.e., a brightness range that includes some background). When the image is then thresholded to segment the majority of cells, the thin cells will become fragmented into multiple objects. Currently, the realistic solution to this type of oversegmentation problem is to regain higher contrast of the original cell object by interactive image editing.
Interactive Features of the CMEIAS Morphotype Classifier To operate the CMEIAS Morphotype classifier, one first selects the proper set of seven shape measurement features
Fig. 14. Examples of misclassified cells. (A) Regular rods classified as cocci. (B) Rudimentary branched rods classified as clubs.
(Figure 4), then performs an object analysis on a thresholded, segmented image (Figure 7), and finally performs an object classification on the same image (Figure 15). Using a PC with 384 MB RAM and Pentium II processor operating at 300 MHz, the algorithms for object analysis and object classification presented their results for most of the community images used in CMEIAS development in an average of 2.0 s and 0.2 s per image, respectively, well below the approximate 10 s “limit of user irritation.” Most of this time is actually used to produce the graphical display rather than computation per se. This classification procedure produces two result windows, one as a reconstructed “classification result image” in which the classified morphotype of each object is readily recognized by its assigned pseudocolor against a black background, and the other as a “classification data window” in which the number of objects for each morphotype in the image is reported using text with the same pseudocolor (Figure 15). To make the CMEIAS Morphotype Classifier more flexible and reduce the error of the final data output, a plug-in module was implemented to permit interactive editing of the classifier results (Figure 15). This CMEIAS edit module accommodates three types of classification errors that occur during the semi-automatic morphological analysis of microbial communities by enabling the operator to easily inspect the assigned class label of each cell via visual recognition of its distinctive pseudocolor in the classification result image and reassign it to another morphotype if necessary. A significant effort was made in development of this CMEIAS edit plug-in module to select a sufficiently large set of pseudocolors that are easily distinguishable in the same image, so that visual assessment of the accuracy of the morphotype classification results becomes almost instantaneous with user
Image Analysis of Bacterial Morphotypes
189
Fig. 15. Interactive interface of the CMEIAS morphotype classifier. Shown (clockwise) are a portion of the analyzed binary composite image overlaid with the corresponding classification result images in which the classified morphotype of each cell is noted by its unique pseudocolor assignment (red coccus, orange spiral, purple curved rod, pink U-shaped rod, true blue regular rod, aqua blue unbranched filament, true green ellipsoid, olive green club, yellow prosthecate, light gray rudimentary branched rod, white branched filament, sky blue other-1, brown other-2, dark gray other-3, maroon other-4, and teal other-5); the results window of classification data for each morphotype using the corresponding pseudocolored text; and the interactive edit interface of 16 morphotype selections, an invalid object selection, and the wand cursor to reassign category labels of misclassified cell objects in the results image.
experience. The most common error encountered in testing the CMEIAS Morphotype classifier (occurring at a frequency of ≡3%, n = 4,270) is that the object is better represented by one of the 10 other morphotypes already defined in the CMEIAS classifier (for reasons described above). A second, less frequent error is that the cell’s shape does not match any of the 11 predefined morphotype classes in the CMEIAS Morphotype classifier. The third type of error (made infrequent by careful editing and thresholding of the image prior to analysis, and proper user-defined setting of the minimal pixel size of automatically selected objects) occurs when visual inspection of the original grayscale micrograph indicates that a counted object is actually inanimate debris, a lysed cell fragment (e.g., ghost cell), or an otherwise invalid
object that should not be counted. Each of these classification errors is addressed by activating the edit feature, manually selecting the object of interest, and reassigning its appropriate morphotype category in the “Reassigned Category Label” window as illustrated in Figure 15. Once done, this interactive editing results in an automatic update of the corresponding morphotype frequency in the classification data window. Accommodation of the second type error has the greatest impact in expanding the range of microbial communities that can be analyzed by CMEIAS. This was accomplished by adding five other user-defined categories of bacterial shape (listed as “Other-1” to “Other-5”) in the editing interface, and assigning a unique, discernible pseudocolor to each of
190
J. Liu et al.
fications are fairly logical (see Figure 2). The last valid bacterial shape is a special type of unbranched filament that tends to coil, forming enclosed loops on the twodimensional projected image (objects Q and R of Figure 16). This coiled unbranched filament was the only morphotype encountered in this evaluation that required both the second and third editing tasks to classify correctly. ImageTool regarded this morphotype as two objects, one represented by the outer contour of the cell (classified as a spiral) and the other by its inner contour (=outer contour of the closed loop, classified as a coccus). This classification error was corrected by first labeling the internal loop as an invalid object (very dark blue pseudocolor), next reassigning the cell object as “Other-1” (light blue pseudocolor), and finally renaming it as a coiled unbranched filament after exporting the classification data to a compatible spreadsheet program.
Application of the CMEIAS Morphotype Classifier in Microbial Community Analysis
Fig. 16. Seventeen examples of rare bacterial morphotypes not supported by the CMEIAS Morphotype Classifier: (A) square or cube; (B) almost completely enclosed ring; (C) dumbell; (D) sigmoid; (E) bifid; (F) lobed spheroid; (G) sickle; (H) lanceolate; (I) bow; (J) quarter-circle to pyramid; (K) budding; (L) rod with two encircling rings; (M,N) spiked spheroids; (O) star; (P) gull-wing; (Q, bitmap); (R, contour): coiled unbranched filament.
them (Figure 15). We considered this level of flexibility to be sufficient to handle most all communities, since only rarely would a community have a morphological diversity represented by more than 16 different bacterial shapes at any one time. To illustrate the second and third types of edit scenarios, we evaluated 17 other valid-but-rare bacterial shapes that are not uniquely specified in the CMEIAS Morphotype Classifier (Figure 16). Accommodation of the first 16 bacterial shapes (labeled A–P) in community images only required the second editing scenario described above. CMEIAS misclassified them as follows: A as an ellipsoid; B and P as unbranched filaments; C as a prosthecate; D as a spiral; E and F as cocci; G as a curved rod; H as a regular rod; I–L as clubs; and M–O as branched filaments. The reasons for most of these classi-
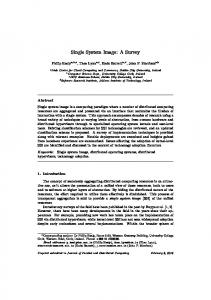
The appropriate number of cells requiring object analysis and shape classification to define the morphological characteristics of microbial communities will vary depending on the degree of their morphological diversity, and should ideally be optimized in studies of microbial community structure. Our experience indicates that a data set of 450–2,550 cells from ∼15 different images is sufficient for the CMEIAS Morphotype Classifier to measure the richness and equitability of abundance of differently shaped bacteria in a complex community sample from a range of anaerobic bioreactors. With these data one can use specialized ecological statistics software (e.g., EcoStat [46]) to compute various indices that make statistically valid comparisons of the morphological diversity component of community structure (using OMUs instead of “species”). Samples varying significantly in object counts are normalized by a percent transformation for comparison to one another. This application is currently being used to augment other methods of community analysis (e.g., profiles of metabolic volatile fatty acids, phospholipid fatty acids, ARDRA, and 16S rDNA sequencing) to develop models that predict the persistence and functional stability of complex microbial communities following nutrient up-shift perturbations in glucose-fed anaerobic bioreactors [11, 15, 18, 19]. Figures 17a–d illustrate this application of CMEIAS in analysis of microbial community structure in two different steady-state bioreactors (labeled “high spiral” reactor HS-6 and “low spiral” reactor LS-4). In Figure 17a, a descending rank-order paret plot of
Image Analysis of Bacterial Morphotypes
191
Fig. 17. Evaluation of the morphological diversity characteristic of microbial community structure in continuously glucose-fed anaerobic bioreactors using data derived from CMEIAS computer-assisted microscopy. (A) Rank-order plot of morphotype frequencies in bioreactors HS-6 and LS-4. (B, C) Time-resolved dynamic changes in frequencies of dominant (B) and rare (C) morphotypes following a transient glucose up-shift perturbation. (D) Dynamic changes in morphotype diversity indices and pairwise analysis of community proportional similarity (each community sample compared to the to parent community) to monitor ecological succession following a nutrient up-shift perturbation.
the relative abundance of OMUs clearly indicates differences in the morphological diversity of these two complex microbial communities just prior to nutrient up-shift perturbation. This information reveals the shared dominance of regular rods and spirals in reactor HS-6 in contrast to the sole dominance of cocci in reactor LS-4 (reflected in their Simpson dominance values of 0.346 and 0.445, and J evenness values of 0.642 and 0.537, respectively). These results concur with differences in relative abundance of 16S rDNA phylogenetic probes hybridizing to corresponding whole community samples, indicating both Methanosaeta-like and Treponema-like ribotypes dominating in the high-spiral reactors and Streptococcus-like ribotypes dominating in the
low-spiral reactors [15]. When provided with an appropriate sized community sample, CMEIAS can distinguish morphotype frequencies at a resolution of 0.1%. This feature offers a unique advantage in evaluation of bacterial morphotypes that occur at very low frequencies, as illustrated by its detection of prosthecate bacteria occurring at 0.1% frequency in reactor LS-4 but no detection of bacteria with this morphotype in reactor HS-6, and small but measurable differences in relative frequency of other rare bacterial morphotypes, e.g., unbranched filaments, U-shaped rods, ellipsoids, and clubs within these same communities. Figures 17b–d illustrate applications of CMEIAS to obtain morphological diversity data that monitor the dynamic
192
nature of community structure reflecting ecological succession in response to environmental perturbations. The codominant morphotypes of regular rods and spirals in bioreactor HS-6 respond to nutrient up-shift perturbations by rapid, transient, opposite shifts in relative frequencies (Figure 17b), followed by a return to original frequencies suggesting an overall high level of resilience of the corresponding organisms within that community. Again, the ability of CMEIAS to classify morphotypes at high resolution permits a detailed, simultaneous assessment of the complex dynamic changes in abundance of rare bacterial morphotypes in the community during this same period, with the general trend of transient shifts in their relative frequencies immediately after the nutrient perturbation, followed by a gradual return in most cases to near their original frequency (Figure 17c). Figure 17d illustrates the usefulness of CMEIAS in the higher-order ecological analysis of microbial community dynamics to assess the overall impact of environmental perturbations on whole community structure. In this case, CMEIAS-derived data of morphotype richness and distribution of abundance were used to compute a “morphotype diversity index” (i.e., a Shannon–Wiener-like diversity index of OMUs) and a pairwise analysis of community proportional similarity (relatedness in structure of a community sampled at time tx after the perturbation relative to the corresponding parent community sampled at to) to indicate the rapid community response to the up-shift nutrient shock, its duration and magnitude, and the degree to which the morphological diversity component of community structure rebounds to a level similar to that of the original community just prior to the nutrient perturbation. Such diversity indices are attractive because they reduce large amounts of data to single indicator numbers, but the drawback of this summarization of data is that information is lost. However, when supplemented with other characteristics of microbial communities (e.g., metabolic profiling, ribotype diversity), this CMEIAS-derived morphological information can become very useful in developing ecological models of community persistence, function, and stability [15, 19].
Conclusions and Future Work Creation of a robust object classifier that can accurately classify the major morphotypes of bacteria is the most challenging phase in development of an image analysis system for microbial community studies. The results described here show that this has now been done. This first version of
J. Liu et al.
CMEIAS significantly advances the ability of computerassisted microscopy and image analysis systems to classify bacterial morphotypes semi-automatically in well-dispersed samples from planktonic and biofilm communities that are more complex than ever before possible. A stopwatch timefunction study on an image series indicated that an experienced user operating a Pentium II PC at 300 MHz would spend an average of 7.1 ± 3.4 min (x ± std. dev., n = 30 images, range = 0.8–12.7 min) per grayscale community image to perform the required steps (6.5 min to edit in Photoshop, 0.5 min to analyze in CMEIAS/ImageTool, and 0.1 min to export data to a compatible spreadsheet program) to obtain morphotype classification data at 97% classification accuracy. This amount of time required to quantitate morphological diversity is short enough to be useful in augmenting the analysis of microbial community structure. We intend to release this CMEIAS Ver. 1.27 custom plug-ins free of charge for research and educational purposes from the Michigan State University Center for Microbial Ecology Web site (http://www.cme.msu.edu/CME/index.html) to operate in the host program UTHSCSA ImageTool Ver. 1.27 (http://www.uthscsa.edu/dig/itdesc.html). We are currently preparing an operator manual for this version of CMEIAS and intend to make it available as a download at the CME Web site. We are also currently developing more advanced CMEIAS plug-ins operating in ImageTool to further enhance the application of computer-assisted microscopy in microbial community analysis. This next version of CMEIAS will perform semi-automatic object classification of OMUs to a much higher degree of morphological diversity in microbial communities based on shape and size borders that are taxonomically relevant, plus compute several ecological parameters of microbial abundance, and feature various in situ measurements of two-dimensional spatial distribution analysis of sessile cells during early stages of surface biofilm colonization. These new CMEIAS measurement features will automatically compute bacterial biovolume based on formulas optimized for each classified morphotype, biomass C and biosurface area of bacterial objects, object concentration and spatial densities, cumulative length of filamentous microorganisms, first and second nearest-neighbor distances between individual cells for use in plotless analyses of spatial distribution and dispersion, percent microbial cover, percent unoccupied space, and landmarked geo-reference data of each object’s (x,y) centroid coordinates for use in plot-based geostatistics to compute semivariogram autocorrelations and kriging density maps of microbial spatial distribution.
Image Analysis of Bacterial Morphotypes
This next version of CMEIAS will also feature a new semiautomatic image editing module specifically designed to facilitate the segmentation of touching and dividing bacterial cells (currently, one of the major time-consuming preprocessing steps in image analysis of microbial communities), and color recognition capability to extract phylogenetic, metabolic, and strain-specific information from microscopical images acquired using fluorescent molecular probes. With these added features, CMEIAS should provide wide applications in the use of computer-assisted microscopy to study in situ microbial ecology. Note added in proof: Some web browsers may have problems displaying the content of the formulas in the online version of this article, and therefore we recommend that readers refer to the printed version if they intend to use them.
193
5.
6. 7.
8.
9.
10.
Acknowledgments 11.
This work was supported by National Science Foundation Grants No. DEB-9120006 to the Center for Microbial Ecology and by INT-9315089 (for OG) for Russian collaborative work. We thank R. Srivatsa, H. Lin, T. Zhang, M. Borders, and E. Marshall for assistance in development of this project, M. Valdes for the pure culture of Frankia sp., M. Yokoyama, S. Hashsham, and J. Breznak for anaerobic community samples, J. Tiedje for many helpful comments, S. Dollhopf for beta testing, and the developers of ImageTool at the University of Texas Health Science Center at San Antonio for providing their source code. CMEIAS is copyrighted by the Michigan State University Board of Trustees.
12.
13. 14.
15.
References 16. 1.
2.
3.
4.
Alfreider A, Pernthaler J, Amann R, Sattler B, Glockner F, Wille A, Psenner R (1996) Community analysis of the bacterial assemblages in the winter cover and pelagic layers of a high mountain lake by in situ hybridization. Appl Environ Microbiol 62:2138–2144 Bjornsen PK (1986) Automatic determination of bacterioplankton biomass by image analysis. Appl Environ Microbiol 51:1199–1204 Blackburn N, Hagstrom A, Wikner J, Cuadros-Hansson R, Bjornsen P (1998) Rapid determination of bacterial abundance, biovolume, morphology, and growth by neural network-based image analysis. Appl Environ Microbiol 64:3246– 3255 Bloem J, Veninga M, Shepherd J (1995) Fully automatic de-
17.
18.
19.
termination of soil bacterial numbers, cell volumes, and frequencies of dividing cells by confocal laser scanning microscopy and image analysis. Appl Environ Microbiol 16:926–936 Brock TD (1984) How sensitive is the light microscope for observations on microorganisms in natural habitats? Microb Ecol 10:297–300 Caldwell DE (1985) New developments in computerenhanced microscopy (CEM). J Microbiol Meth 4:117–125 Caldwell DE, Germida JJ (1984) Evaluation of difference imagery for visualizing and quantitating microbial growth. Can J Microbiol 31:35–44 Dandurand LM, Schotzko D, Knudsen G (1997) Spatial patterns of rhizoplane populations of Pseudomonas fluorescens. Appl Environ Microbiol 63:3211–3217 Dazzo FB, Petersen M (1989) Applications of computerassisted image analysis for microscopical studies of the Rhizobium-legume symbiosis. Symbiosis 7:193–210 Dazzo FB, Wright S (1996) Production of anti-microbial antibodies and their use in immunofluorescence microscopy. In: Akkermans A, van Elsas J, de Bruijn F (eds) Molecular Microbial Ecology Manual, vol 4:12. Kluwer Academic Publishers, Dordrecht, The Netherlands, pp 1–27 Dollhopf SL, Hashsham S, Dazzo F, Criddle C, Hickey R, Tiedje J (1998) Novel community structure in a model methanogenic system: implications for carbon and energy flow. 8th International Symposium on Microbial Ecology. International Society for Microbial Ecology, Halifax, Canada, pp 139 Dubuisson M, Jain AK, Jain MK (1994) Segmentation and classification of bacterial culture images. J Microbiol Meth 19:279–295 Duda R, Hart P (1973) Pattern Classification and Scene Analysis John Wiley & Sons, New York, pp 103–132 Estep KW, MacIntyre F, Hjorleifsson E, Sieburth JM (1986) MacImage: A user-friendly image-analysis system for the accurate measurement of marine organisms. Mar Ecol Prog Ser 33:243–253 Fernandez Z, Hashsham S, Dollhopf S, Raskin L, Glagoleva O, Dazzo FB, Hickey R, Criddle C, Tiedje J (2000) Flexible community structure correlates with stable community function in methanogenic communities perturbed by glucose. Appl Environ Microbiol 66:4058–4067 Gasol JM, Massana R, Pedros-Alio C (1997) Bacterial size structure as a method to analyze communities. In: Martins MT, Sato MI, Tiedje JM, Norton-Hagler LC, Dobereiner J, Sanchez PS (eds) Progress in Microbial Ecology. Brazilian Society for Microbiology, Sa˜o Paulo, Brazil, pp 155–160 Gualtieri P, Ghetti F, Passarelli V (1987) Microorganism track reconstruction: An image processing approach. Comput Biol Med 18:57–63 Hashsham S, Marsh T, Fernandez A, Seston S, Lutgarde R, Dazzo F, Hickey R, Criddle C, Tiedje J (1998) Microbial ecology of anaerobic digesters: Stability and persistence during shock loads. 8th International Symposium on Microbial Ecology, Halifax, Canada, pp 172 Hashsham S, Fernandez A, Dollhopf S, Dazzo FB, Tiedje J, Hickey R, Criddle C (2000) Parallel processing correlated with
194
20.
21.
22.
23.
24.
25.
26.
27.
28.
29.
30.
31.
32.
33.
J. Liu et al. greater functional stability in methanogenic communities perturbed by glucose. Appl Environ Microbiol 66:4050–4057 Henrici AT (1928) Morphologic variation and the rate of growth of bacteria. Charles C. Thomas Publisher, Springfield, IL, pp 194 In: Holt JJ, Krieg NR, Sneath PH, Staley JT, Williams ST (1994) Bergey’s Manual of Determinative Bacteriology 9th ed Williams & Wilkins, Baltimore, MD, pp 787 Jain AK, Zongker D (1997) Feature selection: Evaluation, application, and small sample performance. Inst of Electrical and Electronics Engineers, Transactions on Pattern Analysis and Machine Intelligence 19:153–158 James GA, Korber DR, Caldwell DE, Costerton JW (1995) Digital image analysis of growth and starvation responses of a surface-colonizing Acinetobacter sp. J Bacteriol 177:907–915 Kambeck C, Kambeck H, Schroder D, Newell S (1990) Sizing bacterioplankton: A juxtaposition of bias due to shrinkage, halos, subjectivity in image interpretation and asymmetric distributions. Binary 2:5–14 Korber DR, James GA, Costerton JW (1994) Evaluation of fleroxacin activity against established Pseudomonas fluorescens biofilms. Appl Environ Microbiol 60:1663–1669 Korber DR, Lawrence JR, Hendry MJ, Caldwell DE (1992) Programs for determining statistically representative areas of microbial biofilms. Binary 4:204–210 Korber DR, Lawrence JR, Hendry MJ, Caldwell DE (1993) Analysis of spatial variability within Mot+ and Mot− Pseudomonas fluorescens biofilms using representative elements. Biofouling 7:339–358 Lawrence JR, Korber DR, Caldwell DE (1989) Computerenhanced darkfield microscopy for the quantitative analysis of bacterial growth and behavior on surfaces. J Microbiol Meth 10:123–138 Lawrence JR, Korber DR, Wolfaardt GM, Caldwell DE (1997) Analytical imaging and micoscopy techiniques. In: Hurst CJ, Knudsen GR, McInerney MJ, Stetzenbach LD, Walker MV (eds) Manual of Environmental Microbiology. American Society for Microbiology Press, Washington DC, pp 29–51 Lenski R, Mongold J, Sniegowski P, Travisano M, Vasi F, Gerrish P, Schmidt T (1998) Evolution of competitive fitness in experimental populations of E. coli: What makes one genotype a better competitor than another? Anton Van Leeuwenhoek 73:35–47 Lenski R, Mongold J (2000) Cell size, shape, and fitness in evolving populations of bacteria. In: Brown J, West G (eds) Scaling in Biology. Oxford University Press, London, pp 221–235 Liu J, Yu B, Jain A, Glagoleva O, Dazzo FB (1998) CMEIAS©: Center for Microbial Ecology Image Analysis System. 8th International Symposium on Microbial Ecology. International Society for Microbial Ecology, Halifax, Canada, pp 218 Massana R, Gasol JM, Bjornsen PK, Blackburn N, Hagstrom A, Hietanen S, Hygum BH, Kuparinen J, Pedros-Alio C (1997) Measurement of bacterial size via image analysis of epifluorescence preparations: Description of an inexpensive system and solutions to some of the most common problems. Sci Mar 61:397–407
34. Meijer BC, Kootstra GT, Wilkinson MHF (1990) A theoretical and practical investigation into the characterization of bacterial species by image analysis. Binary 2:21–31 35. Moller S, Kristensen C, Poulsen L, Carstensen J, Molin S (1995) Bacterial growth on surfaces: Automated image analysis for quantification of growth-rate related parameters. Appl Environ Microbiol 61:741–748 36. Pfennig N, Wagener S (1986) An improved method of preparing wet mounts for photomicrographs of microorganisms. J Microbiol Meth 4:303–306 37. Ramsing NB, Fossing H, Ferdelman TG, Andersen F, Thamdrup B (1996) Distribution of bacterial populations in a stratified fjord (Mariager Fjord, Denmark) quantified by in situ hybridization and related to chemical gradients in the water column. Appl Environ Microbiol 62:1391–1404 38. Rosin P, Venkatesh S (1993) Extracting natural scales using Fourier descriptors. Pattern Recognition 26:1383–1393 39. Rovira AD, Newman EI, Bowen HJ, Campbell R (1974) Quantitative assessment of the rhizoplane microflora by direct microscopy. Soil Biol Biochem 6:211–216 40. Sieracki ME, Johnson P, Sieburth J (1985) Detection, enumeration, and sizing of planktonic bacteria by image-analyzed epifluorescence microscopy. Appl Environ Microbiol 49:799– 810 41. Sieracki ME, Reichenbach S, Webb K (1989) Evaluation of automated threshold selection methods for accurately sizing microscopic fluorescent cells by image analysis. Appl Environ Microbiol 55:2762–2772 42. Simek K, Vrba J, Pernthaler J, Posch T, Hartman P, Nedoma J, Psenner R (1997) Morphological and compositional shifts in an experimental bacterial community influenced by protists with contrasting feeding modes. Appl Environ Microbiol 63:587–595 43. Singh A, Pyle BH, McFeters GA (1998) Rapid enumeration of viable bacteria by image analysis. J Microbiol Meth 10:91–101 44. Sjollema J, Busscher H, Weerkamp A (1989) Real-time enumeration of adhering microorganisms in a parallel plate flow cell using automatic image analysis. J Microbiol Meth 9:73–78 45. Tomori Z, Marein J, Zolotova I, Krekule I (1998) Interactive segmentation of biometical images. Proc 14th Biennial International Conference “Biosignal 98,” Brno, Czech Republic, June 23–25, 1998. SegmentTool plug-in module for ImageTool. Internet site: http://www.saske.sk/∼tomori/ 46. Towner H (1999) EcoStat Ecological Analysis Program for Windows, Ver 1.01, Trinity Software, Compton, NH, Internet site: http://www.trinitysoftware.com/lifesci/index.html 47. Wilcox CD, Dove SB, Doss-McDavid W, Greer DB (1997) UTHSCSA ImageTool© Ver 1.27, http://www.uthscsa.edu/dig/ itdesc.html, Univ. Texas Health Science Center, San Antonio, TX, USA 48. Wilkinson M, Schut B (1998) Digital Image Analysis of Microbes: Imaging, Morphometry, Fluorometry and Motility Techniques and Applications John Wiley & Sons, NY, pp 486 49. Yu B, Yuan B (1995) A consistent attributed graph-based hand-drawn circuit diagram reading system. Chinese J Electronics 4:1–11
MICROBIAL ECOLOGY Microb Ecol (2001) 42:215 DOI: 10.1007/s00248-001-0030-z © 2001 Springer-Verlag New York Inc.
Errata In J. Liu, F.B. Dazzo, O. Glagoleva, B. Yu, and A.K. Jain, “CMEIAS: A Computer-Aided System for the Image Analysis of Bacterial Morphotypes in Microbial Communities,” Microb Ecol 41:173–194 (DOI: 10.1007/s002480000004), a number of errors appeared. Most occur in the print version of the article but not in the online HTML version; these seem to have been due to a problem in the conversion of the electronic files of the article to text. The publisher wishes to apologize to the authors of the article, the readers, and the editors of the journal for these mistakes. 1. page 175, right column, line 25 incorrectly states “turbidity (≡107 cells ml−1). . .” The correct statement is “turbidity (∼107 cells ml−1).” 2. page 175, right column, line 26 incorrectly states “density of ca. 30–120 separated cells. . .” The correct statement is “density of ca. 30–170 separated cells. . .” 3. page 176 left column, lines 28–29; page 192, right column, line 22; and page 194, reference 47: The URL for the UTHSCSA ImageTool is now http://www.ddsdx. uthscsa.edu/dig/itdesc.html 4. page 176, right column, line 15, the correct spelling of the objective lens name is “PlanApochromat.” 5. page 180, right column, line 1, the “2 Perimeter” in the numerator for the formula to compute cell width is incorrect. The correct formula is:
Width =
冦
Perimeter − 公Perimeter2 − 4 Area ,
ellipsis (. . .). Thus, line 23 should read: “sequence of equidistant points (xk,yk), k = 0, . . . , N − 1, where. . .”. Line 25 should read “Let zk = xk + jyk, k = 0, . . . , N − 1 be a sequence in the complex. . .”. The last part of the equation on line 28 should read “k = 0, . . . , N − 1”. The last part of the equation on line 30 should read “n = 0, . . . , N − 1”. Line 33 should read: z’k = Szk + tej + T, k = 0, . . . , N − 1” (note: exponent symbol for e is j, not j). Line 35 should read: “translation vector in the complex space, the rotation angle,”. Line 39, the last part of the formula should read “ej, n = 1, . . . , N − 1.” 7. page 181, left column, line 5 of text should read: “n = 2, . . . , N − 1 are invariant with respect to translation,” 8. page 185, left column, the formula for r2 did not include the F6 designation. It should read:
r2:
9.
10. 11.
12.
If Roundness ⱕ 0.8; otherwise, Area . Major Axis Length
6. page 180, right column. The formulas to describe the computation of Fourier Descriptors are incorrect; throughout, the symbol K needs to be replaced with an
13.
14.
冦
1 − 16 ⱖ 0, x ∈elongated, F6(x) 1 − 16 < 0, x ∈(⍀1 − elongated), if F6(x)
if
page 185, right column, line 5 from bottom, the first line of the formula for r4 should read: “if {(AR(x) + 120° < 180°} and {AV(x) − 120°)} > 180°,” page 189, left column, line 3, the frequency of error should be “∼3%”, not “≡3%”. page 189, the legend for figure 15 should end with the sentence “All pseudocolors are distinguishable in the monitor display of this graphical interface.” page 190, right column, bottom line, “paret” should be changed to “pareto”. page 193, the title of the article cited in reference 19 should read “Parallel processing of substrate correlates with greater functional stability in methanogenic bioreactor communities perturbed by glucose.” page 194, The date of the article cited in reference 43 should be “1989”.