The Impact of Design and Operating Parameters on Skull Formation in a Blast Furnace Hearth Yongfu Zhao and Louis W. Lherbier, Jr. United States Steel Corporation Research and Technology Center 800 East Waterfront Drive, Munhall, PA 15120 Email:
[email protected] Tel: 412-433-7268 Fax: 412-433-7222 Dong Fu, Yan Chen and Chenn Q. Zhou Purdue University Calumet Center for Innovation through Visualization & Simulation Hammond IN 46323 Email:
[email protected] John G. Grindey United States Steel Corporation Gary Works One North Broadway Gary, IN 46402 Email:
[email protected] Key words: Blast Furnace, Hearth, Skull Formation, CFD, Computer Modeling. ABSTRACT Using a 2-dimensional heat transfer-fluid flow dynamics-solidification computer simulation, the skull formation phenomena in a blast furnace hearth is investigated systematically. The impact of hearth design and furnace operating parameters on skull formation is discussed, including lining property and structure, cooling water temperature and flow rate, hot metal production rate, temperature and viscosity, and cast practice. The findings from this study are compared with operating experience of U. S. Steel blast furnaces. INTRODUCTION Blast furnace campaign life largely depends on the hearth lining erosion status. United States Steel Corporation has seventeen blast furnaces at its operations in the United States, Canada and Slovakia. Some have been in operation for 15 to 20 years without major hearth reline work; but others have been relined two or three times in the same time period. Blast furnace hearth erosion and protection has attracted great corporate attention. In 1997, a hearth erosion computer monitoring system was first implemented for Gary Works’ No. 13 blast furnace. [1] Since then, nearly all blast furnaces in the company have been monitored in a similar way. The monitoring experience has indicated that avoiding direct contact between carbon brick and liquid iron or slag is the most important principle for extending the hearth lining life and a blast furnace campaign. The skull, which is a layer of iron or slag solidified on the inner surface of the hearth lining, provides a barrier between carbon brick and liquid iron or slag. As long as the skull exists, the hearth erosion nearly stops. When the skull disappears, the hearth erosion speeds up. This understanding is obvious and reasonable. However, the problem is how to form and maintain a skull layer. Following are examples of some frequently asked questions by blast furnace ironmaking personnel:
At what refractory thickness will hearth erosion stop or approach an “equilibrium” status? What cooling system is better? Shower, channel, or stave cooling? Furthermore, copper or iron stave cooling? What cooling water flow rate can be considered as sufficient?
AISTech 2012 Proceedings
457
Will a cooling water chiller be effective? Since side wall heat flux is a key variable in hearth design, what heat flux value should be used? Is there any advantage in using a combination of carbon and graphite for the side wall? What countermeasures should be implemented when the skull disappears?
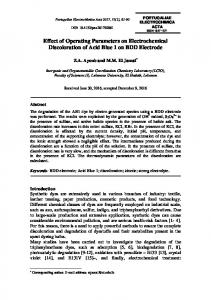
In the last three decades, considerable work has been done to model heat transfer and temperature distribution in blast furnace hearths. [2-6] Some studies have applied computational fluid dynamics (CFD) to simulate the interaction of liquid iron and slag with the hearth wall surface. [7-11] The trouble is that, when designing the hearth, skull formation phenomena are not able to be quantitatively determined. Even for a blast furnace already in operation with a full array of thermocouples in the hearth, the skull status varies considerably because of the many operating parameters involved. As a result, it is very difficult to isolate the effects of individual parameters on skull formation or dissolution. It is realized that heat transfer and fluid flow dynamics simulation alone are not sufficient to study the impact of design and operating parameters on skull formation. In order to improve the understanding of skull formation, solidification dynamic process has to be integrated with heat transfer and fluid dynamics simulation. This work utilizes a two-dimensional mathematical model to simulate the dynamic process of the solidification of liquid iron and slag on the blast furnace hearth wall. This paper will forego extensive discussion about the mathematical model as the details will be presented in another paper. [13] It focuses on the results of integrated heat transfer, fluid flow dynamics and solidification modeling, all of which were carried out to investigate the role of hearth design parameters and furnace operating practices on skull formation in the hearth of an industrial blast furnace. DISCUSSION Skull ratio A simplified blast furnace hearth is shown in Figure 1. The hot side of the lining (in dot-shadow) is exposed to liquid iron or slag flow. The cold side of the lining is a shell (in line-shadow) and cooling water (in blue color). In moving along the lining surface, the liquid iron is cooled down due to heat transfer to the cooling water across the lining and the shell. In a certain range, the lining is exposed to liquid iron or slag (LE); over that range, the liquid temperature in the boundary layer approaches its solidification point. A skull (in brown color) begins to form. At the final travel distance (L), the skull layer becomes thicker (H as thickness). The skull ratio is defined as: L LE (1) R Skull L The skull profile can be characterized by the two parameters LE and H. Linear regression analyses show, however, a strong correlation between LE and H. In this work, the skull formation characteristic can therefore be described by a single parameter, the skull ratio, RSkull. The impact of the thickness of the brick, shell, cooling water, and the travel distance of the liquid or slag on skull ratio will be discussed. Liquid Iron or Slag
H Skull Skull
LE
Brick Shell
2.25”
Water L
1.5”
~49 ft (15 m)
Figure 1.
Schematic of skull formation process in a blast furnace hearth.
Subject hearth The subject of this study is shown in Figure 2. The nominal hearth diameter is approximately 37 feet. The installed brick lining is as thick as 96 inches on the taphole side and as thin as 47 inches on the non-taphole side. As described elsewhere, liquid iron flows vertically and circumferentially.(13) The major velocity component is in the circumferential direction. The liquid travel distance to the taphole is approximately 49 ft (15 m). The hearth selected in this work has channel cooling (sometimes referred as jacket cooling). The effective diameter of the channels is 1½ inches. The steel shell thickness is 2¼ inches.
458
AISTech 2012 Proceedings
The two-dimensional model shown in Figure 1 uses a uniform inlet velocity and outlet pressure specified as the left and right boundary conditions for liquid iron or slag. A constant inlet velocity and temperature is specified for the cooling water. The liquidus and solidus temperatures of iron depend on the carbon concentration in the hot metal. With a typical carbon concentration of 4.7 percent, the liquidus temperature is determined as 1473°K and the solidus temperature as 1420°K. The material properties used in this work are listed in Table I. The velocity of liquid iron near the lining surface is an input variable in the skull formation computer model shown in Figure 1. Thus, the velocity has to be determined prior to the heat transfer-fluid dynamics-solidification computation, and it is calculated using a 3-dimensional CFD simulation. An example is shown in Figure 3, where 3(a) is a top view of the subject hearth; 3(b) is a 3-D view of the hearth with a deadman in the center; and 3(c) is a view of the velocity vectors in a horizontal section. The hearth has three tapholes. Normally, one is open and two are closed. Thus, the maximum distance liquid iron travels to a taphole is about half of the hearth circumference (15 m or 49 ft). The velocity of hot metal for this furnace is within the range of 0.1 to 1.0 mm/s under typical operating conditions, except near the taphole region. The value is a function of hot metal productivity, deadman size and porosity, as well as hearth geometry. The base case daily production rate is 8000 NTHM. The inlet hot metal velocity is taken as the average velocity shown in Figure 3(c), which is calculated to be 0.256 mm/s. More than fifty different cases were modeled to investigate the impact of hearth design and operating conditions on skull formation. The parameters considered are based on typical operating parameters for the subject furnace as well as other industrial furnaces, and are summarized in Table II. As will be shown, the modeling results agree quite well with plant observations.
47.24””
Figure 2.
The subject hearth in this study.
(a)
Figure 3.
96.46”
(b)
(c)
The hearth has three tapholes. Normally, one is open, two are closed. (a) a top view of the subject hearth; (b) a 3-D view of the hearth with a deadman in the center; (c) the velocity vectors in the taphole elevation plane.
AISTech 2012 Proceedings
459
Table I.
Material Properties
Variables
Unit
Hot Metal
Slag
Skull
Water
Shell
Density
Kg/m3
7000
2590
/
998.2
/
Viscosity
kg/m/s
0.00715
0.3
/
0.001003
/
Thermal Conductivity
W/m/K
16.5
1.62
4
0.6
43
Heat Capacity
J/kg/K
850
1820
/
4182
/
Melting Latent Heat
J/kg
203343
247139
/
/
/
Solidus Temperature
K
1420
1561
/
/
/
Liquidus Temperature
K
1473
1672
/
/
/
Table II. Parameters
Baseline Case and Variation Range of Parameter Study Unit
Baseline Case
Variation Range
Lining Materials
/
Carbon
Carbon and Graphite
Brick Thickness
inches
96
12-47
Cooling Water Velocity
ft/sec
6.6
0.3-32
Cooling Water Inlet Temperature
ft/sec
77
32-130
/
Jacket
Shower, Copper and Iron Staves
NTHM/day
8000
4000-10000
F
2700
2600-2800
Liquid Iron Velocity
Inch/min
0.6
0.24-2.4
Liquid Iron Viscosity
poise
0.0715
0.001-1
/
No
No/Yes
Cooling Device Hot Metal Production Rate Hot Metal Temperature
Slag Effect Considered
Computer simulation The commercial software ANSYS ® FLUENT ® 13.0 is utilized to conduct the simulation based on the two-dimensional heat transfer, fluid flow and solidification model shown in Figure 1.[12] Various results calculated for the baseline case are shown in Figure 4. The liquid iron velocity vector is shown in Figure 4(a). It can be seen that the formation of skull has some influence on the velocity field. The velocity decreases along the vertical direction and reaches zero at the solid liquid interface. The temperature distribution of the hot metal and within the brick and steel shell is shown in Figure 4(b). The largest temperature gradient is observed within the carbon brick. From the isothermal line in Figure 4(c), the temperature decreases from about 1500 to 300 K in the carbon brick. It is also noticed the vertical heat transfer is dominant since the isothermal lines are approximately parallel in the horizontal direction. The liquid fraction of iron is shown in Figure 4(d), where 100 percent liquid is shown in red color. The lower part of Figure 4(d) represents an enlarged section near the solidification starting point. The curves in red color are contour lines of the liquid fraction. The liquid fraction value of 0.5 is defined as the liquid-solid interface. For the baseline case, the simulation results of the distribution of temperature and heat flux along the brick-hot metal interface are shown in Figure 5. The carbon-iron interface temperature decreases from the inlet to the outlet. The rate of temperature decrease is enhanced after passing the liquidus line 1473 K due to skull formation. A lower heat transfer rate is observed in the area covered by skull, as indicated by the dashed line. In contrast, the heat flux is nearly constant in the skull-free zone. The skull-free distance, LE, is calculated as 10.84 m. Parametric study More than fifty cases of simulations were conducted to systematically investigate how the factors summarized in Table II affect skull formation. The skull ratio is used as a standard index for comparison. The relationship between skull ratio and brick thickness, brick thermal conductivity, furnace productivity, hot metal inlet temperature, cooling water velocity and cooling water inlet temperature on skull formation are studied.
460
AISTech 2012 Proceedings
(a)
(b)
(c)
(d)
Figure 4.
An example of the results calculated from the two-dimensional heat transfer, flow and solidification model. (a) Liquid iron velocity vectors colored by velocity magnitude (m/s). (b) The temperature distribution of the hot metal and within the brick. (c) The isothermal line of temperature distribution. (d) The liquid fraction distribution of hot metal. The lower chart is an enlarged section near the solidification starting point. The contour of the liquid fraction is shown.
Figure 5.
Distribution of temperature and heat flux along the brick-hot metal interface.
AISTech 2012 Proceedings
461
Impact of brick thickness The relationship between skull ratio and brick thickness is shown in Figure 6, assuming the daily hot metal production rate is 8000 NTHM and the thermal conductivity of the carbon brick is 17.3 W/m/K. As shown, the skull ratio is only about 28 percent when the brick is 96 inches thick. The skull ratio increases quickly as the brick becomes thinner. The ratio is 85 percent at 47 inches and 97 percent at 24 inches. The brick is completely covered by skull (skull ratio of 100 percent) at 12 inches. The hearth wall erosion process for the subject furnace is consistent with this finding. It was observed that thicker sidewall areas (Figure 2) have eroded faster than thinner areas. After about two years, the areas with 47 inches of sidewall have lost only 2 to 3 inches, but the areas having a thickness of 96 inches have lost up to 35 inches or about one-third of the original block. As mentioned in the beginning, some blast furnace operators often expect that after a short time period hearth erosion will stop, i.e. the brick reaches an equilibrium status. This work indicates that for the subject hearth, such expectation is not realistic. Model output suggests instead that the skull ratio will be 100 percent at 12 inches of thickness, i.e., near the end of the hearth campaign. The skull formation process however is not only affected by brick thickness, but by many operational variables. For example, any change in production rate, cast practice, or operational stability could break the skull equilibrium status. Therefore, one must take all necessary precautions to prevent hearth erosion from the beginning of the campaign. 100
Skull Ratio (% )
80
60
40
20
0 0
20
40
60
80
100
Carbon Brick Thickness (inch)
Figure 6.
The relationship between skull ratio and brick thickness.
Heat flux on the side wall The maximum value of heat flux on the hearth wall is important for the hearth water cooling system design. When an inner spot loses skull, that heat flux across the lining of that area reaches a maximum value. One would expect that the cooling system is sufficient to remove the heat load and reform the skull. The question becomes what heat flux value should be used as the standard. So far, all designs have relied upon the measured data in the previous campaign or empirical data from other blast furnace operations. In most cases, the distance between two sets of thermocouples is about ten feet. It is hard to tell whether the heat flux measured represents an area with or without skull. This work is the first time to identify the heat flux value on a fundamental basis. The relationship between the heat flux on the hearth wall and brick thickness is shown in Figure 7. The pink dashed line represents the heat flux calculated for the area exposed to liquid iron. The brown solid line represents the heat flux calculated for an area covered with skull. The blue shaded area represents the heat flux measured from thermocouples positioned 4 to 6 feet below a taphole in the subject furnace. The heat flux values, as modeled and measured, follow similar trends, i.e., as the brick thickness decreases, the heat flux increases. One may notice that the shadow range (the measured heat flux) falls between the pink line (the calculated heat flux for the skull-free area) and the brown solid line (the calculated heat flux for skull-covered area). This is reasonable since the measured value is representative of a rather wide area, which may be partially covered by skull. It is well known from most heat transfer textbooks that film boiling occurs when the heat flux approaches 106 W/m2. Once film boiling begins, vapor on the cold side of the furnace shell creates a heat conduction barrier. The carbon brick and shell lose cooling and a breakout may occur immediately. The brown color bar in Figure 7 shows a heat flux of 106 W/m2, which corresponds to a skull-free brick thickness of 6 inches. Thus, it is easy to understand that when the carbon brick thickness is exceedingly thin, the hearth is highly susceptible to a breakout. The breakout thickness of 6 inches is consistent with a previous incident where an incandescent hot spot was observed on the hearth shell of an operating furnace. A highpressure water jet was applied to that area immediately, and the furnace was shut down. Afterwards, it was found that only 4 to 6 inches of carbon brick remained. Carbon brick thermal conductivity The thermal conductivity of carbon brick has a great impact on skull formation. An example for 96 inch thick brick is shown in Figure 8. When the thermal conductivity is 15 W/m/K, the skull ratio is near zero. When the thermal conductivity is 20 W/m/K, the
462
AISTech 2012 Proceedings
skull ratio is near 48 percent. If 24 inches of carbon refractory is replaced by high-conductivity graphite on the shell side, the skull ratio increases considerably. However, the computer simulation indicates that for 47-inch thick brick, the effect of additional graphite is not as significant as for 96-inch brick. Thus, it may not be necessary to use a combination of carbon and graphite in all situations. 10,000,000
Heat Flux (W/m2)
1,000,000
No Skull Area
100,000
10,000 Skull Area 1,000 0
20
40
60
80
100
Carbon Brick Thickness (inch)
Figure 7.
Heat flux on the heath wall varies with brick thickness. The blue color line shaded area represents heat flux measured from thermocouples located 4 and 6 feet below taphole elevation on the subject furnace. The pink dashed line represents the heat flux calculated for the area exposed to liquid iron. The brown solid line represents the heat flux calculated for an area covered with skull. The brown bar illustrates that a skull-free brick thickness of 6 inches could lead to film boiling in the cooling water jacket. 100
80 Skull Ratio (% )
Carbon 72" + Graphite 24" 60
40 Carbon 96"
20
0 15
16
17
18
19
20
Carbon Brick Thermal Conductivity (W/m/K)
Figure 8.
The impact of brick thermal conductivity on skull formation for 96-inch thick carbon lining. The solid line is for carbon brick only. The dashed line is for a combination of carbon and graphite having the same overall thickness.
Channel cooling and stave cooling The subject hearth has channel cooling. It is always interesting to know whether stave (copper or iron) cooling is better. Figure 9 compares the skull ratio as a function of brick thickness for channel cooling and for cooling with both copper and iron staves. No significant difference is found (as heat removal is generally not constrained by the conductivity of the stave or shell material). Velocity of liquid iron flow This work has found that the velocity of liquid iron flow near to the wall plays a critical role in hearth erosion. The skull ratio increases as the velocity of liquid iron flow decreases (as shown in Figure 10). A previous study indicated that the velocity of liquid iron is strongly affected by a number of operational variables.[10] The most important factors are deadman permeability (associated with PCI rate and coke CSR and size), casting practices (overlap/gap time, drill bit size, and taphole length), and hot metal production rate. Thus, to keep skull on the hearth wall, one may consider taking actions to increase deadman permeability, improve casting practices or decrease production.
AISTech 2012 Proceedings
463
100
Skull Ratio (% )
80
Stave Cooling
60
40
Channel Cooling
20
0 0
20
40
60
80
100
Carbon Brick Thickness (inch)
Figure 9.
The impact of channel cooling and stave cooling on skull formation for a 96-inch thick carbon lining. The solid line is for channel cooling. The dashed line is for stave cooling. 100
Skull Ratio (% )
80
60
40
20
0 0.0
0.5
1.0
1.5
2.0
2.5
Liquid I ron Velocity (inch/min)
Figure 10.
The impact of liquid iron velocity on skull formation for a 96-inch thick carbon lining.
Hot metal production rate The effect of hot metal production rate is considered by varying the velocity of liquid iron. The conversion table of productivity and velocity is shown in Figure 11. The values are determined by 3-dimensional CFD computer modeling similar to that illustrated in Figure 3. For carbon brick having a 96-inch thickness and a hot metal production rate of 8000 NTHM per day, the skull ratio is 28 percent; at 10,000 NTHM per day the skull ratio decreases to 15 percent; at 6000 NTHM per day, the skull ratio nearly doubles. The cases for 47-inch carbon brick and carbon-graphite combinations are also given in Figure 11. A combination of carbon and graphite is clearly superior to an equivalent thickness of carbon alone. This can be attributed to the higher conductivity of graphite. Running at lower production rates has been utilized as one of the standard procedures to stop hearth erosion. Figure 12 shows the history of brick thickness, skull status and hot metal production rate for a taphole area in the subject furnace. The wall in this area was 78 inches thick in April 2010. As the erosion process continued, the wall was 46 inch thick in November 2011. When skull existed, the thickness remained nearly constant. When skull disappeared, the thickness decreased quickly. One may notice that the skull was lost and erosion occurred in late July 2010. Production was subsequently decreased to 6000 NT per day for three weeks. The skull slowly came back in September 2010 and production was increased to 8000 NT per day. A similar series of events occurred again in August 2011. Velocity of cooling water flow As shown in Figure 13, the skull ratio increases with increasing cooling water velocity. However, once the velocity exceeds 6 ft/s, the skull ratio increases very little. Thus, it is not necessary to design for a cooling water velocity above this level. In order to determine a proper cooling water flow rate during the hearth design stage, one must define a default brick thickness for the end of campaign and the cooling water flow should be high enough to avoid film boiling when this thickness is exposed to liquid iron. (Refer to Figure 7 to
464
AISTech 2012 Proceedings
gauge the maximum heat flux for a defined thickness.) If the cooling water is untreated, one must also consider the possibility of carbonate scale deposition on the inner surface of the water channels. 100 Carbon 35" + Graphite 12"
Skull Ratio (% )
80
Carbon 72" + Graphite 24"
60
Carbon 96"
Carbon 47"
40 NTHM/Day 6000 8000 10000
20
0 2000
m/s 0.00019 0.00025 0.00032
4000
6000
8000
10000
12000
Hot Metal Production (NT/day)
Figure 11.
The impact of hot metal production rate on skull formation. The pink solid line is for 96-inch brick and short-dashed blue line is for 47-inch brick. Skull ratios for carbon-graphite combinations are also illustrated. 130
10000
120 8000
100 90
6000
80 70
4000
Production, NT/d
Lining/Skull Thickness, in.
110
60 50
2000
40 30 Mar-10
Figure 12.
0 Jun-10
Sep-10
Dec-10
Mar-11
Jun-11
Sep-11
The history of brick thickness (in dark), skull status (light yellow) and daily hot metal production (squares). 100
Skull Ratio (% )
80
60
40
20
0 0
5
10
15
20
Water Velocity (ft/s)
Figure 13.
The relationship between skull ratio and cooling water velocity.
AISTech 2012 Proceedings
465
Cooling water inlet temperature As shown in Figure 14, the skull ratio decreases slightly with increasing cooling water inlet temperature. For 96-inch thickness of brick, as the water inlet temperature increases from 32oF to 95oF, the skull ratio decreases only about 5 percent. Thus, installation of a cooling water chiller may not be very effective. Figure 15 compares the history of skull thickness (solid blue line) and the inlet temperature of cooling water (circles). The water temperature is around 32oF in winter and 78oF in summer. There is no clear evidence that skull thickness closely correlates with seasonal changes in the cooling water temperature. Some skull loss has, however, been observed in summer months when cooling water temperatures are more variable. The effects of short-term fluctuations in water temperature, if significant, could be dealt with by installing a closed-loop water system. 100
Skull Ratio (% )
80
60
40
20
0 20
40
60
80
100
120
140
Water I nlet Temperature (F)
Figure 14.
The relationship between skull ratio and cooling water inlet temperature.
30
90
25
80
20
70
15
60
10
50
5
40
0 Apr-10
Figure 15.
Cooling Water Temperature, deg. F
Skull Thickness, in.
Hot metal temperature Figure 16 illustrates that the skull ratio will decrease with increasing hot metal temperature. When hot metal temperature is 2700oF, the ratio is 28 percent; when hot metal temperature increases to 2800oF, no skull survives; when hot metal temperature decreases to 2650oF, the skull ratio increases to 55 percent. Hearth thermal status must therefore be controlled to keep skull on the wall. Figure 17 is an example of an actual experience where skull formation was promoted near a taphole as the average hot metal temperature decreased from 2715oF to 2690oF. The skull layer thickness continued to grow when the taphole was subsequently taken out of service.
30 Jul-10
Oct-10
Jan-11
May-11
Aug-11
The history of skull thickness (blue line) and daily average cooling water inlet temperature (circles).
Slag and cast practice Slag has higher viscosity and melting temperature than liquid iron. Modeling further indicates that it is much easier to form a slag skull on the hearth wall. As shown in Figure 18, at a production rate of 8000 NTHM per day and a brick thickness of 96-inches the skull ratio is 100 percent for liquid slag, and 28 percent for liquid iron. This indicates that casting practices are critical in ensuring the
466
AISTech 2012 Proceedings
formation of a protective layer. Long slag times and measures which minimize the amount of hot metal in hearth (e.g., dry cast practice and long tapholes) are beneficial to skull formation. 100
Skull Ratio (% )
80
60
40
20
0 2550
2600
2650
2700
2750
2800
2850
Hot Metal Temperature (F)
The relationship between skull ratio and hot metal temperature for 96-inches of carbon brick. 2.0
2750 Skull
TH1 Open
MA HMT
1.8
2740
Skull, inches
1.6
HMT 20 Casts Moving Average
1.4
2720
1.2
2710
1.0
2700
0.8
2690
0.6
2680
0.4
Taphole #1 out of Service
0.2
Skull Thickness Increased
0.0 9/7/10
Figure 17.
2730
HMT, F
Figure 16.
2670 2660 2650
9/9/10 9/11/10 9/13/10 9/15/10 9/17/10 9/19/10 9/21/10 9/23/10 9/25/10
Skull layer thickness versus hot metal temperature. The skull layer thickness (black dashed line) is determined from thermocouples in the lining under Taphole No.1; the hot metal temperature (red color line) is a 20-cast moving average. Taphole No.1 was out of service from September 21 to 25, 2010. 100
Skull Ratio
80
60
40
20
0 Slag
Figure 18.
I ron
Comparison of skull ratio between liquid slag and iron. The slag has liquidus temperature of 2550oF and viscosity of 3 poise.
AISTech 2012 Proceedings
467
Hot metal viscosity As shown in Figure 19, the skull ratio increases with increasing hot metal viscosity. The variation is more significant when hot metal viscosity is below 0.2 poise. Normally, hot metal viscosity is 0.07 poise, giving a skull ratio of 28 percent for 96-inches of carbon brick. When the viscosity increases to 0.2 poise the skull ratio increases to 43 percent. These findings generally support the common practice of introducing ilmenite or other sources of titanium when faced with elevated hearth lining temperatures. However, one should notice that the present understanding is completely different from the conventional explanation on the role of titanium addition. Conventionally, the role of titanium is explained as that TiC and TiN particles precipitate in liquid iron and then deposit on the surface, the layer of deposit has a high melting temperature, and is able to protect lining from erosion. It does not explain how TiC and TiN particles acuminate on the surface. This work first time reveals that the benefits of titanium additions arise from an increase in hot metal viscosity as TiC and TiN particles precipitate and suspend in liquid iron. Figure 20 shows a schematic relationship between the skull ratio and titanium content in hot metal for 96-inches of carbon brick. The calculation based on Ti-TiC equilibrium in hot meal shows that no TiC and TiN particles precipitate when titanium content is less than 0.07 percent. The thermodynamics parameters used in the calculation are illustrated in [14]. Above 0.07 percent, TiC and TiN precipitation takes place. The viscosity of liquid iron increases substantially due to TiC and TiN particles suspending in liquid iron. As a result, the skull ratio increases. However, once the titanium content in hot metal is greater than 0.2 percent, not only the viscosity increases, but also the melting temperature of iron increases substantially (from 1473K to nearly 1750K).[15] This indicates that excessive concentrations of TiC and TiN solids in the metal can lead to extreme high viscosity and severe casting difficulties. The use of massive doses of titanium to promote the precipitation of TiC and TiN solids and skull formation, may therefore be unnecessary. As shown in Figure 20, the titanium content in hot metal of 0.08-0.15 percent is considered as a proper range to promote the skull formation and to avoid the casting problems associated with titanium addition. 100
Skull Ratio (% )
80
60
40
20
0 0
0.2
0.4
0.6
0.8
1
Hot Metal Viscosity (poise)
Figure 19.
The relationship between skull ratio and hot metal viscosity for 96-inches of carbon brick. 100 Ti Addition
Skull Ratio (%)
80 60 40
Viscosity & M.P. up Viscosity up
20 No Ti(C, N) 0 0.00 0.05
Ti(C, N) Precipitated 0.10
0.15
0.20
0.25
0.30
[%Ti]
Figure 20.
468
Schematic relationship between the skull ratio and titanium content in hot metal. Titanium addition is not effective when [%Ti] is less than 0.07 percent. The skull ratio is constant (28 percent for 96-inches of carbon brick). Above 0.07 percent, TiC and TiN precipitation leads to higher hot metal viscosity, as a result, the skull ratio increases. Above 0.2 percent, hot metal can exhibit extreme viscous and high melting temperature, leading to severe castting difficulties. 0.08-0.15 percent of [%Ti] is considered to be a proper operational range (shown in shadow of light blue color).
AISTech 2012 Proceedings
CONCLUSIONS This is the first comprehensive work of using and integrated heat transfer, fluid flow dynamics and solidification computer simulation to investigate skull formation phenomena in a blast furnace hearth. Over 50 cases were studied and the findings are generally consistent with the operating experience of a U. S. Steel blast furnace. The impact of design and operating parameters on skull formation is summarized here. [1]. It is not realistic to expect erosion to reach equilibrium. Counter-measures to prevent erosion have to be implemented from the beginning of campaign. [2]. The hearth breakout point is determined to be 4 to 6 inches, which is consistent with incidents on some furnaces. [3]. It is found that for the subject hearth, thicker refractory in the taphole area (up to 96-inches) has a higher risk of losing skull and eroding than thinner refractory in other areas (47-inches). A combination of carbon and graphite brick can enhance skull formation, particularly near the tapholes where hot metal velocity is the highest. [4]. A velocity of 2 to 2.5 m/s in the cooling water channel is proper. This work has not found that the installation of a chiller is very effective. Also, it can not confirm copper staves have any advantage over iron staves or channel cooling with respect to skull formation. [5]. Operating practice plays a critical role in the hearth lining erosion process. When facing erosion, one may consider the following operating guidelines for skull recovery: a. Decrease liquid flow velocity by lowering the production rate, or taking an outage in severe situations; for local erosion, plug tuyeres; for erosion of larger areas, decrease PCI rate and use high CSR and large size coke. b. Maintain operational stability and avoid hot furnace conditions; lower hot metal temperature to 2650oF. c. Apply dry cast practice, maximize taphole length and angle to achieve low liquid level d. Increase liquid iron viscosity by adding moderate amounts of ilmenite or other sources of titanium. DISCLAIMER The material in this paper is intended for general information only. Any use of this material in relation to any specific application should be based on independent examination and verification of its unrestricted availability for such use and a determination of suitability for the application by professionally qualified personnel. No license under any patents or other proprietary interests is implied by the publication of this paper. Those making use of or relying upon the material assume all risks and liability arising from such use or reliance. REFERENCES 1. 2. 3. 4. 5. 6. 7. 8. 9. 10. 11. 12. 13.
Y. Zhao: McMaster Symposium on Iron & Steelmaking, No.27, edited by G. A. Irons, May 1999, pp. 178-193 G. Leprince, J. M. Steiler, D. Sert and J. M. Libralesso, Ironmaking Proceedings, 1993, pp. 123-132. S. P. Mehrotra and Y. C. Nand, ISIJ International, Vol. 33, 1993, No.8, pp. 839-846 D. W. Stothart, R. D. Chaykowski, R. J. Donaldson and D. H. Pomerroy, Ironmaking Proceedings, 1997, pp. 311-319. C. D. Chen, J. Y. Wu, C. K. Ho, S. C. Wang, M. K. Liao and C. H. Huang, China Steel Technical Report, No.11, 1997, pp. 78-87 J. L. Evans and G. M. Workman, Journal of Iron and Steel Institute, April 1973, pp. 264-273 K. Shibata, Y. Kimura, M. Shimizu and S. Inaba, ISIJ International, Vol.30, 1990, No.3, pp. 208-215. A. Preuer, J. Winter and H. Heibler, Steel Research 63, 1992, No.4, pp. 147-151. R. David, Z. Yu, D. Rohit, D. Huang, C. Pinakin and C. Q. Zhou: AISTech 2006 Proceedings, Vol. 1, pp. 167. Y. Zhang, R. Deshpande, D. (Frank) Huang, P. Chaubal and C. Q. Zhou: Int. J. Heat Mass Transfer, No. 51, 2008, pp. 186. S. Inaba, Y. Shibata and H. Ohta: ISIJ Int., 44 (2004), No. 12, pp. 2120. Fluent 13.0 User’s Guide, Modeling Solidification and Melting, ANSYS Inc. D. Fu, Y. Chen, C. Q. Zhou, Y. Zhao, L. W. Lherbier, J. G. Grindey, Proceedings of ASME 2012, Heat Transfer Conference, July 8-12, 2012 14. Y. He, Q. Liu, J. Yang, B. Yang, M. Long, H. Zheng, C. Liu, and M. Wei, Advanced Materials Research, Vol. 146-157, 2011, pp 1911-1916 15. G.Y. Wen, Y.Z. Yan, S.J. Zhao, J.J. Huang, G.H. Jiang and X.M. Yang, Iron and Steel, Vol. 31, No. 2, 1996, pp. 6-11.
AISTech 2012 Proceedings
469