The Impact of Paravirtualized Memory Hierarchy on Linear Algebra Computational Kernels and Software Lamia Youseff
Keith Seymour
Haihang You
Dept. of Computer Science, University of California, Santa Barbara.
Dept. of Electrical Engineering and Computer Science, University of Tennessee.
Dept. of Electrical Engineering and Computer Science, University of Tennessee.
[email protected]
[email protected] [email protected] Jack Dongarra Rich Wolski
Dept. of Electrical Engineering and Computer Science, University of Tennessee.
[email protected]
Dept. of Computer Science, University of California, Santa Barbara.
[email protected]
ABSTRACT
Keywords
Previous studies have revealed that paravirtualization imposes minimal performance overhead on High Performance Computing (HPC) workloads, while exposing numerous benefits for this field. In this study, we are investigating the memory hierarchy characteristics of paravirtualized systems and their impact on automatically-tuned software systems. We are presenting an accurate characterization of memory attributes using hardware counters and user-process accounting. For that, we examine the proficiency of AT LAS, a quintessential example of an autotuning software system, in tuning the BLAS library routines for paravirtualized systems. In addition, we examine the effects of paravirtualization on the performance boundary. Our results show that the combination of AT LAS and Xen paravirtualization delivers native execution performance and nearly identical memory hierarchy performance profiles. Our research thus exposes new benefits to memory-intensive applications arising from the ability to slim down the guest OS without influencing the system performance. In addition, our findings support a novel and very attractive deployment scenario for computational science and engineering codes on virtual clusters and computational clouds.
Virtual Machine Monitors, Paravirtualization, AutoTuning, BLAS, high performance, linear algebra, cloud computing
Categories and Subject Descriptors D.4.8 [Operating Systems]: Performance; C.4 [Performance of Systems]: Performance attributes
General Terms Measurement, Performance
Permission to make digital or hard copies of all or part of this work for personal or classroom use is granted without fee provided that copies are not made or distributed for profit or commercial advantage and that copies bear this notice and the full citation on the first page. To copy otherwise, to republish, to post on servers or to redistribute to lists, requires prior specific permission and/or a fee. HPDC’08, June 23-27, 2008, Boston, Massachusetts, USA. Copyright 2008 ACM 978-1-59593-997-5/08/06 ...$5.00.
1. INTRODUCTION Virtualization has historically offered numerous benefits for high performance computing. It was, however ignored in computationally intensive settings as a result of its potential for performance retardation. A recent approach to virtualization, dubbed paravirtualization has emerged as a possible alternative. Originally developed to help consolidate servers in commercial settings, this OS-based approach to virtualization has grown rapidly in popularity. To provide the greatest flexibility, portability, and instrumentation possibilities, it comprises both software and hardware techniques. Originally explored by Denali [25] and Xen [20] in 2003, this technique in which the guest and the host OSs are both strategically modified to provide optimized performance is used today in several virtualization systems. To this end, several studies [17, 26, 27] have measured the performance ramifications of running general HPC benchmarks on paravirtualized systems and they report near-native performance for different HPC workloads. At the same time, other studies have focused on the flexibility and functionality benefits of using modern virtualization techniques. For example, OS-level check-pointing [18], fault-tolerance and load balancing [8] are very attractive possibilities in HPC environments. In addition, other researchers [22, 19] have looked into dynamic adaptation of the guest OS for performance and application-customized guest OSs for scientific parallel codes [5, 14, 28]. Although previous studies of paravirtualization have addressed the general-case performance characteristics of HPC benchmarks, they lacked the investigation of the performance boundary and performance consequences under scarce memory conditions. This has a remarkable importance in HPC, because of the performance sensitivity of memoryintensive codes and autotuning Linear Algebra (LA) packages to the memory characteristics. In this vein, we provide a detailed study of the impact of the paravirtualized execution on LA codes that use autotuning software for portable performance. Autotuning has become an important technol-
ogy for “core” libraries that are performance-critical since these systems often require complex and otherwise laborintensive configuration to achieve maximal performance levels. Thus, our goals are two fold. First, we wish to understand how autotuning is affected by paravirtualization. For example, we wish to know whether the autotuning software can “sense” the presence of paravirtualization during the tuning process. Secondly we wish to explore the potential impact paravirtualization may have on highly tuned numerical software. While it may be that a vanilla installation is unaffected as has been shown in previous studies [27], in this work we investigate the effects of paravirtualization on the performance boundary. In particular, we study the efficacy of Automatically T uned Linear Algebra Software (AT LAS) in detecting system configurations for paravirtualized systems. We then use DGEMM matrix-matrix multiplication as a memory-intensive code to measure performance in Mflops for double precision arithmetic and compare the performance of several OS kernels with varying main memory allocations. With this in mind, we investigate the different attributes of the memory hierarchy of the paravirtualized system. The main contribution of this paper is an exposition of how paravirtualization (as implemented by Xen) impacts the performance of LA codes, particularly with respect to its use of the memory hierarchy. In addition, our findings complete along with our previous studies [27, 26], the investigation of the feasibility of utilizing clusters of virtual machines to execute scientific codes, without sacrificing performance. Our research, therefore advocates the huge potential of deploying scientific codes on virtual clusters and computing clouds. In turn, this presents new and very attractive deployment scenarios for computational sciences and engineering codes. The novel deployment scenarios are not the only appealing implication of our research, but the saving on the computing expenditure can be another very desirable advantage. As the cost of virtual clusters comprises a fraction of computing hardware acquisition and maintenance costs, our results have the potential to influence the total cost of the inquiry process in the computational sciences and engineering. The paper is structured as follows. We present a short survey on paravirtualization in the next section, as well as the terminology we will use. We detail our experimental settings in the following section. Section 4 presents the impact of paravirtualization on AT LAS system detection and the performance of the generated and hand-tuned routines. Next, Section 5 investigates the effect of the paravirtualization on the memory hierarchy of the system, by describing its impact on a memory intensive dense matrix-matrix multiplication performance and characterizing its RSS (Resident Set Size), swap and TLB activity. Finally, we discuss the implications of our work in Section 6 and present our conclusions in Section 7.
2.
BACKGROUND
Historically, virtualization has been a technique for providing secure and flexible hosting of user and system programs spanning several trust levels. In an Internet computing setting, this hosting capability has relied on language semantics (e.g. Java) to permit the importation of untrusted code for execution by a software virtual machine. While the approach has been successful, incompatibilities between the virtual machine mandated by the language and the typ-
A
p
p
l
i
c
a
t
i
o
n
s
A
A
p
p
l
i
c
a
t
i
o
n
p
p
l
i
c
a
G
u
u
O e
s
r
n
s
s
S
t
S
t
O
a
o
S
H
H
i
O e
G
O
t
s
d
w
a
r
e
o
s
S
(
X
t
e
H
a
r
d
w
n
a
V
r
M
M
)
e
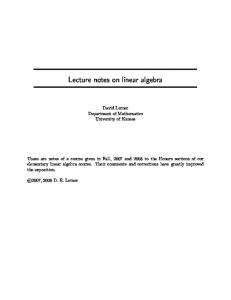
Figure 1: The two software stacks in our experimentation settings. (i) the stack on the left is the traditional (native) software stack. (ii) the stack on the right shows the virtualized software stack.
ical organization of actual computational resources (processors, memory, I/O subsystems, etc.) imposes a performance penalty on virtualized program execution. Many powerful and elegant optimization techniques have been developed to minimize this penalty, but at present language virtualized systems still do not achieve native execution speeds for numerically-intensive applications. A recent approach to virtualization, dubbed paravirtualization has emerged as a possible alternative. Paravirtualization is a software virtualization technique which allows the virtual machines to achieve near native performance. In paravirtualized systems, for example Xen [20], the system software stack is augmented, as illustrated in Figure 1. The stack on the left shows the traditional OS deployment stack, while the right stack portrays the paravirtualized deployment stack. In the latter, the hypervisor1 occupies a small part of the main memory, and acts as a moderator layer between the hardware and the guest OS kernels. On top of the hypervisor, two types of guest OSs are run. The first type is regarded as a privileged services guest OS, which provides OS services to the other less-privileged OS and has more direct access to memory, devices, and the hardware in general. There must be at least one privileged virtual machine per physical machine. The other kind of guest OS is a less privileged OS kernel, which uses paravirtualized device drivers and has moderated access to the hardware. The privileged guest OS is responsible for running virtualization software tools that manage, start, monitor and even migrate the other less-privileged domains. In order to measure the performance impact of paravirtualization on autotuning software, we used Automatically T uned Linear Algebra Software (AT LAS) [24, 9]. AT LAS focuses on applying empirical search techniques to provide highly tunable performance for linear algebra libraries. It empirically explores the search spaces for the values of the different parameters for Basic Linear Algebra Subprograms (BLAS) [15, 7, 10] and Linear Algebra P ackage (LAP ACK) [3] routines for matrix operations. Those kinds of matrix kernels are among the most widely studied and optimized routines in computational science due to their influence on the overall performance of many applications. Traditionally, developers either carefully optimized these algorithms by hand 1 The hypervisor is a small piece of software that runs directly on the hardware and acts as a slim layer between the guest OSs and the hardware. It is also referred to as virtual machine monitor (VMM). Accordingly, the OS kernels that run on the hypervisor are termed virtual machines, or guest OSs.
Routine GEmmNN GEmmNT GEmmTN GEmmTT GEmvN GEmvT GER
Operation C = αAB + βC C = αAB T + βC C = αAT B + βC C = αAT B T + βC y = αAx + βy y = αAT x + βy A = αxy T + A
Description General Dense non-transpose non-transpose Matrix-Matrix Multiplication General Dense non-transpose transpose Matrix-Matrix Multiplication General Dense transpose non-transpose Matrix-Matrix Multiplication General Dense transpose transpose Matrix-Matrix Multiplication General Vector-Matrix Multiplication General Vector-Matrix transpose Multiplication General Rank one update
Table 1: Mathematical notations for the routines in BLAS and LAP ACK libraries. or they relied on compiler optimizations to improve the performance. Hand-tuning requires a lot of expertise and quite a bit of effort from the developer. Even if the hand-tuning is successful, it is not often portable to other architectures, so the developer has to repeat the process multiple times to support a useful set of platforms. On the other hand, using compiler optimizations requires almost no effort from the developer, but may only give modest results, especially compared to the theoretical peak performance of the machine. Many compiler optimization techniques such as loop blocking, loop unrolling, loop permutation, fusion and distribution have been developed to transform programs written in high-level languages to run efficiently on modern architectures [1, 21]. Commonly referred to as model-driven optimization, most compilers select the optimization parameters such as block size, unrolling factor, and loop order with analytical models. The models may be based on real architectural attributes or other heuristics, but compilers are burdened with the task of handling a wide variety of code, so the built-in optimizers usually cannot compete with experienced hand-tuners. In contrast, empirical optimization techniques generate a large number of code variants for a particular algorithm (e.g. matrix multiplication) using different optimization parameter values or different code transformations. All these candidates run on the target machine and the one that gives the best performance is picked. Using this empirical optimization approach, projects like AT LAS, P HiP AC [6], OSKI [23], and F F T W [12] can successfully generate highly optimized libraries for dense and sparse linear algebra kernels and FFT respectively. This empirical approach has been recognized as an alternative approach to traditional compiler optimizations and machine specific hand-tuning of linear algebra libraries, since it normally generates faster libraries than the other approaches and can adapt to many different machine architectures. In a recent report from Berkeley on the future of parallel computing [4], software autotuners were regarded as a way to enable efficient optimizations and should become more adopted in translating parallel programs and code generation. Towards this end, we expect autotuners will be more embraced in the near future, and will run on virtualized machines such as the computing clouds. Hence, we are investigating in this paper the impact of paravirtualization on the operation of autotuners. With this in mind, we used the performance and the parameter values of the autotuned BLAS library as an indication of the efficiency of the autotuning process in paravirtualized environments. AT LAS is convenient to use for these experiments because of its widespread use for generating tuned LA libraries. In addition, the detected characteristics of the system can be easily examined in the log files
Parameter NB ma
la nb nu, mu and ku Xunroll and Y unroll
Description L1 Blocking factor. MULADD boolean flag to indicate whether the MULADD is done as one operation or not. latency between floating point operations. blocking factor used in each specific routine. Unrolling factors for M, N, K loops respectively. Unrolling factors for X, Y loops respectively.
Table 2: Description of the parameters used in tuning the BLAS routines.
and compared among the different OS kernel configurations. Also, since AT LAS typically achieves 75-90% of peak performance in the native configuration, it should give a good indication of whether the various OS kernel configurations are capable of high sustained floating point performance. Notice that AT LAS essentially performs a “parametersweep” search of the performance space so that it can identify the values of the specific parameters that yield the best performance (among those tested). The resulting library configuration typically achieves a better performance than a generic installation. Because applications running near peak machine speed can be more performance sensitive to effects introduced by their OS environment (e.g. OS noise), we wish to examine the degree to which paravirtualization interferes with an optimized installation. Notice also that the set of parameters identified by AT LAS are conveniently logged making it possible to use them to detect specific performance differences between native and paravirtualized execution. That is, by comparing AT LAS tuning logs for native and virtualized optimization, we should be able to identify immediately how paravirtualization is affecting the execution of optimized LAP ACK libraries. To help understand some of the parameters and the subroutine names mentioned in this paper, we will briefly describe the BLAS and LAP ACK naming convention (for full details, see [3]). Subroutines are named XYYZZ or XYYZZZ, where X indicates the data type (S for single precision, D for double precision, etc.), YY indicates the matrix type (GE for general, GB for banded, etc.), and the final ZZ or ZZZ indicates the computation performed (MM for matrix-matrix multiply, MV for matrix-vector multiply, etc.). Therefore, DGEMM would be a double-precision general matrix-matrix multiplication. In this matrix-matrix multiplication routine, an
3.
EXPERIMENTAL SETTINGS
We ran our experiments on a Pentium D dual-core machine, where each core is a 2.8-GHz Pentium with an 800MHz processor bus, 16KB of L1 cache and 1024KB L2 cache. The machine memory system uses a 533-MHz bus with 1 GB of dual interleaved DDR2 SDRAM memory. In order to find the performance ramifications of paravirtualization, we compare the performance of three types of OS kernels. Furthermore, we test two configurations that differ in the main memory size allocated at boot time for each OS kernel. The first kernel is a Fedora Core Linux 2.6.19 kernel, which we used as a base performance kernel, and henceforth referred to as “native”. For this kernel, the device drivers, applications and BLAS libraries run directly in the OS (without virtualization), which is the common software stack used nowadays in HPC clusters. On the other hand, the paravirtualized software stack is different, as we described in the previous section. We used Xen as our paravirtualizing software, with the hypervisor in the first 32MB of the main memory. Furthermore, in Xen terminology, the privileged guest OS is dubbed Dom0 (for Domain 0) while the less privileged guest OS is dubbed DomU (for Domain U nprivileged). We adopt this terminology for the rest of our paper. For each of the three OS kernels (native, Dom0, DomU), we test the performance with two main memory configurations: 256MB and 756MB. The reason for changing the total memory assigned to the systems was to test the performance of the system under limited memory conditions and to generate near-boundary memory cases for virtualized systems. We disabled the balloon driver2 in Xen domains in order to isolate the impact of the balloon driver on memory performance and to build a fair comparison between the different systems. In our experimentation, we used Linux kernel 2.6.16 as the guest OS for both dom0 and domU, patched with Xen 3.0.4. All the OS kernels were built with SMP support. We use AT LAS 3.7.35, the latest version available for autotuning the BLAS routines. We compare the performance achieved using the AT LAS-generated code (with and without SSE2 support). We also compare the performance achieved by the DGEMM routine for different matrix sizes. In addition, threading was enabled in all AT LAS builds to allow AT LAS to build parallel libraries.
4.
AUTOTUNING SOFTWARE SYSTEMS
AT LAS is one of the earliest autotuning software systems for performance optimization. We use AT LAS in our research as a quintessential example of an autotuner for processors with deep memory hierarchies and pipelined functional units. As we described in Section 2, AT LAS uses 2
The balloon driver in Xen allows the domains to grow and shrink dynamically in their total main memory allocation, according to their runtime memory workloads.
FPU Register to Register Performance 1000
800
Performance in Mflops
M × K matrix A multiplies a K × N matrix B, resulting in the M ×N matrix C. AT LAS finds the optimal value for the best blocking and loop unrolling factors for on-chip multiply using timings, i.e. it examines the search space by trying different values for blocking and loop unrolling. In Table 1, we outline the BLAS routines that AT LAS optimizes and in Table 2, brief descriptions of the different parameters for the routines are outlined.
600
400
200
0 Native 256MB
Native 756MB
Dom0 256MB
Dom0 756MB
DomU 256MB
DomU 756MB
Figure 2: Performance of the register-to-register FPU for double precision numbers; as detected by AT LAS for the OS kernels. an empirical search methodology to optimize the different routines for BLAS and LAP ACK. This search process is composed of three key phases. In the first phase, AT LAS focuses on detecting the system characteristics. Through a probe process, AT LAS collects information about cache size of the system, the floating point unit (FPU), the number of registers, and other architectural information. The second phase is concerned with determining the best values of parameters to be used in generating the BLAS and LAP ACK routines based on the detected system characteristics and the results of the empirical search. After tuning, AT LAS runs cache benchmarks to determine the optimal value for CacheEdge, which represents the value of the cache size for blocking the matrix matrix multiplication routines. Finally, AT LAS uses all the information it gathered to generate the optimized BLAS library. In the next three subsections, we detail the performance of AT LAS in each of the three phases respectively. For those results, we found that the precision of the multiplication (i.e. single versus double) does not impact the difference in performance between the OS kernels. Therefore, we only detail the double precision performance results.
4.1 System Characteristics Detection In order for AT LAS to autotune the BLAS libraries, it starts its operation by probing the system characteristics. Table 3 shows the output of AT LAS for each of these parameters. The first row shows that AT LAS detected L1 cache to be of size 16KB for all the OS kernels. The second row illustrates the number of registers detected in each of the systems, for which AT LAS detected 7 registers for all three OS kernels. The length of the floating point pipeline (in cycles) is presented in the third row, while the number of FPU registers is presented in the fourth row. Furthermore, Figure 2 shows the floating point unit (FPU) register-to-register performance (i.e., with no memory latency) as measured by AT LAS. For each of these performance numbers, we present an average of 20 runs with error bars reflecting the margin of error for a 95% confidence level of the mean. In this figure, the Y -axis represents the performance in Mflops. Therefore, we concluded from the
Parameter L1 Cache Size Sys Info nreg FPU: Pipeline cycle FPU: Registers num.
Native SMP 256MB 756MB 16KB 16KB 7 7 6 6 15 15
Dom0 SMP 256MB 756MB 16KB 16KB 7 7 6 6 15 15
DomU SMP 255MB 756MB 16KB 16KB 7 7 6 6 15 15
Table 3: System characterization as detected by AT LAS for the OS kernels. measurements that there is no significant performance difference between the OS kernels for FPU operation. Overall, we concluded from these results that the paravirtualization does not alter the system characterization, nor does it impose any performance overhead in register-to-register performance for floating point operations.
Tuning the CacheEdge (i.e., cache blocking parameter) can help increase performance and reduce the memory usage of BLAS routines. In this phase, AT LAS attempts to determine the optimal cache size for blocking the matrixmatrix multiplication routines. It first tests the blocking performance using only L1 cache, then uses different values of L2 cache. We compared the performance achieved by each OS kernel for L1 cache and each value of L2 blocking. Figure 3 depicts the performance in Mflops of a double precision matrix-matrix multiplication of dimension 2500 using only L1 cache blocking, while Figure 4 represents the performance of using L2 blocking. All the numbers reported here are the average of 20 runs. For the latter figure, the xaxis represents the size of L2 cache in KB used in blocking, while the y-axis represents the corresponding performance. The error bars reflect the margin of error for 95% confidence level. Note that we extended the AT LAS subprogram which does the CacheEdge measurements to evaluate the performance beyond the physical L2 cache size in order to monitor any difference. However, no performance difference was detected between the native and paravirtualized kernels. Figure 5 shows a histogram of the final CacheEdge selected by AT LAS for the 20 runs, after disregarding the runs where AT LAS chose only L1 blocking. The reason AT LAS does not choose the same CacheEdge size for L2 blocking every time is that the code is sensitive to the slight performance difference for cache sizes between 512KB and 2048KB. Therefore, a small variability in the performance impacts the chosen CacheEdge but does not impact the overall performance as Figures 3 and 4 show. That is, a small difference in performance will cause AT LAS to choose a different power of 2 for the cache block size (a relatively large change). The histogram in Figure 5 reflects the variation of cache-block size which AT LAS selected over different runs, but Figures 3 and 4 show that this variation does not ultimately affect the overall performance (note the small error bars in the figures). In addition, Table 4 outlines the median values of the CacheEdge selected. The reason we chose to report the median rather than the mean is that AT LAS chooses among different categorical values of L2, i.e., the median was more representative of the optimal CacheEdge’s choice. From Table 4 and Figure 5, we gather that the selection of the optimal CacheEdge performance is similar for all the OS kernels.
4000
Performance in Mflops
4.2 Cache Blocking Size Configuration
Cache Edge Performance using L1 Cache blocking 5000
3000
2000
1000
0 Native.256M
Native.756M
Dom0.256M
Dom0.756M
DomU.256M
DomU.756M
Figure 3: Performance of the 2500d matrix-matrix multiplication for L1 cache blocking. OS Kernels Native 256MB Native 756MB Dom0 256MB Dom0 756MB DomU 256MB DomU 756MB
Selected CacheEdge 1024KB 1536KB 1152KB 1536KB 1536KB 1024KB
Table 4: Median of the CacheEdge selected by AT LAS for the OS kernels. This shows that AT LAS finds minimal or no difference between the different OS kernels in choosing their optimal L2 blocking size.
4.3 Routines Generation and Tuning In order for AT LAS to obtain the best performance from the system, it runs different routines and measures their performance to choose the most efficient optimization for the BLAS library customization. Some of the computational kernels that come with AT LAS are hand-written assembly routines, while others are autogenerated based on the output of the system probe phase. In many cases and especially for the popular architectures, the hand-written computational kernels perform much better than the generated routines, since the former kernels make use of specific special architectural features that AT LAS code generator does not currently support. In this section, we compare the performance of the AT LAS generated codes and the hand-written codes for the different OS kernels.
Routine Cache Edge measurements for different L2 Cache blocking values 5000
GEmmNN & GEmmNT & GEmmTN & GEmmTT
Performance in Mflops
4000
3000
GEMVN 2000
GEMVT 1000
GER
Native 256MB Native 756MB Dom0 256MB Dom0 756MB DomU 256MB DomU 756MB
0 32
64
128
256
512 1024 2048 L2 Cache Edge size in KB
4096
8192
16384
Figure 4: Performance of the 2500d matrix-matrix multiplication for L2 cache blocking.
Histogram of the Cache Edge elected by ATLAS 10 Native 256MB Native 756MB Dom0 256MB Dom0 756MB DomU 256MB DomU 756MB
8
Frequency
6
4
2
0 16
32
64
128
256
512
1024
2048
4096
8192
16384
Cache Edge value in KB
Figure 5: Histogram of the CacheEdge selected by AT LAS.
Performance of the handtuned SSE2 code versus the automatically generated code 6000 Native 256MB Native 756MB Dom0 256MB Dom0 756MB DomU 256MB DomU 756MB
Performance in Mflops
5000
4000
3000
2000
1000
0 dSSE2_code
dGenerated_code
Figure 6: Performance in Mflops of double precision matrix-matrix multiplication for the OS kernels, using the handwritten, and autogenerated routines.
Parameter NB ma lat nb mu nu ku Xunroll Yunroll Xunroll Yunroll mu nu
Value 36 1 6 48 6 1 48 32 4 2 16 16 1
Table 5: AT LAS automatically chose the same values for each tuning parameter, irrespective of the underlying OS kernel or its main memory allocation.
We found that, for all the routines, AT LAS selected the handwritten versions as they performed about 4X faster than the generated code for single precision and 2X faster for double precision. Figure 6 shows the performance achieved by the handwritten routines in comparison to the performance of the generated routines for the different OS kernels for double precision. The reason behind the better performance of the hand-written code is its use of the SSE2 assembly instructions, which run on the SSE2 unit in the Pentium CPUs. SSE is an extension to the streaming SIMD (single instruction, multiple data), which is a recent addition to the Pentium processors to support floating point operations and is backed with an extra set of instructions for SIMD on x86. The handwritten code, which includes the SSE2 (i.e., second version of SSE) assembly instructions, made use of this extra processing power. SSE2 allows the processor to perform two and four times the number of floating point operations per cycle in double precision and single precision, respectively. In order to understand the difference in the performance of the autogenerated codes, we examined the values of the parameters used by AT LAS to generate the distinct routines, as well as the performance of these routines. For completeness, Table 5 illustrates the values for the different parameters that AT LAS selected to optimize the computational routines. Each of these factors is optimized for each of the computational routines (shown in the first column in the table) in BLAS and LAP ACK libraries. The routine names are described in Section 2, and the average performance over 20 runs is shown in Figure 7. After AT LAS has picked the optimal values for the tuning parameters, it generates the computational routines for the BLAS libraries using those values. We investigated the performance of the generated routines using the tuned parameters. Figure 7 represents the performance of the generated routines for the different kernels, in double precision. In this figure, the Y -axis represents the performance in Mflops. We noticed again that there was no significant difference in the values of the tuned parameters or the performance of the autogenerated routines between the different OS kernels. In conclusion, we detected no difference between AT LAS system detection, and auto-tuning between the native and paravirtualized OS kernels.
Performance of the BLAS Double Precision Routines Native 256MB Native 756MB Dom0 256MB Dom0 756MB DomU 256MB DomU 756MB
2500
Performance in Mflops
2000
1500
1000
500
0 dmmNN
dmmNT
dmmTN
dmmTT
dgemvN
dgemvT
dger
Figure 7: Performance of the AT LAS-generated BLAS routines based on the tuned parameters for double precision.
5.
MEMORY INTENSIVE APPLICATIONS
In the second set of experiments, we are investigating the impact of paravirtualization on the different levels of the memory hierarchy. Towards this end, we explore the paravirtualized memory hierarchy behavior using a memoryintensive application. For that, we use double-precision matrix matrix multiplication code that uses the BLAS level-3 libraries as a driver code for our experiments. This driver code is characterized by a growing memory consumption of up to 350 MB. We describe our DGEMM driver code in the next subsection, and the memory hierarchy performance in the subsequent subsections.
5.1 DGEMM Driver Description and Performance Among the other BLAS library routines, AT LAS tunes the DGEMM routine to efficiently execute double precision matrix-matrix multiplication at optimal performance. We generated a driver code that uses the AT LAS-optimized DGEMM routine for square matrix sizes ranging from 100 to 4000 and we recorded the time and performance in Mflops attained for each matrix size. The general pseudocode of the driver is outlined below. for Dimension 100 to 4000, step 100 for runs 1 to n, step 1 malloc matrices A, B, C; randomize values in A, B, C; t1 = time; call dgemm (A, B, C, alpha, beta); t = time - t1 ; free A, B, C; calculate the MFLOPS of runs; For each matrix dimension, we rerun the same driver code at least 5 times. In addition, we ensured that the OS kernel is not penalizing our driver code because of its increasing
memory or computational requirements, by forking a different process for each run for each matrix dimension. As outlined in the DGEMM driver pseudocode, the driver code creates 3 matrices, and fills them with random numbers, causing the page table entries for this newly allocated memory to be populated and avoiding having Linux use the lazy memory allocation scheme 3 . We measure the time needed by the DGEMM code to calculate the multiplication output, and free the allocated memory afterward. Therefore, the memory requirement by the driver code process for a specific matrix dimension x is 3x2 . Consequently, the datasection memory requirement of the driver code ranges from 237KB to 366MB for matrix dimension from 100 to 4000, respectively. We show the results of our experiments in Figure 8, which consists of 6 subfigures, one for each of the OS kernel configurations. The upper row of subfigures represents the performance curves of the native, Dom0 and DomU kernels with main memory configuration of 256MB, while the lower row of subfigures represents the performance curves of the same kernels, but with 756MB main memory configuration. Each of the six subfigures plots the performance in Mflops on the y-axis as a function of the matrix dimension on the X-axis. The curves show the average Mflops attained by the driver code at each matrix dimension, while the error bars demonstrate the minimum and the maximum Mflops attainable in the driver through the execution of several runs of the driver code. For all kernel configurations in the 6 subfigures, the performance increases until it exceeds 4 Gflops at matrix dimension of 700, which corresponds to having DGEMM driver process memory size of 11.21 MB. The reason behind the increasing Mflops between matrix dimensions of 100 to 700 is the resolution of the timing. The total execution time of 3
Recent Linux kernels use an optimization scheme dubbed lazy-malloc, which delays the actual allocation of the memory requested by the process until its actual use.
Dgemm Driver code Performance on Dom0 256MB
4000
4000
4000
3000
2000
Performance in Mflops
5000
1000
3000
2000
1000
0 500
1000
1500
2000 2500 Matrix Dimension
3000
3500
4000
3000
2000
1000
0 0
0 0
500
Dgemm Driver code Performance on Native 756MB
1000
1500
2000 2500 Matrix Dimension
3000
3500
4000
0
4000
4000
4000
2000
1000
Performance in Mflops
5000
3000
3000
2000
1000
0 1000
1500
2000 2500 Matrix Dimension
3000
3500
4000
1500
2000 2500 Matrix Dimension
3000
3500
4000
3500
4000
3000
2000
1000
0 500
1000
Dgemm Driver code Performance on DomU 756MB
5000
0
500
Dgemm Driver code Performance on Dom0 756MB
5000
Performance in Mflops
Performance in Mflops
Dgemm Driver code Performance on DomU 256MB
5000
Performance in Mflops
Performance in Mflops
Dgemm Driver code Performance on Native 256MB 5000
0 0
500
1000
1500
2000 2500 Matrix Dimension
3000
3500
4000
0
500
1000
1500
2000 2500 Matrix Dimension
3000
Figure 8: The performance in Mflops for the DGEMM driver code as a function of the matrix dimensions. The upper row of figures portrays the performance for the kernels with 256MB memory, while the lower row of figures represents the performance for the kernels with 756 MB. the DGEMM process is short for small size matrices, which takes less than 0.25 seconds, and therefore the problem size is not large enough to achieve the peak Mflops of the machine. Nevertheless, the growing curve was similar for all of the OS kernel configurations up to matrix dimension 700, whether their total main memory was 256MB or 756MB. The performance of the driver code, afterward stabilizes up to dimension of 3100 for all kernels equally. Although the main memory size did not impact the Mflops achieved by the DGEMM driver code up to matrix dimension of 3100, its impact was clearly encountered by larger matrices running on limited main-memory OS kernels. For the three OS kernels with the main memory allocation of 756MB (lower row of figures), the performance attainable by the driver code stabilized for matrix dimensions larger than 800. On the other hand, the three other OS kernels with main-memory allocation of 256MB experienced performance degradation when the DGEMM driver memory requirement exceeded a certain threshold. This threshold was the matrix dimension of 3100 for all of the kernels, which corresponds to the matrices memory size of 219MB. The cause of this performance degradation is the memory swapping of the driver memory, as we show in the next subsection. Because the total main memory is limited to 256MB in these three OS configurations, the OS kernel starts to swap out the DGEMM driver data as its size increases, and as physical memory becomes constrained. The OS kernels with 756MB do not experience the same performance degradation, since their main memory allocations are much larger than the DGEMM memory consumption. In order to thoroughly understand the memory consumption in each OS kernel configuration and its impact on the DGEMM driver process, we had to study it in the context of other entities using the memory, including the data and code sections of the OS kernels.
5.2 Kernel Memory and DGEMM Resident Set Size The first portion of memory we investigated was the kernel memory. Figure 9 is a stack bar graph of the kernel memory components and how much space they occupy in the physical RAM. The kernel memory is consumed by two main components: the kernel code, and the kernel data. DomU has the smallest kernel code size of the three OS kernels, which is a byproduct of the exclusion of all the hardware driver codes from the unprivileged domain. Xen has implemented a split driver architecture, where it splits the driver interface into two separate portions with a well-defined API between them. Dom0 contains all of the physical drivers to the hardware, as well as the back-end of the split driver codes, while domUs contain only the front-end drivers, which are much smaller in code size, and much simpler in interfaces. As a result of this split design, DomU has the smallest kernel code size, while Dom0 has the largest. The second component of the kernel memory is the kernel data, which is the amount of memory statically reserved for the kernel data structures. For the native kernel and Dom0, they both have almost the same size of data in memory (1.05MB), while the DomU kernel has half much this data memory (0.52MB). The reason behind that is also the split structure architecture. Since the interface between the backend and front-end drivers is simpler, DomU is keeping much simpler data structures for the physical drivers’ interface, which in turn minimized the amount of memory needed for the kernel data. Given the amount of memory allocated to the kernel space, the rest of the memory is available to the user processes, including our DGEMM driver code. Since we run our DGEMM driver at run-level one to avoid any unnecessary noise in the system, the only active processes at any one time were the DGEMM driver, the init process, the udev daemon and
OS Kernel Memory Consumption
Resident Set Size of the Dgemm Driver Code
8
400000 kernel data kernel code 350000
6
300000 Resident Set size in Kilobytes
7
Memory in MB
5
4
3
Native 256MB Native 756MB Dom0 256MB Dom0 756MB DomU 256MB DomU 756MB
Native, Dom0 and DomU 756MB OS-kernels
250000
200000
Native, Dom0 and DomU 256MB OS-kernels
150000
100000
2
50000
1
0 0
0 Dom0.256M Dom0.756M
500
1000
1500
DomU.256M DomU.756M
Figure 9: Memory consumption of the OS kernels with different memory configurations. the shell. The udev daemon is a user daemon to serialize the events for device handling, and consumes 868KB of the physical memory. init is the parent process of all user processes in the system, and consumes 648KB of the physical memory. The shell consumes 1420KB of the physical memory. Therefore, as the init process, udevd and shell consumes collectively 2.8MB, the rest of the memory is available for our DGEMM driver code to use. To monitor the memory consumption of the DGEMM driver in physical memory, we tracked its Resident Set Size (RSS). The RSS reflects the number of pages the process has in real memory, minus 3 pages for administrative purposes. RSS only includes the pages that count towards text, data, or stack space of the process. This does not include pages that have not been demand-loaded in, or which are swapped out. The RSS growth of the DGEMM driver code is shown in Figure 10. In this figure, the Y -axis represents the resident set size in KB as a function of the matrix size on the X-axis for different OS kernels. From this figure, we were able to characterize the memory pressure the DGEMM driver code is placing on the different OS kernels. The three 756MB kernels have a growing RSS as the driver memory demand grows. On the other hand, the RSS growth of the 256MB kernels ceases at matrix dimension 3100, both for the native kernel and the paravirtualized kernels. This effect is caused by the limited main memory allocated to the kernels, in which case the OS kernel would start swapping out portions of the process address space in order to keep a minimal amount of memory space available for the other processes as well as the kernel.
5.3 Swap Disk Activity In addition to the RSS, we investigated the swap disk activity in order to characterize its impact on the attainable performance. Towards this end, we monitored the swap disk activity and recorded the number of major and minor faults for each process in order to depict the MMU activity and the memory replacement policy between the native system and the paravirtualized system policies. As Figure 10 has shown, the amount of physical memory for the matrix data is limited for the OS kernels with 256MB memory allocation, thus the OS kernel would start swapping
2000 2500 Matrix Dimension
3000
3500
4000
Figure 10: The number of pages the DGEMM driver has in real memory. Swap Disk Activity for Each OS Kernel 400000 Native 256MB Native 756MB Dom0 256MB Dom0 756MB DomU 256MB DomU 756MB
350000 Total number of swapped bytes in system
Native.256M Native.756M
300000
Native, Dom0 and DomU 256MB OS-kernels
250000
200000
150000
100000 Native, Dom0 and DomU 756MB OS-kernels
50000
0 0
500
1000
1500
2000
2500
3000
3500
4000
Matrix Dimension
Figure 11: The swap disk activity shown as the number of swapped bytes.
out portion of the process address space. We monitored the swap disk activity using the Linux f ree command, which is portrayed by Figure 11. It is important to note that the swap disk activity here is reflecting all kernel swap activity and not just the DGEMM driver code alone. For the three 756MB OS kernels, there was no swap activity. This is expected since the 756MB kernels had extended memory and have no need to swap the driver process out of memory. On the other hand, the 256MB kernels have a different swapping activity, where they start swapping at matrix dimension of 3100 as illustrated in Figure 11. Naturally, this is explained by the limited memory size allocated for those OS kernels. Therefore, Figure 10 and 11 confirms that the performance drop in the DGEMM driver code for 256MB kernels was caused by the swapping activity of the kernels. In addition, we evaluated the MMU policy replacement for the kernels by studying the number of the major and minor faults as a function of the matrix dimension. Figure 12 depicts the number of major page faults (on the Y -axis) as a function of the matrix dimension (on the X-axis). Notice that each page is 4096 bytes. We observe that all the 256MB
kernels start swapping the DGEMM process address space at matrix dimension 3100. Likewise, measuring the minor page faults can illustrate the behavior of the MMU and the replacement policy. A minor fault is a page that was marked for eviction by the replacement policy, but which was used by the user process before it was actually evicted. Figure 13 reflects the number of minor page faults in the system as a function of the matrix dimension. Again, there was no significant difference in the behavior of all the 756MB kernels. There was no significant difference between the behavior of all the 256MB kernels. However, we noticed a difference in the number of minor page faults between the 256MB kernels and the 756MB kernels. For the 256MB kernels, the replacement policy is more aggressive in evicting pages from the main memory due to the memory pressure of the DGEMM process as the memory becomes more scarce in the system. Therefore, we noticed that the number of minor faults for the three 256MB kernels increased tremendously as the DGEMM driver grew beyond matrix dimension of 3100, as a result of memory scarcity. Yet, there was no significant difference between the native and paravirtualized kernels in their MMU behavior, both in the scarcity and abundance of memory.
5.4 TLB Activity and Performance The final level in the memory hierarchy that we investigated was the T ranslation Lookaside Buffer (TLB). We present the TLB performance for the various OS kernels under different memory configurations in this subsection. We used Oprofile [16], which is a low-overhead system-wide profiler that uses hardware counters to collect system statistics. Although there are several other similar profilers, Oprofile is the only profiler ported to Xen to profile the hypervisor, Dom0 and DomU. We measured two hardware events: the instruction TLB misses (ITLB), and the data TLB misses(DTLB). The data collected from the DGEMM driver is shown in Figures 14 and 15. The TLB size on the Pentium machines, which is the architecture we used in our experiments, is 64 entries for data TLB and 32 entries for instruction TLB. Given our memory intensive DGEMM driver, the rate of growth of the data is much faster than the size of the data TLB. This leads to having the number of DTLB misses to grow as the DGEMM process size grows, and the DTLB curve to follow a 3x2 , the same function for data growth for the DGEMM driver data. Interestingly, There was no significant difference between the OS kernels based on their main memory allocation. In contrast with DTLB number of misses, the ITLB misses for DGEMM driver code is minimal as shown in Figure 15, which is due to the small size of code section of the DGEMM driver. However, we noticed that ITLB misses started to increase at matrix dimension 3100 for the OS kernels with 256MB. The ITLB misses start going up at the same time the swapping activity starts going up. We believe the extra swapping has resulted in more context switches between user code and system code and thus more instruction TLB entries expired, which in turn affected the measured ITLB activity for 256MB OS kernels. However, there was no difference in their TLB activity between the native and paravirtualized kernels with the same memory allocation.
6.
DISCUSSION We have, in this paper measured and analyzed the paravir-
tualization impact on autotuned LA routines as configured by AT LAS. In particular, we have focused on the different levels of the memory hierarchy and compared the memory characteristics between the native non-paravirtualized OS kernel and the paravirtualized kernels since paravirtualization affects the way in which virtual memory is manipulated. Our results show that there is no significant difference in performance between native execution and paravirtualized execution even when AT LAS tunes the performance of the libraries to near peak speeds. These results are quite remarkable since paravirtualization could easily impact virtual memory system activity (e.g. TLB miss rate) by introducing another level of process scheduling and I/O indirection. Further, one might expect these effects to manifest near the performance boundary of high-tuned numerical programs. However, as the major workload of the computational code uses non-privileged instructions that run at the native speed of the processor, it does not impact the overall tuning of the ATLAS routines. Although under heavy memory usage, the Xen hypervisor is frequently invoked to trap every page-table update, this overhead did not invest itself in the overall attainable performance by the DGEMM code. Our results also demonstrated that the paravirtualization did not affect the processor characteristics detected by AT LAS. The kinds of characteristics that need to be detected will depend on the particular application being tuned. In the case of dense linear algebra, some of the important characteristics are cache size, number of registers, functional unit latencies, memory latency, etc. In some sense, the exact value of a certain characteristic is not as important as its effect on the performance of the generated code. For example, while it is useful to know that a processor has a cache size of 256KB, the tuning system really wants to know how much data it can typically fit in a matrix block before incurring too many cache misses. Thus, the detected values can be viewed as good starting points or bounds for exploration of the search space, but not sufficient by themselves to generate the best code. Having the hardware detection coupled with an empirical parameter search allows the system to cope with any inaccuracies in the detection of the characteristics. Therefore, our results show that the combination of AT LAS autotuning and Xen paravirtualization deliver native execution performance and nearly identical memory hierarchy performance profiles. Given that the host OS does not necessarily require a fully dedicated core, linear algebra software can take full advantage of the computational power of the physical hardware without being penalized for running in a paravirtualized environment. Furthermore, some previous results from our research and others confirmed that paravirtualization did not impact MPI communications performance over popular network infrastructure, like Ethernet and Infiniband. This, in turn allows linear algebra routines to efficiently run in distributed virtual environments. Our results expose a new potential benefit of paravirtualization for numerically and memory intensive applications. Having the performance of the DGEMM driver code dependent on the amount of memory available at user space, slimming and customization of the OS kernel to run as a virtual machine can possibly deliver better performance than native kernels, as a slimmed down kernel can be tuned to allow the user space process to have more memory than running on a native system (which is configured to run a full workload).
Total Number of Major Faults in each OS Kernel
Total Number of Minor Faults in each OS Kernel
250000
250000 Native 256MB Native 756MB Dom0 256MB Dom0 756MB DomU 256MB DomU 756MB
200000 Total number of minor faults by page
Total number of major faults by page
200000
Native 256MB Native 756MB Dom0 256MB Dom0 756MB DomU 256MB DomU 756MB
150000
100000
Native, Dom0 and DomU 256MB OS-kernels
50000
Native, Dom0 and DomU 256MB OS-kernels
150000
100000
Native, Dom0 and DomU 756MB OS-kernels
50000
0
0 0
500
1000
1500
2000 2500 Matrix Dimension
3000
3500
4000
Figure 12: The number of major faults caused by the DGEMM driver code.
0
500
1000
2000 2500 Matrix Dimension
3000
3500
4000
Figure 13: The number of minor faults caused by the DGEMM driver code.
DTLB misses for the Dgemm Driver code
ITLB misses for the Dgemm Driver code
5000
5000 Native 256MB Native 756MB Dom0 256MB Dom0 756MB DomU 256MB DomU 756MB
4000
Number of samples collected for ITLB misses
Number of samples collected for DTLB misses
1500
3000
2000
1000
0
Native 256MB Native 756MB Dom0 256MB Dom0 756MB DomU 256MB DomU 756MB
4000
3000
2000
1000
0 0
500
1000
1500
2000 2500 Matrix Dimension
3000
3500
4000
Figure 14: The number of Data TLB misses as measured by Oprofile.
0
500
1000
1500
2000 2500 Matrix Dimension
3000
3500
4000
Figure 15: The number of Instr TLB misses as measured by Oprofile.
In addition, our results support the feasibility of deploying linear algebra systems and memory intensive applications on virtualized systems. Consequently, this would support the practicality of utilizing virtual clusters [11] and cloud computing as a computing environment for those applications. For example, in Amazon’s Elastic Cloud (EC2) [2] and IBM’s Blue Cloud [13], the hosted kernels are specifically configured for numerical execution.
impact on the performance of memory-intensive applications, even when memory becomes a scarce resource. Paravirtualization, furthermore, does not alter the system image and does not affect the ability of empirically tuned codes to produce peak performance for linear algebra software. Given the rise of the new paradigm of cloud computing, paravirtualization exposes new deployment scenarios for linear algebra computational kernels and software.
7.
8. REFERENCES
CONCLUSIONS
In this paper, we presented a comprehensive evaluation of the memory hierarchy characteristics of the paravirtualized kernels. We presented experimentation to show the impact of paravirtualization on empirically autotuned codes for linear algebra software. We also studied the performance of a memory-intensive application and its influence on the paravirtualized kernel under memory pressure. We presented the performance difference between the native and paravirtualized kernels with similar main-memory allocation. Our results illustrate that paravirtualization has no significant
[1] R. Allen and K. Kennedy. Optimizing Compilers for Modern Architectures. Morgan Kaufmann Publishers, 2002. [2] Amazon. Amazon Elastic Compute Cloud (EC2). http://aws.amazon.com/ec2, 2007. [3] E. Anderson, Z. Bai, C. Bischof, S. Blackford, J. Demmel, J. Dongarra, J. Du Croz, A. Greenbaum, S. Hammarling, A. McKenney, and D. Sorensen. LAPACK Users’ Guide. Society for Industrial and Applied Mathematics, Philadelphia, PA, third edition,
1999. [4] K. Asanovic, R. Bodik, B. C. Catanzaro, J. J. Gebis, P. Husbands, K. Keutzer, D. A. Patterson, W. L. Plishker, J. Shalf, S. W. Williams, and K. A. Yelick. The Landscape of Parallel Computing Research: A View from Berkeley. Technical Report UCB/EECS-2006-183, EECS Department, University of California, Berkeley, Dec 2006. [5] G. Back and D. S. Nikolopoulos. Application-Specific Customization on Many-Core Platforms: The VT-ASOS Framework. In Proceedings of the Second Workshop on Software and Tools for Multi-Core Systems, March 2007. [6] J. Bilmes, K. Asanovic, C.-W. Chin, and J. Demmel. Optimizing Matrix Multiply Using PHiPAC: A Portable, High-Performance, ANSI C Coding Methodology. In International Conference on Supercomputing, pages 340–347, 1997. [7] L. S. Blackford, J. Demmel, J. Dongarra, I. Duff, S. Hammarling, G. Henry, M. Heroux, L. Kaufman, A. Lumsdaine, A. Petitet, R. Pozo, K. Remington, and R. C. Whaley. An Updated Set of Basic Linear Algebra Subprograms (BLAS). ACM Transactions on Mathematical Software, 28(2):135–151, June 2002. [8] C. Clark, K. Fraser, S. Hand, J. G. Hansen, E. Jul, C. Limpach, I. Pratt, and A. Warfield. Live Migration of Virtual Machines. In USENIX Symposium on Networked Systems Design and Implementation (NSDI ’05), Boston, MA, USA, May 2005. [9] J. Demmel, J. Dongarra, V. Eijkhout, E. Fuentes, A. Petitet, R. Vuduc, C. Whaley, and K. Yelick. Self Adapting Linear Algebra Algorithms and Software. Proceedings of the IEEE, 93(2), 2005. Special Issue on “Program Generation, Optimization, and Adaptation”. [10] J. J. Dongarra, J. D. Croz, S. Hammarling, and R. J. Hanson. An Extended Set of FORTRAN Basic Linear Algebra Subprograms. ACM Transactions on Mathematical Software, 14(1):1–17, Mar. 1988. [11] I. Foster, T. Freeman, K. Keahy, D. Scheftner, B. Sotomayer, and X. Zhang. Virtual clusters for grid communities. In CCGRID ’06: Proceedings of the Sixth IEEE International Symposium on Cluster Computing and the Grid (CCGRID’06), pages 513–520, Washington, DC, USA, 2006. IEEE Computer Society. [12] M. Frigo and S. G. Johnson. FFTW: An Adaptive Software Architecture for the FFT. In Proc. 1998 IEEE Intl. Conf. Acoustics Speech and Signal Processing, volume 3, pages 1381–1384. IEEE, 1998. [13] IBM. IBM Blue Cloud. http://www03.ibm.com/press/us/en/pressrelease/22613.wss, Nov. 2007. [14] C. Krintz and R. Wolski. Using Phase Behavior in Scientific Application to Guide Linux Operating System Customization. In Workshop on Next Generation Software at IEEE International Parallel and Distributed Processing Symposium (IPDPS), April 2005. [15] C. L. Lawson, R. J. Hanson, D. R. Kincaid, and F. T. Krogh. Basic Linear Algebra Subprograms for Fortran usage. ACM Transactions on Mathematical Software, 5(3):308–323, Sept. 1979.
[16] J. Levon. Oprofile - a system profiler for linux. http://oprofile.sourceforge.net/, 2004. [17] M. F. Mergen, V. Uhlig, O. Krieger, and J. Xenidis. Virtualization for High-Performance Computing. SIGOPS Oper. Syst. Rev., 40(2):8–11, April 2006. [18] A. B. Nagarajan, F. Mueller, C. Engelmann, and S. L. Scott. Proactive Fault Tolerance for HPC with Xen Virtualization. In ICS ’07: Proceedings of the 21st Annual International Conference on Supercomputing, pages 23–32, New York, NY, USA, 2007. ACM. [19] T. Naughton, G. Vallee, and S. Scott. Dynamic Adaptation using Xen. In First Workshop on System-level Virtualization for High Performance Computing (HPCVirt 2007), Mar 2007. [20] P. Barham and B. Dragovic and K. Fraser and S. Hand and T. Harris and A. Ho and R. Neugebauer. Virtual Machine Monitors: Xen and the Art of Virtualization. In Symposium on Operating Systems Principles (SOSP), 2003. [21] D. A. Padua and M. Wolfe. Advanced Compiler Optimizations for Supercomputers. Commun. ACM, 29(12):1184–1201, 1986. [22] P. Ruth, J. Rhee, D. Xu, R. Kennell, and S. Goasguen. Autonomic Live Adaptation of Virtual Computational Environments in a Multi-Domain Infrastructure. In Autonomic Computing, 2006. ICAC ’06. IEEE International Conference on, pages 5–14, 2006. [23] R. Vuduc, J. Demmel, and K. Yelick. OSKI: A Library of Automatically Tuned Sparse Matrix Kernels. In Proc. SciDAC 2005, Journal of Physics: Conference Series, volume 16, San Francisco, CA, June 2005. [24] R. C. Whaley, A. Petitet, and J. Dongarra. Automated Empirical Optimizations of Software and the ATLAS Project. Parallel Computing, 27(1-2):3–35, January 2001. [25] A. Whitaker, M. Shaw, and S. Gribble. Scale and Performance in the Denali Isolation Kernel. In Symposium on Operating Systems Design and Implementation (OSDI), 2002. [26] L. Youseff, R. Wolski, B. Gorda, and C. Krintz. Evaluating the Performance Impact of Xen on MPI and Process Execution For HPC Systems. In VTDC ’06: Proceedings of the 2nd International Workshop on Virtualization Technology in Distributed Computing, 2006. [27] L. Youseff, R. Wolski, B. Gorda, and C. Krintz. Paravirtualization for HPC Systems. In G. Min, B. D. Martino, L. T. Yang, M. Guo, and G. R¨ unger, editors, ISPA Workshops, volume 4331 of Lecture Notes in Computer Science, pages 474–486. Springer, 2006. [28] L. Youseff, R. Wolski, and C. Krintz. Linux Kernel Specialization for Scientific Application Performance. Technical Report UCSB Technical Report 2005-29, Univ. of California, Santa Barbara, Nov 2005.