Proceedings of the 11th WSEAS International Conference on COMPUTERS, Agios Nikolaos, Crete Island, Greece, July 26-28, 2007
158
The implementation of a relationship database in hidrology. HYDROweb application. EMIL MARIN POPA, MIHAI VODA, CALIN AVRAM, ALINA ELENA PITIC, CRISTINA ELENA RAULEA Faculty of Science “Lucian Blaga” University of Sibiu 5-7 Ratiu Street, Sibiu “Dimitrie Cantemir” University of Targu Mures 3-5 Bodoni Sandor, Targu Mures ROMANIA
[email protected],
[email protected] ,
[email protected],
[email protected],
[email protected]
Abstract: Romania`s river basins need to be monitorized more efficiently for a better water resources management. The collecting data system is based on local operators who measure different parameters at the river basins hydrological stations. They write the measured values on paper every day. At the end of the month they transmit the papers to the Regional Hydrological Institution were other operators introduce the values in the computers. HYDROweb application allows users (local operators) from different hydrological stations around the river basin to introduce directly in the computer the measured hydrological values. Also this program analyses and facilitates the interpretation of the hydrological data. Key-Words: database, templates, web application, river basins
1 Introduction The HYDROweb application allows a potential user to introduce measured hydrological values from many hydrological stations situated in different geographical areas. Also analyses and facilitates the interpretation of the hydrological data. The application was developed in PHP script and uses MySQL as a database. The application must be installed on a central server with Windows or Linux platform. The operators can access the application directly from the hydrological station using a web browser. There are two types of users: the system manager and the operators. The system manager creates operators accounts and adds the hydrological stations. The operators can only introduce data and analyses the statistics.
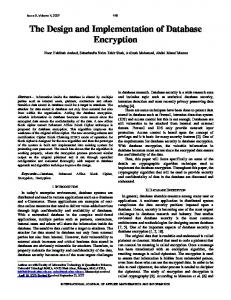
1.1 The database The database is organized in the following tables:
Station station_id name description picture tip observ
User user_id username password email name access_level
Debit debit_id station_id year month qmed qmax qmin qmed_nat qmax_nat qmin nat Tmp_graph tmp_id user_id img
Fig. 1 – The database general draft The Station table contains information about hydrological stations. The Debit table keeps information regarding volumes, and User table contains the operators that can access the application.
Proceedings of the 11th WSEAS International Conference on COMPUTERS, Agios Nikolaos, Crete Island, Greece, July 26-28, 2007
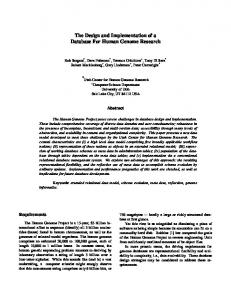
2 Problem Formulation The application is implemented using the templates philosophy. The templates are html folders that describe the aspect of the web page. The templates contain posted data that are controlled by a PHP script. The templates method allows a fast development of the web application, and also the templates method has a high level of flexibility. The engine used is implemented in the php Fast Template class. The template is an html file that contains some marked blocks overwritten by a PHP script with the useful information. For example, the next template: Select... {STATION} The php script will look as the following example: // is initialed with the folder $ft = new Fast Template("hidro/tpl/"); $ft->define(array('main' => "sablon.html")); // is changed by the {STATION} tag with html code // necessary for the values definition $ft->assign(“STATION”, build_station_list()); $ft->parse(‘CONTENT’, ‘main’); $ft->fetch(‘CONTENT’); where the build_station_list() function shall generate a string that contains the html code needed for the values definition . Folder.php (script) FastTemplate
Final result
Folder.htm l (template)
Fig. 2. – The templates method general draft The opening of the each generated page is controlled by a index.php folder. The opening of a page is specified through the page parameter and the execution of a specific action is possible by the act parameter. One example could be: http://localhost/index.php?pag=station_list&station_id=8 &act=station-delete
159
The act parameter contains the class name and the function name that will be executed. In this case the interrogation used above will determine the deleting of the hydrological station from the database with id number eight and the posting of remained stations. In the func_perm.php folder are defined the access permissions for each function. Every operator has an access level defined in the users table. When the function specified in the act parameter is executed the program verifies if the operator has or hasn’t the right to execute the specified function. $func_access=array ( station => array(add=>3, delete=>1, update=>1, erase_picture=>1 ) ) The operator with the lowest access level (level one) is considered the strongest and it is the network (system) manager. Each table has a corresponding class in which adding, modifying and deleting functions have been implemented. The volumes introduced in the database are interrogated through MySQL interrogations and PHP formulas. The obtained results are then represented using statistical graphs. The monthly average volumes measured and rebuilt are obtained using the following formulas:
ΔQ = Qnat − Qmas
% ΔQ =
ΔQ Qnat
The implementation of these formulas is possible using MySQL as in the following example: $dbu->query("SELECT station_id, month, qmed, qmed_nat, (qmed_natqmed) AS dq, (qmed_natqmed)/qmed_nat*100 AS dqp FROM debit WHERE station_id='".$glob['station_id']."' AND year='".$glob['year']."' ORDER BY month"); The result of some interrogation could be seen in the 3rd section. With the obtained data a graph is posted. This is possible using Jpgraph library and the next code: // Create the graph. These two calls are always required $graph = new Graph(572,300,"auto"); $graph->SetScale("textlin");
Proceedings of the 11th WSEAS International Conference on COMPUTERS, Agios Nikolaos, Crete Island, Greece, July 26-28, 2007
$graph->SetY2Scale('lin',0,ceil( max($datay_dqp))); $graph->legend->Pos(0.3,0.9 , "right", "center"); $graph->legend->SetLayout(LEGEND_HOR); // Add a drop shadow //$graph->SetShadow(); // Adjust the margin a bit to make more room for titles and legend $graph->img->SetMargin(40,55,40,80); // Create a bar pot $bplot = new BarPlot($datay); $bplot2= new BarPlot($datay2); $bplot->SetLegend("Qmas"); $bplot2->SetLegend("Qnat"); // Adjust fill color $bplot->SetFillColor('blue'); $bplot2->SetFillColor('orange'); // Create the grouped bar plot $gbplot = new GroupBarPlot(array($bplot,$bplot2)); // Create a yellow line plot $p1 = new LinePlot($datay_dq); $p1->SetColor("yellow"); $p1->SetLegend("DQ[mc/s]"); // Create a red line plot $p2 = new LinePlot($datay_dqp); $p2->mark->SetType(MARK_UTRIANGLE); $p2->SetColor("red"); $p2->SetLegend("DQ[%]"); $graph->Add($gbplot); $graph->Add($p1); $graph->AddY2($p2); // Setup the titles $graph->title->Set("Variatia debitelor medii lunare"); $graph->xaxis->title->Set("Luna");
$graph->yaxis->title->Set("Q[mc/s]"); $graph->y2axis->SetTickSide(SIDE_RIGHT); $graph->y2axis->SetColor('black','blue'); $graph->y2axis->title->Set("Q[%]"); $graph->title->SetFont(FF_FONT1,FS_BOLD); $graph->yaxis->title->SetFont(FF_FONT1, FS_BOLD); $graph->y2axis->title->SetFont(FF_FONT1, FS_BOLD); $graph->xaxis->title->SetFont(FF_FONT1, FS_BOLD); // Display the graph $file_name = "grml".rand().".png"; $graph->Stroke($file_name); $ft->assign("IMG_GRAPH", "
"); The result of this code is available in fig 6. The resulted graph is represented with a png image format. To avoid problems regarding the browser cache, a random name is used for the image folder that will be different at every generation. This is how the browser will charge each time the correct image for the corresponding graph. The image name will then be stored in the tmp_graph table and will be deleted when operator leaves application. In the same way is calculated the degree to which the global average volumes is affected but the formula is different: k[%] = Qmas / Qnat x100 .
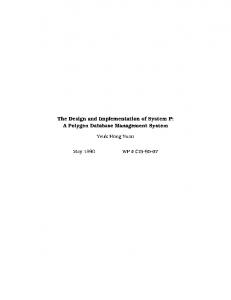
3 3 Problem Solution HYDROweb application displays two types of menus depending on autentificated operator.
Login menu for the operators Fig. 4 – Application menu
Login menu for the system manager Fig. 3 – Application menu
160
The system manager can introduce the operators that will use the application. He can also introduce the hydrological stations and data. There is the possibility to introduce a photo representing a geographical map. The
Proceedings of the 11th WSEAS International Conference on COMPUTERS, Agios Nikolaos, Crete Island, Greece, July 26-28, 2007
map files are in the upload folder and renamed after harta_id_statie form.
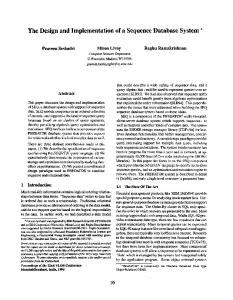
Fig. 5 – The volumes table The application analyses hydrological data listing the measured and natural monthly average volumes and the global affecting level graph.
Fig. 6 –Measured and natural average monthly volumes
•
Easy integration. The database management system (DBMS) manages successfully hydrological databases. The access to the hydrological data from a river basin is made through the DBMS very efficiently. The client/server architecture proved once again its value. Among the advantages of using the client/server architecture we can mention: • centralizing – access, resources and data security are controlled by server • updating – the elements can be improved anytime • flexibility – the new technologies can easily be integrated in the system • interoperability – all the components (clients, network, servers) work together The rising popularity of the relational model and the increasing spread of the relational databases are mainly due to their extremely simple but very strong databases software. Most applications can be accessed via WEB from anywhere in the world. Some of the advantages are: • Low implementation costs • Low maintenance costs (hardware, software). The software such as PHP (Hypertext Preprocessor) or ASP (Active Server Pages) made the via WEB applications highly known. The advantage of using these scripting languages is obvious as all the operations are made on the server. Thus, the client doesn’t need a very powerful computer as the server does it all.
Fig. 7 – Measured and natural average monthly volumes graph
4 Conclusion The databases have been very useful since they appeared. The main three advantages of using the databases are: • Centralized data management; • Data independence;
References: [1] DOLLINGER, Robert –(1998) „Baze de date şi gestiunea tranzacţiilor”, Cluj Napoca, Grupul microINFORMATICA [2] Gzorodi, Cornelia -(2000) „Baze de date relaţionale. Teorie şi aplicaţii”, Oradea,Editura Treira
161
Proceedings of the 11th WSEAS International Conference on COMPUTERS, Agios Nikolaos, Crete Island, Greece, July 26-28, 2007
[3] FOTACHE, Marin – (2001) „SQL. Dialecte DB2, Oracle, Visual FoxPro”, Iaşi Editura Polirom [4] VODĂ, Mihai –(2002) „Metode şi tehnici utilizate în evaluarea scurgerii în regim amenajat”, Cluj-Napoca, Univ. „Babeş-Bolyai” [4] www.mysql.com [5] www.php.net [6] www.aditus.nu/jpgraph [7] www.thewebmasters.net/php/FastTe mplate.phtml [8] www.phpclasses.org
162