The IsoMetrics Usability Inventory An operationalisation of ISO 9241-10 supporting summative and formative evaluation of software systems
Günther Gediga Adress: Fachbereich Psychologie Universität Osnabrück D-46069 Osnabrück Germany Tel.: +49 541 969 4421 Fax: +49 541 969 4470 Email:
[email protected]
Kai-Christoph Hamborg Adress: Fachbereich Psychologie Universität Osnabrück D-46069 Osnabrück Germany Tel.: +49 541 969 4703 Fax: +49 541 969 4470 Email:
[email protected]
Ivo Düntsch Adress: School of Information and Software Engineering Faculty of Informatics University of Ulster at Jordanstown Shore Road, Newtownabbey, Co. Antrim BT37 0QB, Northern Ireland Tel.: +44 1232 368976 Fax: +44 1232 366068 Email:
[email protected]
1
The IsoMetrics Usability Inventory An operationalisation of ISO 9241-10 supporting summative and formative evaluation of software systems Günther Gediga, Kai-Christoph Hamborg Fachbereich Psychologie, Universität Osnabrück, Germany
Ivo Düntsch School of Information and Software Engineering, University of Ulster, N.Ireland
Abstract Aiming at a user-oriented approach in software evaluation on the basis of ISO 9241 Part 10, we present a questionnaire (IsoMetrics) which collects usability data for summative and formative evaluation, and document its construction. The summative version of IsoMetrics shows a high reliability of its subscales and gathers valid information about differences in the usability of different software systems. Moreover, we show that the formative version of IsoMetrics is a powerful tool for supporting the identification of software weaknesses. Finally, we propose a procedure to categorise and prioritise weak points, which subsequently can be used as basic input to usability reviews. 1. Introduction Evaluation plays an important part in software development (Williges, Williges and Elkerton, 1987, Shneiderman, 1992, Nielsen, 1993). It aims at (a) determining whether user needs are met, (b) assessing a system’s suitability for a task or a group of tasks, and (c) comparing a system with other products on the market (Kirakowski and Corbett, 1990). Evaluation of software devices may take place • •
As formative evaluation during the development phase in order to improve a system iteratively, until desired design objectives are reached and weaknesses of the software are eliminated, or As summative evaluation of a final design regarding guidelines, standards, or other objectives of the evaluation (Scriven, 1967, Williges, Williges and Elkerton, 1987, Kirakowski and Corbett, 1990, Nielsen, 1993).
Although sometimes considered ill defined (Eason, 1984) and undesirably vague, usability is an important concept in software design and evaluation (Eason 1984, Dzida, Wiethoff and Arnold 1993). The vagueness of the concept has made usability evaluation difficult; however, within the framework of ISO 9241, the concept of usability becomes more concrete. ISO 9241 Part 11 defines usability in terms of • Effectiveness (the accuracy and completeness with which users achieve specified goals), • Efficiency (the resources expended in relation to the accuracy and completeness with which the users achieve goals) and • Satisfaction (the comfort and acceptability of use), (ISO FDIS 9241-11, 1997). In their Usability Quality Model, Dzida, Wiethoff and Arnold (1993) define the criteria of ISO 9241 Part 10 as sub - factors of the usability factor „efficiency„ according to ISO 9241 Part 11. Following this line of argument, the principles of ISO 9241 Part 10 can be regarded as a sub construct of usability in the sense of ISO 9241, defining a framework for its operationalisation. ISO 9241 Part 10 formulates seven principles regarding the design and the evaluation of the dialogue technique of software (ISO 9241-10, 1996). The design principles of ISO 9241 Part 10 are based on seven corresponding factors of user perceived quality, formerly researched and defined by 1
means of questionnaire and factor analysis (Dzida, Herda and Itzfeld, 1978). These factors provide the basis for the former German standard for ergonomic dialogue design DIN 66234 Part 8, 1988, and also for ISO 9241 Part 10. The seven dialogue principles of ISO 9241 Part 10 (ISO 9241-10, 1996) are: • Suitability for the task • Self descriptiveness • Controllability • Conformity with user expectations • Error tolerance • Suitability for individualisation • Suitability for learning The authors of ISO 9241 Part 10 emphasise that the principles can only be applied as general guidelines when developing or evaluating dialogue systems. Thus, usability in terms of ISO 9241 still remains too vague and not very helpful for concrete evaluation projects, unless the principles are defined on a specific and applicable level. Up to now, only a few instruments which support summative and formative evaluation according to ISO 9241 Part 10 have been developed. One approach is the ISONORM 9241/10 questionnaire (Prümper and Anft, 1993). ISONORM comprises five bipolar items for each of the seven principles of ISO 9241 Part 10. The problems with which ISONORM – like other instruments – is faced, can be summarized by the following questions: 1. Does the instrument offer valid operationalisations of the underlying constructs? In other words, does the application of the instrument lead to results, which can be interpreted in line with a given theoretical model? 2. Is the instrument constructed in such a way that the results (e.g. „scale means„ in summative evaluation or „evoked remarks„ in a formative setting) are reliable? 3. Are different scales of the instrument discriminant with respect to each other? This question is of some interest, because if different scales will not show discriminant results, the time to apply the instrument can be shortened by omitting some of the low discriminating questions. In order to check the validity of ISONORM, Prümper and Anft (1993) compare software with and without Graphical User Interface (GUI) applying the ISONORM questionnaire. Results of the study show that GUI software scores better on each scale than software without a GUI. The pattern of results is almost the same with respect to the direction of answers (positive vs. negative), except for the scores of the scale „suitability for individualisation„. The questionnaire therefore does not seem to discriminate between the GUI and CUI based software under study with respect to the seven principles of the ISO 9241 Part 10; instead, it seems to be guided by an overall factor called „user-friendliness„. This assumption is corroborated by an actual study (Prümper, 1997), which validates the questionnaire via an overall score correlation of ISONORM, namely, the QUIS inventory (Norman 1991, Shneiderman, 1992), and another questionnaire which operationalises the construct „user-friendliness„. Prümper also reports the application of ISONORM 9241/10 in a formative design. In a participative design approach, and in combination with group discussion techniques, it seems to be a useful tool to identify the weak points of software. Nevertheless, in the formative setting the aspect of discriminant validity has not been studied up to now, although the effort in terms of time is much higher in a formative setting than in the summative evaluation. In this paper, the development of the IsoMetrics questionnaire is presented. The purpose of IsoMetrics is the evaluation of software according to ISO 9241 Part 10. IsoMetrics is applicable in comparing software either as competing products or as different versions of a software prototype (summative evaluation) or in system design (formative evaluation). Its statistical indices of
2
reliability and validity are satisfactory. In this article we concentrate on issues of the questionnaire validity. 2. Summative software evaluation: Some methodological ideas Any evaluation instrument has to be valid, reliable, and – at least slightly – discriminant to other evaluation instruments. It has been long discussed how to obtain statistical measures of these qualities within a usability instrument (Dzida et al. 1978; Hampe-Neteler and Rödiger 1992). The techniques applied are based on the classic test theory (CTT) model, e.g. factor analysis and itemreliability analysis. Since the application of any data analysis technique is problematic as long as we do not know how the theoretical underpinnings fit into a model of the user reaction process, a simple theoretical framework for the reaction process of a user will be outlined. A proper evaluation of usability can only be done if three different entities are fixed (Hamborg, 1996): 1. The software under study 2. The task frame in which the software system should be applied 3. The population of subjects which should gauge the usability of the software system. Within a fixed frame of tasks, we assume that any software system has a fixed, but unknown, (conditional) usability score in each usability scale. The users who are confronted with the system will have different impressions about its usability, and we assume that every subject has a report bias, which causes the differences in the ratings of the software usability. Given this simple model, the correlation of two items (ki, kj) on a scale k depends on the unknown distribution of the usability score and the random variable of the individual criterion values. Low item correlation (and consequently low statistical reliability) may be due to low variation of the criterion value and/or to extreme values of the true score of usability. High item correlation will be observed if the variance of the criterion values within the sample under study is high, and the true usability score is not extreme. In case of one subject and a universe of systems, the correlation of two items (ki ,kj) depends on the true score variance and the individual report bias. In this case, a statistical reliability measure evaluates the precision of the differences between systems – an index that is close to the intentions of the researcher. Unfortunately, is this a rare situation, because 1. It is hard to define a „universe of systems„, 2. The rating depends on the opinions of only one subject, 3. It has to be assumed that the subject bias is constant while varying the systems. Whereas problem (2) can be solved by multiple measurements, the other problems cannot be solved in principle; therefore, one has to conclude that a usability measure using a „one-expert-universeof-system„ design is not meaningful. Most data analysis in the field of usability testing consists of data where many subjects gauge different systems. In this case, the situation is much more complicated than above, and any result based upon a – more or less undefined – database is useless, because the results are surely not replicable. A pragmatically acceptable validation strategy is the use of a „many-users-one-system„ (n x 1) situation, even though this approach is not without problems. The first problem is a low statistical reliability caused by extreme usability values. An extreme usability value is detectable by inspecting the scale mean. If the scale mean is extremely high or extremely low, we obtain valid information about the software, and therefore a lack of statistical reliability is not a problem. High reliability in the n x 1 situation tells us that the subjects' choices are consistent. Therefore, the expectation of the distribution of the choices Xk tells us something about the unknown usability 3
true score reached by the System S. Another disadvantage of this approach is that the statistical reliability measure always depends on a specific software system: There is no overall guarantee of reliable usability scales. Nevertheless, this is not really a drawback as long as we use the frame of CTT, since reliability measures of CTT only apply in a ceteris paribus (same population, same context) situation which is rarely observed in evaluation research. A problem of interpreting the summative usability results is that the discriminative validity (in terms of subtest correlation) of the empirical indicator is sometimes missing. Given the n x 1 scenario and the model assumptions, the correlation among scales has to be positive and not too low, if we adopt the (plausible) assumption that the criterion values of the rates are fixed over different scales. If the distributions of the true score in measure k and m are identical, the correlation between the observed scores Xk and Xm has to be as high as the reliability of the scales. If the true score distributions are different, we expect a positive, but smaller correlation. For this reason, one cannot expect to result in factorial clean usability scales. 3. Construction of the Inventory A fundamental part of validity is „content validity„ (Clark-Carter, 1997, p. 29): The questions gathered for the questionnaire should have some solid theoretical basis. The construction of the IsoMetrics inventory therefore starts with a procedure to guarantee that its content is close to the theoretical ideas of usability. One might argue that the examples given in ISO 9241 Part 10 are sufficient to be the sole starting point for an evaluation instrument. However, checking other questionnaires and checklists, which pretend to cover the subject of usability, one finds that they offer a huge variety in the chosen criterion. Therefore, we start with the universe of all (available) questions and phrases, and construct the questionnaire from this universe by the following steps: 1. Published questions and phrases concerning usability were gathered from published questionnaires and checklists in order to obtain a large pool of possible usability items on which the construction of the questionnaire could be based. Therefore, the content validity of the items is as good as possible. 2. If necessary, the items were mildly rephrased, because some of the questions and phrases were embedded in a context, which cannot be used within a questionnaire. 3. Six experts were asked to assign the items to different aspects of usability based upon ISO 9241 Part 10. 4. Design of the actual questionnaire. 5. Analysis to determine the reliability of the questionnaire. 3.1 The construction of the Item Pool To obtain an acceptable universe of usability items, existing inventories and relevant literature offering operationalisations of usability were checked. This resulted in 651 items based on • • • • • • • •
„QUIS„ (Norman 1991), „User Evaluation of Interactive Computer Systems„ (Shneiderman, 1992), „EVADIS I„ (Oppermann et al., 1988), „EVADIS II„ (Oppermann et al., 1992), „Leitstand Checkliste 9241/10„ (Ilg, Kroneberg and Richter, 1991), „ISONORM 9241/10„ (Prümper and Anft, 1993), „Bewertungsskala Benutzbarkeit R/3„ (Neugebauer and Spielmann, 1992), ISO 9241 Part 10 (ISO 9241-10, 1996), 12 (ISO 9241-12, 1997), 14 (ISO DIS 9241-14, 1995), • „Evaluation Model„ (Dzida et al., 1993), • „Measuring the Utility of Application Software (Cohill, Gilfoil and Pilitsis 1988). 4
In order to obtain a relevant basis for further analysis, the item pool was reduced to 151 items. The principles of elimination were as follows: 1. Eliminate items that are not understood by an average user because expert language was used. 2. Eliminate items that are specific to a certain application. 3. Eliminate items that obviously do not match ISO 9241 Part 10. 4. Eliminate similar items using the following heuristics: • Use a more concrete rather than an abstract item, • Use an item with simple semantics and syntax, • Use a positively formulated item and reject a similar item that uses negation. The action rules resulting from these heuristics are documented in Willumeit (1994). The reduced item pool builds the foundation for the next step, the querying of experts. 3.2 Scale Construction After obtaining the reduced item pool, the next step was to assign each item to one of the seven principles of the ISO 9241 Part 10. For this task we have used an expert rating approach, as we do not feel that the factor „analytic description„ constitutes a valid method for accomplishing this task (see above). Six usability experts from German software companies and universities were asked to assign each of the 151 selected items to one of the 7 principles of the ISO 9241 Part 10 or to the category „not assignable„. This procedure reduced the item base to 90 items that were assigned to one of the principles of ISO 9241 Part 10 by at least four of the six experts. The median of the interrated reliability based on Kappa (Cohen 1960) was 0.75, a result that can be considered „good„ (Landis and Koch, 1977). For a Beta-version of the inventory, the 90 items and their assignments were used to build the different usability scales. The actual number of assigned items per principle is given in table 1. --- Table 1 about here ---
3.3 The design of the questionnaire There are at least two different objectives for using evaluation instruments in the field: Summative evaluation checks a software system for conformity with a certain standard, while formative evaluation supplies specific information concerning the weakness of the software system in one or more dimensions under study (e.g. Williges, Williges and Elkerton 1987). In order to enhance the practicability of the intended inventory, we offer two instruments, based upon the same pool of items, but using different formats to allow summative as well as formative evaluation procedures. 3.3.1 The summative evaluation instrument IsoMetricsS (short) IsoMetricsS contains a five point rating for each of the items starting from 1 („predominantly disagree„) to 5 („predominantly agree„). A further category („no opinion„) is offered to reduce arbitrary answers by the user. Although there are some methodological problems with this approach (see below), it still has an advantage: Since the subjects need not give an answer if they think that the posed question does not apply to the software system under study, or to the tasks to be treated with the software system under study, it reduces error variance. 3.3.2 The formative evaluation instrument, IsoMetricsL (long) IsoMetricsL consists of the same items as IsoMetricsS and uses the same rating procedure. Additionally, each user is asked to give a second rating, based upon the additional request: 5
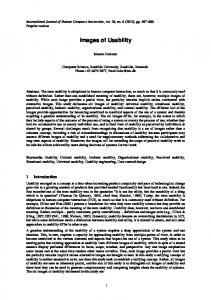
Please rate the importance of the above item in terms of supporting your general impression of the software. This rating ranges from 1 („unimportant„) to 5 („important„), and a further „no opinion„ category may also be selected. Thus, each item is supplied with a weighting index. To evoke information about malfunctions and weak-points of the system under study, the question Can you give a concrete example where you can (not) agree with the above statement? is posed. This gives users the opportunity to report problems with the software, which they attribute to the actual usability item. An example of one item of IsoMetricsL is presented in figure 1. --- Figure 1 about here --This design provides information that can be used within an iterative software development. In summary, these are • 7 scores of the usability dimension to measure the progress of development, • Concrete information about malfunctions and their user-perceived attributes, • Mean weight of any user-perceived attribute given a class of system malfunctions. 3.4 Reliability analysis of the Beta version of IsoMetricsS The reliability analysis of the Beta version was done using the evaluation of the R/3 data base system (Release 2.0; SAP AG) with Cronbach’s alpha reliability estimate (Clark-Carter, 1997, p. 337). The participants of the study were 111 subjects who had frequently used the R/3 application. Tab. 2 shows that the statistical quality of the scales is at least satisfactory. One item (t12) on the scale „controllability„ shows a negative correlation with the scale sum. At the same time, this item is one of the most informative items within the formative evaluation (s. table 8). In order to use the same syntactical instrument for summative and formative evaluation, we did not drop Item t12 from the inventory. --- Table 2 about here --Missing data („no opinion„) values are problematic for some practical purposes, because only subjects without any missing values were taken into account when computing the reliability of the scale. We argue that the „no opinion„ values may be replaced by the middle value („3„) of the items. The left part of table 2 shows the results of the statistical analysis using the replaced „no opinion„ values. Comparing the basic statistical indices reliability, mean scale value, and standard deviation with the treatment of „no opinion„ as missing value, we observe only small differences. In the following chapter we shall use the same replacing strategy in order to analyse the summative version of IsoMetrics. 4. Validation of the summative version of IsoMetrics 4.1 The validation strategy Since the usability measures depend on the task frame, a validation of the questionnaire is somewhat problematic. The strategy we have used was to start with the broadest possible task frame: The subjects should determine (a) the system that they have used for a prominent part of their work and (b) the system that they have used for a longer period of time. This self selected task frame has the problem that the gauging of „suitability for the task„ is biased, because it is reasonable to expect that subjects are using systems to which they have grown accustomed with respect to their tasks or which they have chosen according their own perception that it is most 6
suited for their job. Therefore, we shall not expect marked differences among software systems in the „suitability for the task„ scale, if the task frame is selected by the subjects themselves. Furthermore we have to consider, that the software systems investigated in this study are very heterogeneous in relation to the task domain (except Word and WinWord). Differences concerning „suitability for the task„ may become more probable if software systems of the same task domain are examined. Although this sounds like a drawback for the validation strategy, this is not the case, because a dissociation among the usability dimensions is necessary to show that usability can be measured on more than one dimension (see Chap. 1). In a second step we will show that the scale values of „suitability for the task„ are sensitive to changes in this dimension. The aim of the paper is to demonstrate that it is possible to define reliable and sensitive usability scales as a first and necessary step for validating a questionnaire. However, because software evaluation depends on the chosen task frame, the reported scale values of a system under study cannot be interpreted as a „general usability score„ for that particular system, since one has to take into account the task frame in which the data were gathered. 4.2 A broad task frame: Fixed suitability for the task 4.2.1 Sample description The validation of IsoMetricsS was done using a sample of 229 employees of the University of Osnabrück. Their task was to use IsoMetricsS to rate the software system they were frequently working with; only those subjects took part who had more than 6 months experience with the system. The systems with more than 10 mentions were analysed, namely, LATEX (a text processing system for mathematicians), Pica (a system used by the university library), Word (Microsoft Word), and WinWord (Microsoft Word for Windows). Table 3 shows how different occupation levels interact with the usage of the software system. --- Table 3 about here ---
4.2.2 Checking Reliability The first part of the analysis concentrated on the replication of the results of the reliability analysis of the Beta-Version of the test. As outlined in Chapter 2.2, an additional item analysis is necessary within any (group x system) combination. To justify that the reliability of usability scales are the same given different software systems, we tested the difference of Z-scores of the reliability R. The Z-scores are defined by Z=
1 1 + R ln 2 1− R .
The weighted difference of reliability RA in sample A with nA subjects from reliability RB in sample B with nB subjects is computed by z=
Z A − ZB 1 1 . + n A − 3 nB − 3
7
This difference is approximately normally distributed (Clark-Carter, 1997, p. 332). If a significant difference of reliability of a certain group of subjects confronted with one system is observed in comparison to the reliability within the construction set, we have eliminated the item with the smallest corrected correlation with the test sum. The results of this procedure show that the replication in terms of reliability is successful (table 4). There were only a few significant differences due to three items in contrast to the construction set which showed a negative item-total correlation: 1. Scale „suitability for the task„ (WinWord). Item 8: „Too many different steps need to be performed to deal with a given task„. 2. Scale „conformity with user expectations„ (Word, WinWord). Item 8: „The software is inconsistently designed, thus making it more difficult for me to do my work„. 3. Scale „suitability for learning„ (Word, WinWord). Item 1: „I felt that I needed a long time to learn how to use the software„. --- Table 4 about here --These three items were eliminated from the scales for further analysis. Table 4 shows in brackets that the elimination of these items sufficed to adjust the reliability of the scales. 4.2.3 Validity estimates In order to validate the IsoMetrics inventory, we compared the scale means of the five different software systems. Table 5 shows the summary results of the comparisons; table 6 shows the corresponding means and standard deviations. By construction, we have to assume that there are no marked differences among the systems given the scale „suitability for the task„. Power analysis within the analysis of variance approach shows that the medium effect (proportion of explained variance in population = 0.059, see Clark-Carter, 1997, p. 254) can be excluded with a power of 0.87 (α=5%). The statistical tests show that the homogeneity of the scale „suitability for the task„ is given. If there were only one usability dimension as an underlying construct, all other measures of usability should show no marked differences among the chosen systems. Except for the scale „conformity with user expectations„, this is not the case. This was to be expected, since the users had gauged those systems, which they were used to during their daily work. Even though a system reaction might not be plausible to a user, it still is an expected one – thus eliminating the differences between user expectation and system reaction. Therefore, the conformity with user expectation is given. --- Table 5 about here ----- Table 6 about here --Given the other dimensions of usability, we should expect some marked differences between the systems. As a replication of Prümper and Anft (1993), we expect the GUI interface of WinWord to be rated better than the interfaces of the other systems. The DOS-based environment of the LATEX software should exhibit deficiencies in terms of „self – descriptiveness„, since its creators did not consider „suitability for learning„ a priority; instead, the aspect of „customisability„ (adaptation of the system to the working environment by experts and not by users) and „tailorability„ (expert based adaptation of the software to user’s needs on the workstation level) was emphasised, both of which are not part of the ISO 9241 Part 10. For the same reason it can be expected that R/3 shows 8
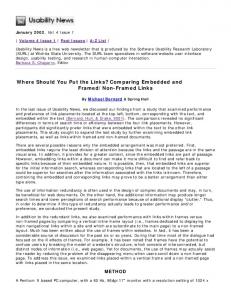
comparatively high ratings in terms of „suitability for learning“ and low ratings in terms of „suitability for individualisation„. Table 5 and table 6 show that there are three different levels of „self descriptiveness„ within the data set. WinWord obtained the best result, whereas LATEX is the worst system. The other systems were rated to be not as good as the WinWord system and better than LATEX. The scale „controllability„ shows that the Windows environment within WinWord is judged to be better than the other system environments with respect to this aspect of usability. Although the „error tolerance„ scale shows significant differences between the groups, no significant contrast was observed. The scale „suitability for individualisation„ shows a comparatively low rating of Pica and the SAP R/3 (Release 2.0) application (the R/3 data stem from the study, described in Chap. 3.4), whereas WinWord is judged to be better than Word. The individualisation of the LATEX system is not comparable to the other systems because of the large confidence intervals of the mean, which is due to relative small number of subjects in this group. Finally, the scale „suitability for learning„ shows differences between the set {WinWord, R/3symbol 125 \f "Symbol" \s 12 and the set {Word, Picasymbol 125 \f "Symbol" \s 12. The mean value of the scale within the LATEX user group is quite low, but there are no significant differences to other groups, because of the small sample size of this group. All in all, we find that the results validate the summative version of IsoMetrics: There are no differences (in terms of no medium effect size) in the scales where we do not expect them, and the differences we found are quite plausible. 4.3 Validation of the „usability for the task„ dimension The analysis presented in the previous chapter does not prove that the „suitability for the task„ dimension shows valid results. A case study in which IsoMetrics was applied will demonstrate that this dimension is valid as well. IsoMetrics was applied in a formative setting in a computer aided language learning project (RECALL, Bosch, 1995). Within this project, a software prototype (CASTLE) was developed and the usability of the versions CASTLE (1.4a) and CASTLE (1.5a) was studied. The main advancement of CASTLE (1.5a) was an enhancement of its functionality. Two different samples of language students who used CASTLE as an additional device for language learning took part in the study. Evaluation of usability was performed by 12 (version 1.4a) and 8 students (version 1.5a) after having worked 6 weeks with the system. --- Table 7 about here --As the number of evoked remarks (table 7) demonstrates, the effort of enhancing the functionality results in a decrease of those weaknesses, which are reported in connection with the items of „suitability for the task„. However, the reduction of the other types of weaknesses is not very marked. --- Figure 2 about here -The profiles of the mean scores in the scale value reflect the results of the qualitative data analysis as well as the effort of the developers. Figure 2 shows that there are significant differences (α=5%) of the means of the two dimensions „suitability for the task„ and „self-descriptiveness„. The improvement of the „suitability for the task„ was large, as it could be predicted from the progress of the system development. Up to the „self-descriptiveness„ dimensions no marked progress was 9
obtained, which is concordant with the focus of the software development and the distribution of qualitative remarks gathered for both prototypes (table 7). 5. Validation of the formative version of IsoMetricsL 5.1 Application of IsoMetricsL The aim of IsoMetricsL is to support the design and improvement of software according to the design principles of ISO 9241 Part 10. When used in an iterative development life cycle, IsoMetrics provides specific feedback about weak points and malfunctions of a system under construction. As pointed out in Chapter 3.3.2, users of IsoMetricsL should report „problems„ relating to items of the IsoMetricsL inventory. Thus, a formative evaluation with IsoMetricsL results in a list of problems concerning the software under study. In a next step these problems are prioritised based on a weight index (see Chap. 3.3.2) and on how often a problem was mentioned. Two surveys were conducted to prove the ability of IsoMetricsL to pinpoint weaknesses of software products. The object of both investigations was SAP software equipped with graphical user interfaces on the basis of R/3, Release 2.0. Because of the similarity of both studies regarding sample size and outcomes (s. Willumeit 1994), we have concentrated on only one of these. The investigated product provides the maintenance of a database for terminology; it is predominantly used by SAP internally. Subjects were 21 employees of SAP (16 females and 5 males) with a mean age of 30 years. Their professional experience ranged from 0.5 to 2 years (10 persons) to more then 2 years (11 persons). Seven participants used the software between 1 and 4 hours every day, 14 persons worked with the system between 5 and 8 hours a day. The mean expenditure of time to complete the questionnaire was about 1.5 hours. In order to obtain a solid indication as to the enhancement of the usability of the software, the collected data were analysed on a single item level. Therefore, the formative evaluation is based on the weighted item-score (rating of relevance), as well as upon the reported problems referring to the particular item. --- Figure 3 about here --Figure 3 shows the main rating score and the corresponding weights of the scale „suitability for the task„. As an example, items a3 and a8 will be discussed in detail to elucidate that kind of information which can be gathered, if the rating score of an item is compared to its weight: Item a3 („The software lets me completely perform entire work routines„) has obtained the highest rating score and the highest weight as well. Thus, the users state the high importance of the aspect to which this item refers. Simultaneously they find the realisation of this aspect in the software to be satisfactory. In contrast to item a3, the item a8 („Too many different steps need to be performed to deal with a given task„) indicates an aspect in need of improvement because of the correspondence of a low rating score1 and a high weight. The fact, that the greatest difference between weighting and rating score appeared in combination with the greatest number of reported problems which were evoked by a single item (23 problems, Item a8), supports the following hypothesis: The distance between rating score and weight provides information regarding the acceptance of certain characteristics of the software under examination. The total number of reported (non-redundant) remarks and problems in this study is 370; these were made by 21 users. However, we must take into account that this number contains multiple
1
Because low ratings of a8 indicates a high score of suitability for the taks, the mean of item a8 was inverted by the transformation 6 - µ(a8) in order to result in comparable item means. A transformation of the weights is not neccessary. 10
namings of single aspects by different users. A ranking of the scales with respect to the average number of reported problems gathered by an item is shown in table 8. --- Table 8 about here --The scale „suitability for the task„ ranks highest in regard to the given remarks. In addition, it shows the greatest distance between rating and weight, caused by a relative low mean of the rating score, in combination with a high mean of the weight. This fact supports the hypothesis mentioned above. Considering the fact that participants were asked to write down aspects which are in need of improvement, we should like to point out that analysing the number of reported problems on a single item level could be the first step towards identifying potential problem areas in software products. Furthermore, the existence of certain classes of problems seemed to emerge as the examination of the weak points progressed. For example, one class of problems applies to circumstances which either point to a lack of functionality or to a tedious realisation of given functionality, both touching on deeper aspects of the structure realised in the software. A second class of problems focuses particularly on ambiguous or incomprehensible terms and messages; other classes are established by identifying weak points concerning error situations or navigation. The subdivision of problems into specific classes could possibly enable an evaluator, who is interested in a particular kind of information, to use IsoMetrics even more effectively. The qualitative analysis focused especially on the reported problems. Based upon the results of IsoMetrics, a review meeting was held during which software-developers, users, and human factor professionals defined the priority of the identified problems. To ascertain an order of priority, we considered the mean weight of an item and the frequency with which users named weak points concerning an item. As described above, the weights ranged from 1 („unimportant„) to 5 („important„). Rank 3 is defined as a neutral value. Given this fact, a pragmatic approach was developed to assign the items to a binary category of weighting (index w). • Category A (w): Problems with a mean weight > 3 • Category B (w): Problems with a mean weight ≤ 3 It proved practical to determine the frequency index (f) by the percentage of mentions. Again, a binary category was formed: • Category A (f): Problems named by at least 25% of the participants • Category B(f): Problems named by less than 25% of participants Finally, a priority list of problems was established to shorten the communication with the software developers within a review meeting: • Priority „1„: Reserved for problems forcing the user to interrupt his task (e.g. a system halt) • Priority „2„: Assignment to A(w) and A(f) • Priority „3„: Assignment to A(w) and B(f) or B(w) and A(f) • Priority „4„: Assignment to category B(w) and B(f). Most of the discussed weak points could easily be located within the software, since participants were asked to state specific examples of aspects which were in need of improvement. Additionally, the suggestions of priority significantly sped up the discussion of the entire problem set during the course of a review, and the subsequent translation of the decisions into action. This was facilitated by a well-prepared presentation of systematically and empirically collected weak points. This procedure earned positive feedback from all participants of the review. The users on one hand found their interests entirely and adequately represented; the developers on the other hand emphasised the detail, completeness, and speed of the discussion that had not been attained before. 11
5.2. Validation of IsoMetricsL The data of the study were used to check whether the scale formation within IsoMetrics is valid. Two raters categorised every remark or problem into one of the following categories: • New functionality: Users demand new functions. • New combination of functions: Users like more comfortable functions within the system. • Enhance user-system communication: The terms used by the system are not adequate for the user group. • Help system and documentation: The explanation of the system is incomplete or faulty. • Error protection: Users request system protection against errors. • Screen arrangement: Users ask for better arrangements of messages on the screen. • User navigation: Quicker and/or less complicated navigation within the system. • Better time efficiency: Users feel that the system reaction is too slow. • Other: Remarks that do not concern the system developer group. If the scale formation is valid, the cross-tabulation of scales and the classified remarks evoked by the scales should show different contingencies. The necessary precondition of the cross-tabulation is a high objectivity: This objectivity is present, because the inter-rater reliability turns out to be very high (Cohen´s kappa=0.95). The final cross-tabulation is presented in table 9. --- Table 9 about here --The results show that the structure of the usability scales is – at least partially – reflected by the categories of the remarks: • The scale „suitability for the task„ (ST) is dominant, because of the evocation of a high number of remarks. Most remarks suggest a better functionality of the system. • As one would expect, most remarks evoked by the scale „controllability„ (CON) are placed within the category „user navigation„ and „new combination of functions„. No other scale evokes a substantial number or remarks regarding navigation. • The scale „self-descriptiveness„ (SD) evokes remarks about user-system communication and the help system. Obviously this contrasts with the first two usability aspects (ST, CON). • Problems arise with the scale „conformity with user expectations„ (CUE). The contingencies of this scale are comparable to the ST scale. However, whereas the ST scale evokes remarks concerning tasks not processed by the system, the remarks evoked by CUE concern missing functions within existing tasks. • The distribution of the contingencies of the „Error tolerance„ (ET) scale peaks at the „error protection„ category; this is different from all other scales. • The scale „suitability for individualisation„ (SI) mainly evoked remarks about missing functionality with respect to the special feature of individualisation. • The scale „suitability for learning„ (SL) also evoked detailed remarks about this topic, mostly within the „help system and documentation„ category. 6. Discussion The IsoMetrics inventory has been shown to be a reliable and valid tool, supporting formative and summative evaluation of software systems based upon the ideas published in ISO 9241 Part 10. IsoMetricsL gives efficient support to identify weak points of software systems, and therefore provides concrete impact on the improvement and redesign of software systems. Since the inventory evaluates software from the end user’s point of view, it supports a participative and useroriented approach of system design. 12
The seven scales of the IsoMetrics inventory are built using an expert query based upon a filtered item universe ensuring content validity. As we have outlined within our methodological framework, we do not expect to obtain scales that are based upon independent factors: Neither are the theoretical principles independent, nor should the replies of the users who are confronted with different scales be assumed to be uncorrelated. Nevertheless, the proposed inventory obtains its content validity per construction, and as an instrument in formative evaluation, it shows good practical relevance within the reconstruction of a software system. If we use IsoMetrics as a summative evaluation instrument, we have to calibrate the scales, because there may be some (sample x software-specific) replies. Our approach to cope with this problem was to compare the reliability estimates in the construction set with the actual reliability estimator. In case of significant differences we dropped the item with the lowest corrected item-scale correlation. This resulted in scales that were very similar to those in the construction set with similar reliability. Using theses corrected scale values, we found plausible results in comparing different software systems based on user judgements. The problem why highly informative items within the formative evaluation are medium or bad items within the summative version still needs to be solved. An additional problem, namely, that most of the remarks concerning weaknesses of the software were made within the first pages of the questionnaire may have a plausible explanation: If we assume that a user has problems with the software, she or he will report the problem, even though later on in the questionnaire there may be key phrases which are better suited to evoke the reply. Experimental studies using variation and randomisation of the items will give some insights into the problem. The IsoMetrics questionnaire is available in an English and a German version. A manual guides the application of IsoMetrics; a cross platform software tool supports data collection and scoring. The inventory is now in use in several (mostly formative) case studies, and thus, we can obtain further insight into its practicability. Further actual laboratory studies are concerned with the problem of prioritising evoked weak points of software systems, the optimal point of application in the software life cycle, and the necessary amount of evaluators to get an exhaustive number of a system’s weak points (Gediga and Hamborg 1997). 7. References Bosch, P. 1995, Repairing Errors in Computer-Assisted Language Learning. Telematics Programme LE1-1615. [HTML-Document] URL: http://www.infj.ulst.ac.uk/~recall/ Clark-Carter, D. 1997, Doing quantitative psychological research. Hove: Psychological Press. Cohen, J. 1960, A coefficient of agreement for nominal scales. Educational and Psychological Measurement, 20, 37 – 46. Cohill, A.M., Gilfoil, D.-M. and Pilitis, J.V. 1988, Measuring the utility of application software, in: R. Hartson and D. Hix (eds.) Advances in Human-Computer Interaction, Vol. 2, (Norwood NJ: Ablex), 128 – 158. DIN 1988, Bildschirmarbeitsplätze. Grundsätze ergonomischer Dialoggestaltung. DIN 66234, Teil 8. Berlin: Beuth Verlag. Dzida, W., Herda,S. and Itzfeld, W.D. 1978, User-perceived quality of interactive systems. IEEE Transactions on Software Engineering, SE-4, 270 – 276. Dzida, W., Wiethoff, M. and Arnold, A.G. 1993, ERGOguide. The Quality Assurance Guide to Ergonomic Software. German National Center of Computing Science (GMD). System Design Institute. Eason, K.D. 1984, Towards the experimental study of usability. Behaviour and Information Technology, 3, 133 – 143.
13
Gediga, G. and Hamborg, K.-C. 1997, Heuristische Evaluation und IsoMetrics: Ein Vergleich. In: R. Liskowsky, B.M. Velichkovsky and W. Wünschmann (eds.) Software-Ergonomie '97, (Stuttgart: Teubner), 145 – 156. Hamborg, K.-C. 1996, Zum Einfluß der Komplexität von Software-Systemen auf Fehler bei Computernovizen und Experten. Zeitschrift für Arbeits- und Organisationspsychologie, 40, 3 – 11. Hampe-Neteler, W. and Rödiger, K.H. 1992, Verfahren der Evaluation und Standards zur Entwicklung von Benutzeroberflächen. Universität Bremen: Bericht Nr. 2/1992. Ilg, R., Kronenberg, M. and Richter, K. 1991, Checkliste für die Evaluation von Leitständen. Stuttgart: Fraunhofer-Institut für Arbeitswirtschaft und Organisation. ISO 9241-10 1996, Ergonomic requirements for office work with visual display terminals (VDT´s), Part 10: Dialogue principles. ISO 9241-14 1995, Ergonomic requirements for office work with visual display terminals (VDT´s), Part 14: Menu dialogues. ISO FDIS 9241-11 1997, Ergonomic requirements for office work with visual display terminals (VDT´s), Part 11: Guidance on Usability specification and measures. ISO 9241-12 1997, Ergonomic requirements for office work with visual display terminals (VDT´s), Part 12: Presentation of Information. Kirakowski and Corbett, M. 1990, Effective Methodology for the Study of HCI. Amsterdam: North Holland. Landis, J.R. and Koch, G.G. 1978, The measurement of observer agreement for categorial data. Biometrics, 33, 159 – 174. Neugebauer, C. and Spielmann, N. 1993, Bewertungsskala Benutzbarkeit R/3. Walldorf: SAP AG. Nielsen, J. 1993, Usability Engineering. Boston: AP Professional. Nielsen, J. and Molich, R. 1990, Heuristic evaluation of user interfaces. Proceedings of the CHI ’90 Conference on Human Factors in Computing Systems, ACM Press, 249 – 256. Norman, K.L. 1991, The psychology of menu selection. Norwood NJ: Ablex. Oppermann, R., Murchner, B., Paetau, M., Pieper, M., Simm, H. and Stellmacher, I. 1988, Evaluation von Dialogsystemen. Der software-ergonomische Leitfaden EVADIS. Berlin: de Gruyter. Oppermann, R., Murchner, B., Reiterer, H. and Koch, M. 1992, Software-ergonomische Evaluation. Der Leitfaden EVADIS II. Berlin: de Gruyter. Oppermann, R. and Reiterer, H. 1992, Der Evaluationsleitfaden EVADIS II. Ergonomie & Informatik, 15, 25 – 29. Oppermann, R. and Reiterer, H. 1994, Software-ergonomische Evaluation, in E. Eberleh, H. Oberquelle and R. Oppermann (eds.). Einführung in die Software-Ergonomie. (Berlin: de Gruyter), 335 – 371. Piepenburg ,U. and Rödiger, K.-H. 1989, Mindestanforderungen an die Prüfung von Software auf Konformität nach DIN 66 234 Teil 8. Werkstattbericht 61 des Landesprogramms Mensch und Technik – Sozialverträgliche Technikgestaltung des Ministeriums für Arbeit, Gesundheit und Soziales des Landes Nordrhein-Westfalen. Düsseldorf. Prümper, J. and Anft, M. 1993, Die Evaluation von Software auf der Grundlage des Entwurfs zur internationalen Ergonomie-Norm ISO 9241 Teil 10 als Beitrag zur partizipativen Systemgestaltung – Ein Fallbeispiel, in K.-H. Rüdiger (ed.) Software-Ergonomie ’93, (Stuttgart: Teubner), 145 – 156. Prümper, J. 1997, Der Benutzungsfragebogen ISONORM 9241/10 – Ergebnisse zur Reliabilität und Validität, in R. Liskowsky, B.M. Velichkovsky and Wünschmann (eds.) SoftwareErgonomie '97. (Stuttgart: Teubner), 253 – 262. Scriven, M. 1967, The Methodology of Evaluation, in: R. Tyler, R. Gagné and M. Scriven (eds.), Perspectives of Curriculum Evaluation, (Chicago: Rand Mc Nally), 39 – 83. Shneiderman, B. 1992, Designing the User Interface: Strategies of effective Human-Computer Interaction. 2nd Edition. Reading: Addison Wesley. 14
Williges, R.C., Williges, B.H. and Elkerton, J. 1987, Software Interface Design, in: G. Salvendy (ed). Handbook of Human Factors. New York: Wiley. Willumeit, H. 1994, Evaluation einer graphischen Benutzeroberfläche auf der Grundlage der ISO 9241/10 am Beispiel der Patientendatenverwaltung ISH der SAP AG. Diplomarbeit. Fachbereich Psychologie, Universität Osnabrück.
15
Predominantly disagree
Predominantly agree
So - so
No opinion
S.6
When menu items are not available in certain situations, this fact is visually communicated to me.
1
2
Unimportant
Please rate the importance of the above item in terms of supporting your general impression of the software?
3
4
So - so
1
2
5
Important
3
4
No opinion
5
Can you give a concrete example where you cannot agree with the above statement?
... plenty more space ... Figure 1: Example item of IsoMetricsL
CASTLE(1.4)
CASTLE(1.5)
5 4,5 4 3,5 3 2,5 2 1,5
overall
suit. for learning
suit. for individualization
error tolerance
conformity w. user expect.
controllability
self-descriptiveness (*)
suitability for the task (*)
1
Figure 2: Profiles of scale means using IsoMetrics dimension measuring different prototypes
16
Suitability for the task 5 4,5 4
Scores
3,5 3 2,5
Rating
2
Weight
1,5 1 a1
a2
a3
a4
a5
a6
a7
a8
a9 a10 a11 a12 a13 a14 a15 a16 a17 Items
Fig. 3: Rating and weighting of different items of the scale "suitability for the task"
Principle Items Suitability for the task 17 Self descriptiveness 14 Controllability 14 Conformity with user expectations 9 Error tolerance 17 Suitability for individualisation 11 Suitability for learning 8 Table 1: Number of assigned items per principle
Scale Suitability for the task Self descriptiveness Controllability Control, item t12 removed Conformity with user expectations Error tolerance Suitability for individ. Suitability for learning
replacing Reliability .84 .78 .69 .72 .71
„no opinion„ mean 3.84 3.62 3.66 3.79 3.66
sd .59 .57 .53 .57 .58
Omitting „no opinion„ Reliability mean .84 3.47 .79 3.62 .60 3.83 .65 3.97 .69 3.82
.75 3.44 .48 .69 .86 2.97 .80 .89 .84 3.37 .79 .85 Table 2: Item analysis of the usability scales
17
3.44 2.91 3.47
sd .57 .54 .47 .51 .56 .44 .84 .80
Software system Occupation LATEX Pica WinWord Word Secretaries 3 -25 47 Scientists 8 -14 25 Librarians -14 2 -Other --14 12 Overall 11 14 55 84 Table 3: Crosstabulation of software systems and occupational level
Software system Construction Scale LATEX Pica WinWord Word R/3 Suitability for the task .81 (.85) .32 (.56) .33 (.53) .69 (.75) .84 Self descriptiveness .82 .83 .82 .80 .78 Controllability .80 .79 .79 .76 .69 Conformity with user expectations .41 (.75) .10 (.47) .32 (.70) .44 (.75) .71 Error tolerance .49 .71 .63 .56 .75 Suitability for individualisation .86 .81 .78 .76 .86 Suitability for learning .14 (.50) .57 (.80) .32 (.54) .37 (.54) .84 Table 4: Reliability analysis within 5 different software systems
Scale Suitability for the task Self descriptiveness
F(4, 230) 2.31 12.34
Controllability
7.98
Conformity with user expectations Error tolerance Suitability for individ.
0.87 3.78 11.55
Tail-prob. Significant Scheffé contrasts n.s -{Pica, Word, R/3symbol 125 \f "Symbol" \s 12>{LATEXsymbol 125 \f "Symbol" \s 12 {Pica, Word, R/3, LATEXsymbol 125 \f "Symbol" \s 12 n.s -{Pica, R/3symbol 125 \f "Symbol" \s 12 Suitability for learning 4.46 {Wordsymbol 125 \f "Symbol" \s 12 Table 5: Comparison of 5 different software systems
18
Scale LATEX Pica WinWord Word R/3 Suitability for the task 3.70 (0.83) 3.79 (0.44) 3.84 (0.38) 3.64 (0.68) 3.62 (0.49) Self descriptiveness 2.81 (0.72) 3.55 (0.67) 3.98 (0.36) 3.64 (0.66) 3.63 (0.53) Controllability 3.61 (0.74) 3.54 (0.69) 3.92 (0.76) 3.82 (0.68) 3.78 (0.43) Conformity with user 3.88 (0.96) 3.92 (0.70) 3.75 (0.70) 3.77 (0.77) 3.90 (0.49) expectations Error tolerance 3.07 (0.50) 3.08 (0.60) 3.63 (0.40) 3.34 (0.50) 3.48 (0.50) Suitability for individualisation 3.65 (0.76) 3.01 (0.77) 3.64 (1.02) 3.54 (0.62) 3.24 (0.62) Suitability for learning 3.22 (0.59) 3.34 (0.81) 3.74 (0.65) 3.32 (0.61) 3.60 (0.61) Table 6: Mean and standard deviations (in brackets) of the usability measure within 5 different systems Number of evoked remarks Scale CASTLE (1.4a) CASTLE (1.5a) Suitability for the task 45 16 Self descriptiveness 23 15 Controllability 16 9 Conformity with user expectations 11 5 Error tolerance 16 17 Suitability for individualisation 8 6 Suitability for learning 9 3 Table 7: Number of evoked remarks of different prototypes using IsoMetrics
Scale Remarks Mean Best item Remarks evoked by best item Suitability for the task 143 8.41 a8 23 Self descriptiveness 57 4.07 t12 10 Controllability 50 3.75 s2 11 Conformity with user 34 3.77 e9 7 expectations Error tolerance 45 2.64 f7 7 Suitability for individualisation 16 1.45 i6 5 Suitability for learning 25 2.64 l5 5 Table 8: Descriptive statistics of the evoked remarks
19
Usability scales Remark classification ST CON SD CUE ET New functionality 42 5 1 9 8 New combination of functions 36 14 -3 -Enhance user-system communication 14 -16 6 -Help system and documentation 9 2 35 2 6 Error protection 3 4 --28 Screen arrangement 31 3 3 8 -User navigation 3 26 --3 Better time efficiency 2 --4 -Others 1 1 1 -3 Table 9: Cross-tabulation of remarks and usability scale
20
SI 7 1 -2 -3 2 ---
SL 2 5 2 10 1 1 --2