AJIS
Vol. 4 No. 2
May 1997
REVISITING THE USABILITY OF GRAPHICAL DISPLAYS: AN EXPERIMENTAL APPROACH Dan Hawthorn1 & Ananth Srinivasan2 'Department of Information Systems and Computing Unitec Institute of Technology Auckland, New Zealand eMail:
[email protected] 2 Department of Management Science and Information Systems University of Auckland Auckland, New Zealand eMail:
[email protected]
ABSTRACT The paper reports on the results of an experimental study of the usability of graphical displays for decision making. The literature points to inconsistent results that have been obtained by researchers looking at this issue. Instead of trying to find the 'best format* for a given task, our approach in this study examines common factors across various graph formats. Our focus is on the cognitive demands placed on a user instead of the task itself. It was found that assisting users to extract information from graphs with design features such as a mouse driven display has a significantly positive effect on performance.
INTRODUCTION Information systems have acquired increasingly powerful display facilities but our knowledge of how best to use these for communicating numerical information to the user is remarkably limited. It is the position of this paper that the long history of conflicting results often referred to as the "Graphs versus Tables' debate, is a persuasive argument for rethinking the terms on which this debate is based. The more recent form of the debate examines the claims of competing graphical formats to best fit particular tasks (LaLomia, Coovert, and Salas; 1992). Since clear findings have failed to emerge from this line of work, we should ask whether the graph type versus task typology is a useful way to characterise the problem. Although users can easily recognise different graph formats such as line or bar graphs, this does not automatically mean that such classifications are good predictors of decision making performance. Again, the debate has its origins in a style of computer system which addressed single tasks for which potentially a best format existed. Current users of information systems are more likely to be engaged in the exploration of data and its implications. This implies that the a user is likely to be faced with a multiplicity of exploratory tasks, each of which may be supported by a different format. An alternative approach to the question of how best to display data is based on understanding the cognitive load imposed on the user by specific features of graphs such as scales, keys and legends which may be shared over several graph formats. From the viewpoint of designing useful information systems, the validity of each approach needs to be measured in terms of two related activities: (1) how useful are the results of a particular approach to a designer producing an information display, and (2) how well do the results of such a design effort suit the needs of users. The experimental study reported here contrasts different design approaches and shows that the approach of understanding the load that design features place on the user has the potential to lead to a markedly superior system. The remainder of the paper will briefly review the existing literature, describe the research aims of the study and then present the method and results before concluding with a discussion of the findings. RESEARCH BACKGROUND Studies of the merits of graphs for displaying information date back to the 1920s. Concern as to the nature of good versus bad displays has been an issue for both experimental psychologists and statisticians. The two major works on what constituted desirable graphics, Berlin (1967) and Tufte (1983) were prescriptions based on the authors' reasoning and intuition, not on experimental results. Numerous other studies have attempted to provide research based guidelines on what formats were good or bad and what discriminations readers of graphs were capable of. The topic has been adopted as part of the IS field with the emergence of readily available graphic displays as part of the toolkit of the modern computer interfaces. Reviewers such as Jarvenpaa and Dickson (1988) and DeSanctis (1984), note that the existing findings are inconsistent and plagued by methodological problems. The current state of affairs is admirably
46
AJIS
Vol. 4 No. 2
May 1997
up by Yuen (1993) when she states: "The current trend in graphs research has been to perform one shot, ad-hoc studies without any significant effort to build upon the work of others and achieve a state of relatedness among studies". Jarvenpaa and Dickson (1988), in a summary of experimental work contrasting the use of graphs versus tables in decision support problems, and Yuen (1993) in a summary of later work in the same area, show that there is no consensus of findings supporting the notion that graphical "feel" for the data automatically translates to better decision making when graphs are used as a way of presenting information. This is, on the face of it, a problem Figure 1. Line graphs and trends since if one has a graph such as Figure 1, one can clearly state that site 1 has faster growth in units sold than site 2. The obvious solutions are that either the data often does not follow such conveniently clear patterns as the example or that more realistically, typical tasks need information which does not match that which is easily available from the particular graphs that studies have used. Following the latter argument, Vessey (1991) suggested that one could look at the cognitive fit between the task and the graph format. In their review, Jarvenpaa and Dickson (1988), found some empirical support for a fit between some tasks and some graph formats for simple tasks, but were unable to extend this to more complex, decision support tasks. They also suggested that some of the earlier confusion could be resolved by looking at the type of task the display was attempting to support. Tasks depending on detailed use of point values would be better supported by tables, while tasks which required a summary of data would be better supported by graphs. Bar graphs should best fit tasks which required comparison of values while line graphs .should best support tasks which dealt with trends. However the more recent studies reported below do not provide consistent support for these recommendations. Although the area is sometimes referred to as the "graphs versus tables" debate, the concern is more generally with what presentation format is best when users need to extract information about sets of numeric data. While traditionally studies have compared graphs versus tables, there has recently been a lively interest in comparing different graph formats. In the last few years several themes can be seen in publications about graphical and tabular formats. The first theme is the development of a concern for which particular forms of display may best be used for a particular type of task. LaLomia, et al, (1992), illustrate a recent example of this approach. A second (related) theme is the pursuit of approaches from psychophysics to contrast particular graphical display formats. Typical studies are those of Legge, Gu and Luebker (1989), Spence (1990) and Spence and Lewandowsky (1991). The third theme is the use of cognitive modelling to understand the effect of features common to more than one graph format, typified by the work of Lohse (1993a, 1993b). In these studies, the techniques for research into the perception of graphs use methods derived from the initial GOMS study by Card, Moran and Newell (1980). A fourth theme is the use of graphic versus tabular displays as one factor within a study of more complex and realistic decision making. Yuen (1993) provides a review summarising the divergent findings from this approach. RESEARCH AIMS AND DERIVATION OF RESEARCH DESIGN The intention of this study is to answer two basic questions. • Is graph type a more powerful predictor of performance than variations in features common to several graph formats? • Can a design, based on pursuing detailed understanding of such common features, outperform traditional graph displays across several graph formats? Assisting Users of Graph Displays The study looked at providing assistance to users based on the details of our view of task difficulty. Extensive pilot studies on the effect of scales on point estimation indicated that two significant cognitive tasks were involved. First the subject had to fix and remember two visual positions: one on the graph and the other on the scale. This became more difficult as the distance between the two increased. Second, the labelling on the scales required the subject to estimate the position in tenths, fifteenths or twentieths of units from the labelled points. Difficulty increased as the mental subdivision of the scale became more complex. A logical issue to study in this context is the manner in which a user 47
AJIS
Vol. 4 No. 2
May 1997
may be assisted in overcoming these difficulties associated with extracting meaning from the display. It is important to gain an understanding of the efficacy of a feature such as scale, in terms of the cognitive load imposed by its subtasks. Two useful approaches of providing assistance were pursued. The first approach, a grid superimposed over a graph, can be seen as providing a traditional way of assisting a user with these difficulties. This approach, while providing assistance for interpretation of the display, ignores the issue of user control over the invocation of such assistance. An alternative approach is based on the notion of user control in the determination of whether assistance is required during task execution. Knowledge of the subtasks involved in scale reading was therefore used to form a new design for assisting graph users in scale reading. This approach utilised a mouse tool to superimpose necessary grid-like lines on the display as required by the user. Details of the implementation of this approach are presented in subsequent sections. Task Complexity Using a graph implies that the user is engaged in an overall cognitive task for which information is required. A desirable graph display allows the extraction of accurate information but also imposes minimal cognitive load on the user. This ensures that the effort of using the graph competes as little as possible with the cognitive effort being expended on the overall task. To this end, graph displays can be contrasted as to their transparency by comparing their effect over a range of tasks of varying cognitive difficulty. The more transparent display should have less effect in impeding complex tasks. To provide a test for this, the tasks addressed by subjects in the study varied over a range of complexities. Experimental Factors The dismal record of conflicting findings in this area means that a single study under limited conditions has limited external validity. The study therefore varied the conditions found to be significant in scale reading: distance from the scale and labelling interval used on the scale. The study also aimed for a degree of replication by repeating the basic study over three different graph formats; it is believed that this adds considerably to the generality of the findings. The presence of the different graph formats also allows us to examine our first research question on the contribution of graph format to task performance. Performance Traditionally experimental studies on this topic have measured the percentage of accurate responses or the time taken for task completion as performance measures. In the present study (involving point estimation from fine scales), the proximity of the estimate to the correct answer is a more appropriate indicator of performance than the number of trials in which absolute accuracy was achieved. This paper will concentrate on reporting the average size of the errors made by subjects under varying conditions (though data was also collected on time taken per trial, and the subjects' self reported estimates of: (a) maximum error in a trial and (b) stress). Time has been used as an indirect measure of the cognitive effort involved in using the display where the time unaccounted for after allowing for actions such as keystrokes, eye movements and target acquisition is presumed to indicate cognitive activity (Lohse 1993a). A point of contention here is whether task completion time is a direct and simple measure of the goodness of a display format. SUBJECTS, EXPERIMENTAL METHOD AND DETAILED DESIGN Subjects were 45 polytechnic students engaged in full time business computing studies in years 1 and 2 of a three year diploma. They were experienced Windows 3.x users. Subjects were tested for colour vision and ability to follow the experimental procedure in a preliminary practice session. The experiment was run under Windows 3.1 on 486/33 machines under VGA resolution. The experimental design consisted of nine experiments divided into three groups of three each. Each experiment differed in terms of graph format (bar graphs- Group G, curve and line graphs- Group H, and line graphs Group I) and level of assistance offered to the user (no assistance - level 1, superimposed grid on the display - level 2, and availability of a user invocable mouse tool - level 3). Subjects were randomly allocated to one of the graph type groups, 15 subjects per group, and then did the three experiments (varying assistance levels) within their group in randomly assigned order. Each experiment is henceforth referred to by a letter-number combination representing the graph type (G/H/I) and assistance level (1/2/3). Hence experiment H3, for example, refers to the curve and line graph type with a mouse tool. 48
AJIS
Vol. 4 No. 2
May 1997
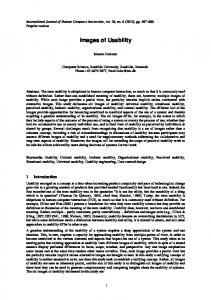
Each of the nine experiments was a randomised 2 x 2 x 3 factorial design varying the labelling interval used on the graph's scale, the distance of the decision point from the scale and the level of cognitive difficulty of the task given to the subject. Labelling intervals were set at either 10 or 20. Distances between the critical point on the graph and the scale wetc set at either 4cm or 17.5cm. Cognitive level for questions was varied as follows. • Level 1 restricted subjects to information contained in the question and within the graph. (Example: "What is the height of the red bar at site 5 ?"). • Level 2 requires subjects to use (and hold in working memory) an extra source of information in order to be able to relate the question to the graph. (Example: "What is the value of copper at site 1 ?" where a key relates the colour of the relevant line to the term "copper" used in the question). • Level 3 asks questions which extend the memory load of level 2 by additionally requiring the user to manipulate the information obtained. (Example: "What is the difference between the price of Lead at site 1 and Zinc at site 2 ?"). An experiment thus consisted of twelve trials. An extra trial was included at the beginning of each experiment to provide practice; results from this first trial were discarded from subsequent analysis. In each trial the experimental program displayed a graph. When the user clicked a button to begin, a question pertaining to the data displayed by the graph was presented and the answer, along with the time taken to obtain it was recorded. Following each trial the subject was prompted for their estimates of accuracy and stress. Screen snapshots for two such trials are shown below in Figures 2 and 3. The mouse tool allowed users to create a horizontal line from any point on the graph to the scale. The line was created by positioning the mouse cursor and pressing the left mouse button. If the mouse was moved with the button still held down, the line could be dragged to a new position. This allowed target acquisition by dragging the line onto the target. When the left button was released the line became fixed. The system labelled the line with a number indicating the position of the line on the scale. Any number of such lines could be added to a graph when the mouse tool was available. Pressing the right hand mouse button erased all lines drawn up to that point allowing the user to start again. At the end of each trial, any lines drawn previously were automatically erased. For the H3 experiment (which displayed a curve intersected by a line and both x and y scales) the mouse tool was extended to drop an additional labelled vertical line to the scale on the x axis. Graph characteristics Group H. (line + curve) Assistance level: Grid Cognitive level: 1 Distance from scale: 1 Labeling interval: 20
//hot is the y value of the line when x- IS? Answer Buttons
Tiialnunbet
fl
|of 13
Figure 2: Sample screen from Group H showing grid display with line + curve graph
49
AJIS
Vol. 4 No. 2
May 1997
Seabird Numbers by Site
Graph characteristics Group I (line graphs) Assistance level: Mouse tool Cognitive level: 2 Distance from scale: 5 Labeling interval: 10
What is the value of Gannet at site 5 Answer Buttons
Lets 13
14
15
16
17
18
19
20
21
ZZ
23
24
25
26
29
30
31
32
33
34
35
36
37
38
39
40
41
42 More
28
Next Trial
Begin
27
Trial numbet |g~] ol 13
Figure 3. Sample screen from Group I showing mouse tool used with line graph. The availability of the mouse tool was indicated by the presence of a mouse tool icon next to the answer buttons and by the mouse cursor changing to cross hairs inside the graph area. A manipulation check was included to make sure that in G3, H3 and 13, the subjects actually remembered to make use of the mouse tool. Two subjects out of 15 in G3 were found to have made no use of the mouse tool and results from these subjects were excluded from the analysis. All subjects in H3 and 13 and all remaining subjects in G3 used the mouse tool for all trials. Analysis of the results suggested that two types of error were present: small errors due to subjects' limits in reading points against scales and very large errors where the subject had misread the question and attempted to answer for the wrong line or wrong bar. Cases involving such extreme errors and/or times taken (>= 60 seconds) were excluded. Vertical distance from the baseline, answer button position, offset from scale labels and order of trial as were controlled for by randomisation and by treating these values as covariates. RESULTS Although our dependent variable of primary interest is the error amount (i.e. number of units away from the correct response), data was also collected for users' estimates of their error levels and stress, and the amount of time taken for task completion. It can be seen from Table 1 below that cognitive level, distance, graph type and level of assistance all strongly affect error amounts. Labelling interval also affected errors though not as strongly. Variable
Error amount
Error estimate
Stress
Time
Graph type
11. 227 (.000)
44. 158 (.000)
32.341 (.000)
74.232 (.000)
Assistance level
176.684 (.000)
37 1.536 (.000)
352.520 (.000)
2.505 (ns )
Cognitive level
49.262 (.000)
42.777 (.000)
29.616 (.000)
576.846 (.000)
Distance from scale
9.807 (.002)
5.565 (.01 8)
3.622 (.045)
1.813 (ns)
Labelling interval
4.182 (.041)
1.202(ns)
0.964 (ns)
1.486(ns)
n=1525 Table 1. Analysis of variance: Table shows F-values with significance levels in parenthesis. (Analysis excludes cases with extreme error values and time > 60 seconds) There are a number of significant interactions which are examined more closely below: For error amounts as the dependent variable: distance x cognitive level, F=7.339 (p=.001); assistance x graph type, F=4.507 (p=.001); assistance x cognitive level, F=4.312 (p=.002); assistance x distance from scale, F=10.457 (p=.000); assistance x labelling interval, F=5.352 (p=.005). Similar patterns were
50
AJIS
Vol. 4 No. 2
May 1997
found with the other dependent variables namely self reported estimates of error and stress, and task completion time. Table 2 and Chart 1 below focus on the impact of graph type and level of assistance provided to the subject. It is clear that the major separation of results is by level of assistance rather than by graph format. The mouse tool offers a significant improvement over the grid except for the case of line graphs (13 vs. 12) though this difference is in the same direction. The grid in turn is consistently significantly better than the unassisted condition. Bar graphs have a significant advantage over line graphs only in the mouse tool condition but this can be shown to relate to a potential design flaw in the mouse tool as used with line graphs, not to the graph formats themselves (see the concluding discussion). Although overall errors go down as the level of assistance increases it is of more interest to see how the form of assistance interacts with the source of difficulty. It can be seen in Chart 2, that both the grid and the mouse tool remove the effect of distance on error amounts compared with the unassisted condition. This is in contrast to the results shown in charts 3 and 4. The grid makes little improvement over the unassisted condition in either reducing the effects due to labelling interval or those due to cognitive level.
13
12
G2
H2
*
*
*
*
*
*
*
*
*
*
*
*
*
*
*
*
*
G3
H3
Expt
Mean
G3
.0588
H3
.4971
13
.7184
*
12
.7870
*
G2
.8571
*
H2
1.1029
*
*
Gl
1.7314
*
11
1.9176
HI
2.0536
Gl
11
Table 2. Means of error amounts by experiment (using modified LSD (Bonferroni), Asterisks indicate significant differences between the column and row group means. - .- r -
~r ; * :
95% confidence intervals on error amoant
2.0'
Graph type
Bar graph
.... 1.0'
'[_""
~r.. r .
A
I
^lie
graph
.5'
^ j
=
0.0' -.5 H
17!
170
tt
No assistance
t»
at
17!
W3
Grid displayed
174
173
Moose tool
Chart 1. Error amount: Assistance level by Graph Type
51
Line-tcarve
Vol. 4 No. 2
AJIS
May 1997
J.U1
__,
2.5'
4 1
2.0.
.
1.5'
Distance from scale
1.0'
^ If
,
.5'
'
~~{~'
251
2«
T
5
nn N
256
2S7
No assistance
200
252
Grid displayed
Mouse tool
Chart 2. Error amount by level of assistance by distance. Charts 3 and 4 may be interpreted as showing that the grid only assists problems due to distance. The grid does not ease the problem of interpolation between scale points as shown by the continued spread between easier and more difficult scaling intervals and cognitive levels in the grid condition. 2.5 2.0 1.5
Labelling Interval
T' 9
1.0
10
20 0.0 259
258
257
No assistance
294
291
24t
Mouse tool
Grid displayed
Chart 3. Error amount by level of assistance by labelling interval. d.U1
2.5'
8
2.0'
i h
1 5'
..
Level 1
i I 1.0'
—r ~
.5'
-I-"1— 1
r * -T