techniques to process large volume of data but also a need for a means to meet the ... the outcome of the data analysis by the parameters they choose,.
2014 Fifth International Conference on Intelligent Systems, Modelling and Simulation
The k-Nearest Neighbor Algorithm Using MapReduce Paradigm Prajesh P Anchalia
Kaushik Roy
Department of Computer Science and Engineering RV College of Engineering Bangalore, India.
Department of Computer Science and Engineering RV College of Engineering Bangalore, India.
other constantly to achieve a common goal. Individually each computer connected on the network is called a node and collectively all nodes form a cluster. ApacheTM Hadoop[1][2][3] is an open source application that runs on a distributed computing environment and supports processing of high volume data intensive applications. It has evolved from The Google File System[4]. Hadoop uses MapReduce[3][7] programming style that gives it the flexibility and capabilities required to process petabytes of data. Since Hadoop uses the MapRedce paradigm it achieves its goal of processing by downscaling the given data set and consequent integration of the data processed individually at separate nodes that are networked to from a cluster. Hence the computational demands are met collectively by all the nodes that form the cluster and this gives rise to increase in efficiency which is in harmony with the low costs involved in setting up the cluster. This paper contains 8 sections. The First section gives a introduction to data mining, Hadoop and Distributed Computing. The Second section gives a detailed explanation of Data Mining and popular Data Mining techniques. The Third section describes the K-Nearest Neighbor Technique. The Fourth Section describes the MapReduce Paradigm. The Fifth section talks about The Hadoop Framework and its functioning. The sixth section gives the Algorithmic Design of the K-Nearest Neighbor Technique. The Seventh section illustrates the experimental results and the observations from the implementation of the kNN Algorithm. The Eighth section concludes the paper.
Abstract— Data in any form is a valuable resource but more often than not data collected in the real world is completely random and unstructured. Hence, to utilize the true potential of data as a resource we must transform it in such a manner so as to retrieve meaningful information from it. Data mining fulfills this need. Today there is not only a need for efficient data mining techniques to process large volume of data but also a need for a means to meet the computational requirements to process such huge volume of data. In this paper we implement an effective data mining technique known as the k-Nearest Neighbor method on a distributed computing environment running Apache Hadoop that uses the MapReduce paradigm to process high volume data. Keywords— k-Nearest Neighbor, Distributed Computing, Hadoop, MapReduce, Data Mining.
I.
INTRODUCTION
Given the huge volume of data these days it is almost impossible for human analysts to derive meaningful conclusions in a short time frame. Hence data mining techniques are looked upon as tools that can be used to automate the process of knowledge discovery and define relationships and patterns of resemblance given a completely random and raw data set. The majority of data collected for analysis is unsupervised. This gives rise to the need of effective techniques that can process such unsupervised data sets and convert what might seem to be completely random and meaningless into something sensible and valuable. For instance, given a collection of hourly or daily temperatures of a place, it is possible to determine the demography of that place by grouping the temperatures based on a similarity metric. Here, we use what might seem to be a random set of temperatures to determine the demography of a place by simply grouping temperatures and finding the mode temperature of each group. Hence processing data and data mining techniques play a critically important role in technological development. Data collected is not only more often than not random but also voluminous. This poses the problem of meeting computational demand. The problem is addressed efficiently by distributed computing. Distributed computing deals with hardware and software components that are physically separate but communicate and co-ordinate with each other and work like a single system on the whole. Hence, we divide the processing of huge volume data amongst computers that are networked and work together towards a common goal. Distributed computing environment basically consists of computers connected over a network and interact with each
2166-0662/14 $31.00 © 2014 IEEE DOI 10.1109/ISMS.2014.94
II.
DATA MINING AND DATA MINING TECHNIQUES
A. Defination of Data Mining Data mining is a method that automates the detection of relevant patterns and relationships given a dataset. It uses defined approaches and algorithms to scan the given data set and predict the data trend. Data Mining is not particularly new. Statisticians have been using similar manual approaches to review data and propose a trend. However, what has changed is the volume of data today has increased immensely and thus giving rise to automated data mining techniques that investigate data trends very quickly. Users can also determine the outcome of the data analysis by the parameters they choose, thus automated data mining gives users such flexibility. B. Data Mining Techniques Data Mining has a broad spectrum of application and so there are may techniques of data mining in existence. Most commonly used techniques are Artificial Neural Networks, 513
•
Decision Trees and The Nearest-Neighbor method. Each of these techniques analyzes data differently and is discussed below. •
•
•
•
Artificial Neural Networks: These are non-linear predictive models that learn through training. The fundamental processing element of a neural network is a neuron. This building block of human awareness encompasses a few general capabilities. Basically, a biological neuron receives inputs from other sources, combines them in some way, performs a generally nonlinear operation on the result, and then outputs the final result. This model is replicated electronically forming the Artificial Neural Network. Decision Trees: These are tree like graphs or models of decisions and their possible outcomes. They consist of flow-chart like structure that has nodes to represent a test on attributes and the branches of the node represent the outcome of the test. They are often used in data analysis as they depict every possible scenario pictorially and hence patterns can easily be identified in a data set. Nearest Neighbor: This method classifies data based on a majority vote of its neighbors and it is assigned to the class most common amongst all its neighbors. This method is discussed in detail in later sections of this paper.
III.
•
C. The k – Nearest Neighbor Algorithm The k-Nearest Neighbor Algorithm involves two phases. • The Training Phase • The Testing Phase These Phases are discussed in detail in the following subsections. 1) The Training Phase kNN Algorithm does not explicitly require any training phase for the data to be classified. The training phase usually involves storing the data vector co-ordinates along with the class label. The class label in general is used as an identifier for the data vector. This is used to classify data vectors during the testing phase
THE K-NEAREST NEIGHBOR METHOD
A. An Introduction kNN is a non-parametric lazy learning algorithm. Being a non-parametric algorithm it does not make any assumptions on the underlying data distribution. This is a major advantage because majority of the practical data does not obey theoretical assumptions made and this is where non-parametric algorithms like kNN come to the rescue. kNN is also a lazy algorithm this implies that it does not use the training data points to do any generalization. So, the training phase is pretty fast. Lack of generalization means that kNN keeps all the training data. kNN makes decision based on the entire training data set. The k-Nearest Neighbor Algorithm finds applications in some of the fascinating fields like Nearest Neighbor based Content Retrieval, Gene Expressions, Protein-Protein interaction and 3-D Structure predictions are to name a few.
2) The Testing Phase Given data points for testing, our aim is to find the class label for the new point. The algorithm is discussed for k=1 or 1 Nearest Neighbor rule and then extended for k=k or kNearest Neighbor rule. a) k=1 or 1 Nearest Neighbor This is the simplest scenario for classification. Let ‘x’ be the point to be labeled. • •
B. Requisites for k-Nearest Neighbor Algorithm • •
The kNN uses training data as reference to classify the new data points collectively called testing dataset Each of the training data consists of a set of vectors and class label associated with each vector. In the simplest case, it will be either + or – (for positive or negative classes). But kNN, can work equally well with arbitrary number of classes. We are also given a single number ‘k’. This number decides how many neighbors (where neighbors is defined based on the distance metric) influence the classification. This is usually an odd number if the number of classes is 2. If k=1, then the algorithm is simply called the nearest neighbor algorithm.
kNN assumes that the data is in a feature space. More exactly, the data points are in a metric space. The data can be scalars or possibly even multidimensional vectors. Since the points are in feature space, they have a notion of distance – This need not necessarily be Euclidean distance although it is one of the commonly used methods.
Find the point closest to ‘x’ in the training data set. Let this closest point be ‘y’. Now nearest neighbor rule asks to assign the label of ‘y’ to ‘x’.
This seems too simplistic and some times even counter intuitive. This reasoning holds only when the number of data points is not very large. If the number of data points is very large, then there is a very high chance that label of x and y are same.
514
Lets take an example, if we are given a (potentially) biased coin. Toss it for 1 million times and 900,000 times the result is a head. Then most likely the next call will be head. Similar argument holds good here.
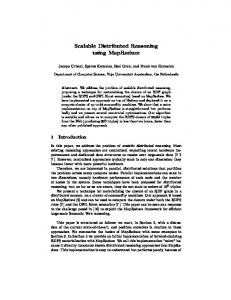
Map and Reduce are two different steps. Each step is done parallel on sets of pairs. Thus the programs is bifurcated into Map and Reduce stage., separated by data transfers between the nodes in the cluster. The Map stage takes in a function and a section of data values as input, applies the function to each value in the input set and generates an output set. The Map output is a set of records in the form of pairs stored on that node. The framework, then, sorts the outputs from the Map functions and inputs them into a Reducer. The values are aggregated at the node running the Reducer for that key. The Reduce stage produces another set of as final output. The Reduce stage can only start when all data from the Map stage is transferred to the appropriate machine. MapRedue requires input as a pair that can be serialized and therefore, restricted to tasks and algorithms that use pairs. The MapReduce framework has a single master Job Tracker and multiple Task Trackers. Potentially, each node in the cluster can be a slave Task Tracker. The master manages the partitioning of input data, scheduling of tasks, machine failures, reassignment of failed tasks, inter-machine communications and monitoring the task status. The slaves execute the tasks assigned by the master. Both input and output are stored in the file-system. The single Job Tracker can be a single point failure in this framework. MapReduce is best suited to deal with large datasets and therefore ideal for mining larger datasets of petabytes size that do not fit into a physical memory.
b) k=K or k-Nearest Neighbor This is a direct extension of 1NN. ’k’ nearest neighbors are found for a given data point from the testing data set and a it is classified by a majority vote conducted in the training data set. Typically ‘k’ is odd when the number of classes is 2. Here is an example to illustrate the majority voting. Consider a data point belonging to the testing data set. Let k = 5 and the training data set in the vicinity of the data point to be classified are 3 data points with class label C1 and 2 data points with class label C2. In this case, according to kNN the new data point will have the label as C1 as it forms the majority. Similar argument when there are multiple classes. 3) Generalising the k-Nearest Neighbor Testing Phase 1. 2. 3. 4.
5. 6.
Determine the value of ‘k’ (input) Prepare the training data set by storing the coordinates and class labels of the data points. Load the data point from the testing data set. Conduct a majority vote amongst the ‘k’ closest neighbors of the testing data point from the training data set based on a distance metric. Assign the class label of the majority vote winner to the new data point from the testing data set. Repeat this until all the Data points in the testing phase are classified. IV.
V.
THE MAPREDUCE PARADIGM
THE HADOOP FRAMEWORK
Hadoop is an open source software framework that can run large data-intensive, distributed applications. Hadoop comes with its own file system called the Hadoop Distributed File System (HDFS) and a strong infrastructural support of managing and processing huge petabytes of data.
MapReduce[11] is a programming paradigm and an associated implementation for processing and generating large datasets. A typical MapReduce program processes large volume of data on many machines. MapReduce splits data into independent chunks and the size of split is a function of the size of data and number of nodes available. The map function is user specified and processes a pair, and a reduce function that merges all intermediate values associated with the same intermediate key.[10]
A HDFS cluster consists of one unique server known as the Namenode that manages the namespace of the file system, determined the mapping of blocks to Datanodes, and regulates file access. Each node in the HDFS cluster is a Datanode that has the task of managing the storage it holds. It is these Datanodes that serve the client’s read/write requests and perform block operations, creation, deletion and replication instructions from the Namenode. HDFS is designed to deal with huge files by breaking them into blocks and replicating them across the network. The common practice is to replicate every file thrice and place two copies on two different nodes on the same rack and the third copy on a separate rack. Since HDFS is based on the Google File System and so it follows the write –once–read–many access model that does not support continuous updates of data. Hadoop’s infrastructure is built on the assumption that data will be distributed on hardware that is subject to failure. Therefore, when tasks are in progress on multiple nodes
Figure1: Pictorial Representation of MapReduce.
515
A. Algorithm for the Map Function
concurrently then it can automatically detect a failure and restart the failed tasks on other healthy nodes. When a block or a node is lost, it automatically creates a copy of the missing data from available replicas. The only single point failure is the presence of a single Namenode, it does not provide real redundancy there. Hadoop gives higher priority to high throughput than low latency and is suitable for batch processing. Hadoop is designed on the premise that moving computation is more efficient than moving data itself. Therefore, HDFS provides interfaces to move the application closer to he data – either on the same node or on the same rack thereby improving I/O bandwidth. Hadoop is not the same as relational databases as Hadoop facilitates applications such as text analysis, image processing, that require analysis of all the available data. Hadoop allows users to run executables as mappers and reducers. This is based on fault tolerant, share –nothing architecture where tasks are independent of each other. The only exception in dependence is that the reducer awaits the results of the mapper under Hadoop control. There are many open source projects built on top of Hadoop. Hive[5] is a data warehouse framework that finds its application in adhoc querying and complex analysis. Pig[7] is a data flow and execution framework produces a sequence of MapReduce programs. Mahout is used to build scalable machine learning libraries that focus on clustering, classification, mining frequent item-sets and evolutionary programming. Pydoop is a python package that provides and API for Hadoop MapReduce and HDFS.
B. Algorithm for the Reduce function VI.
ALGORITHMIC DESIGN OF THE K-NEAREST NEIGHBOR TECHNIQUE IN THE MAPREDUCE PARADIGM
Prior to implementing the K-Nearest Neighbor technique lets see how to handle the input and output for the implementation. Since we are using the MapReduce paradigm we must make sure that the input is form of a pair. The Map routine performs the function of calculating the distance of each data point with the classes and lists it out. The Reduce routine then chooses the first ‘k’ Neighbors in increasing order of distances and conducts a majority vote. After which it sets the data point’s label as the label of the class with the majority vote count. Now, we need to organize the input and output directories. To do this let us name the directory that holds the data vectors as vectors and the training and testing data as trainFile and testFile. Having organized our input/output directories and training and testing data ready, we can apply the k-Nearest Neighbor technique in a distributed environment by following the algorithms discussed below to design the Map and the Reduce functions for the k-Nearest Neighbor Technique.
516
C. Algorithm to Implement the Map and Reduce Functions
VII.
B. Implementation Of Sequential and MapReduce kNN The training data points were stored in a file called trainFile and the testing data points were stored in testFile. Once the data points were ready, the required statistical parameters, such as, iteration counters and timers were initialised. Next, the required files were copied into the Hadoop Distributed File System (HDFS). The Hadoop MapReduce iteratively until all the data points in the testing dataset were classified. We started with 500 data points of about 5KB in size and gradually increased the number of points up to 13 million about 125MB in size. Repeating the experiment five times helped us to reliably monitor the time taken to classify, ensure we could replicate the result with stability and identify any unexplainable circumstances. The Algorithm worked well with the data-set chosen for experimentation. While the main purpose was to identify the suitability of using MapReduce for kNN, there was also a need to study its effectiveness. Therefore, a simple sequential kNN classification program to classify the same set of data points without MapReduce was also implemented. In this method, we stored the data points both training and testing in local files. The sequential kNN was then applied to assign the testing data points to the closest class label. We noted the time taken to converge to the final classification, number of iterations and the final classes.
THE EXPERIMENTAL RESULTS AND ANALYSIS
A. Experimental Setup The k-Nearest Neighbor technique was implemented on a setup consisting four nodes connected over a private LAN. One node was used as a Namenode and Job Tracker the other three other nodes were used as Datanodes and Task Trackers. . All the four nodes had Intel i3 processors with 2.40Ghz and 2 GB memory. The Operating System running on all the 4 nodes was Ubuntu version 12.04. The programming language used to code the kNN Algorithm in both sequential and MapReduce Implementation was JAVA. Apache Hadoop version 1.0.4 was installed on all the nodes and the single node and consequent multinode configurations were done according to the guide found at [8][9].
C. Experimental Results and Observations
Figure 3: Graph of Sequential kNN vs MapRed kNN for a small sized dataset.
Figure 2: The Experimental Setup
517
The first observation made from the experimental results was that the simple sequential kNN classification took much lesser time compared to the MapReduce kNN classification for smaller datasets. This fact is illustrated by the graph in Figure 3. The graph in Figure 4 shows a comparative plot of the time taken for up to 12 million points using MapReduce and sequential kNN.
environment. This was done to remove the limitation of computational capability by having a cluster of systems working together. This not only eliminates the limitation of computational demands but also speeds up the processing time by having more than one computer interconnected over a network working on the given task. Also, in the experimental phase we compared MapReduce kNN with sequential kNN and found that MapReduce kNN out performs the sequential kNN with datasets of Larger Size. Hadoop being platform independent gives the user the flexibility to have heterogeneous system to be interconnected. Hence the user can use already existing hardware to setup a Hadoop cluster. My current research work involves implementing more efficient data mining algorithms on the distributed environment. Also, comparing the performance of the algorithms in all kinds of cluster setup. This includes both homogenous and heterogeneous clusters. Along with the study of performance, the study of behavior of various algorithms with variations in size and computational methods is also an interesting area of research. ACKNOWLEDGMENT We would like to thank the continuous guidance and encouragement of all the Professors and support staff at RV College Of Engineering and they’re ever ready to lend a helping hand. REFERENCES [1] [2] [3]
Apache Hadoop. http://hadoop.apache.org/ J. Venner, Pro Hadoop. Apress, June 22, 2009. T.White, Hadoop: The Definitive Guide. O’Reilly Media, Yahoo! Press, June 5,2009. [4] S. Ghemawat, H. Gobioff, S. Leung. “The Google file system,”In Proc.of ACM Symposium on Operating Systems Principles, Lake George, NY, Oct 2003, pp 29–43. [5] A. Thusoo, J. S. Sarma, N. Jain, Z. Shao, P. Chakka, S. Anthony, H. Liu,P. Wyckoff, R. Murthy, “Hive – A Warehousing Solution Over a Map-Reduce Framework,” In Proc. of Very Large Data Bases, vol. 2 no. 2,August 2009, pp. 1626-1629. [6] F. P. Junqueira, B. C. Reed. “The life and times of a zookeeper,” In Proc. of the 28th ACM Symposium on Principles of Distributed Computing, Calgary, AB, Canada, August 10–12, 2009. [7] A. Gates, O. Natkovich, S. Chopra, P. Kamath, S. Narayanam, C.Olston, B. Reed, S. Srinivasan, U. Srivastava. “Building a High-Level Dataflow System on top of MapReduce: The Pig Experience,” In Proc. of Very Large Data Bases, vol 2 no. 2, 2009, pp. 1414–1425R. Nicole, “Title of paper with only first word capitalized,” J. Name Stand. Abbrev., in press. [8] Description if Single Node Cluster Setup at: http://www.michaelnoll.com/tutorials/running-hadoop-on-ubun tu-linux-single-node-cluster/ [9] Description of Multi Node Cluster Setup at: http://www.michaelnoll.com/tutorials/running-hadoop-on-ubun tu-linux-multi-node-cluster/ [10] Prajesh P. Anchalia, Anjan K. Koundinya, Srinath N. K., "MapReduce Design of K-Means Clustering Algorithm," icisa, pp.1-5, 2013 International Conference on Information Science and Applications (ICISA), 2013 [11] J.DeanandS.Ghemawat.Mapreduce:Simplieddataprocessing on large clusters.Communications of the ACM, 51(1):107-113, 2008. [12] J.Ekanayake,H.Li,B.Zhang,T.Gunarathne,S.H.Bae,J.Qiu, and G. Fox. Twister: A runtime for iterative mapreduce. In Proceedings of the 19th ACM International Symposium on High Performance Distributed Computing, pages 810-818. ACM, 2011.
Figure 4: Graph of Sequential kNN vs MapRed kNN for a large sized dataset.
It shows that Hadoop MapReduce performed better than sequential kNN from 8 million data points which is about 60MB in size. By 12 million points and 90MB size, it was found that Hadoop completed kNN classification 150 seconds ahead of sequential kNN. VIII. CONCLUSION AND ON GOING RESEARCH In today’s fast paced world, the rate of information exchange is tremendously high. We look for quick and robust methods to enhance and improve the way in which information is exchanged keeping in mind overall user experience. The most difficult task is to strike a balance between efficient performance and a high degree of userfriendliness. To achieve these it is important to understand the data collected so as to device an efficient way to handle this such data. This is where efficient data mining techniques are required. Data Mining can be thought of as a tool to extract diamonds of knowledge from the past and predict the future outcomes. The k-Nearest Neighbor technique is ranked in the top ten data mining methods. In this paper we implemented the kNearest Neighbor technique in Hadoop MapReduce
518