service life of a polymeric material exposed in a service environment have been a ... the field data based on chemical degradation via a model-free heuristic .... Other custom software programs were used to examine and analyze the IR and.
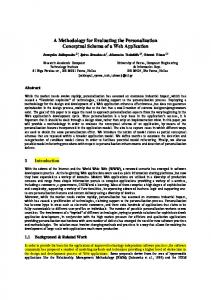
Linking Accelerating Laboratory Test with Outdoor Performance Results for a Model Epoxy Coating System Xiaohong Gu1, Brian Dickens1, Debbie Stanley1, Walter E. Byrd1, Tinh Nguyen1, Iliana Vaca-Trigo2, William Q. Meeker2, Joannie Chin1 and Jonathan W. Martin1 1
Materials and Construction Research Division,
National Institute of Standards and Technology, Gaithersburg, MD 20899 2
Department of Statistics
Iowa State University, Ames, IA 50011
1
ABSTRACT
Laboratory and outdoor exposure results have been mathematically linked for a model epoxy coating system using a reliability-based methodology. Accurate and timebased measurements on both exposure environments and degradation properties for epoxy specimens exposed to accelerated laboratory weathering device and outdoor environments were performed. Laboratory weathering tests were conducted on the NIST SPHERE (Simulated Photodegradation via High Energy Radiant Exposure), a device in which spectral ultraviolet (UV) wavelength, spectral intensity, temperature, and relative humidity (RH) can be precisely and accurately controlled over time. A factorial design consisting of 4 temperatures, 4 RH levels, 4 UV spectral wavelengths, and 4 UV spectral intensities was used in exposing the epoxy samples on the SPHERE to assess the effects of critical environmental factors on chemical degradation of this material. Outdoor exposure experiments were carried out on the roof of a NIST laboratory located in Gaithersburg, MD. Panel temperature and ambient RH of the outdoor exposure and the solar spectrum were used to characterize the roof environment at 12 minute intervals. The chemical degradation for specimens exposed on the SPHERE and in the outdoor environments was quantified by transmission FTIR and UV-visible spectroscopies. Tests using FTIR absorbance ratios showed that the mechanisms of chemical degradation for samples exposed outdoors and in the laboratory were similar. Two approaches, a modelfree heuristic approach and a mathematical predictive model, were used in linking field and laboratory exposure results. Successful linkages have been made using both approaches. The study strongly demonstrated that the reliability-based methodology is capable of linking laboratory and field exposure data and predicting the service life of this type of polymeric material.
2
INTRODUCTION
Attempts at linking field and laboratory exposure results and at predicting the service life of a polymeric material exposed in a service environment have been a high priority research topic of the polymeric materials community for over a century.1-3
At
present, the only accepted way of assessing the performance of a new product is to expose it for many years at one or more “standard” field exposure sites such as Florida and Arizona. Performance data generated from such experiments, however, are neither repeatable nor reproducible, since the weather never repeats itself over any time scale or at any location.1 Further, the results are necessarily tied to the geographic location of the exposure. Laboratory weathering experiments are typically designed to simulate and accelerate outdoor degradation by exposing materials for extended periods of time to high UV irradiance, elevated temperature and relative humidity environments. However, the lack of rigorous temporal and spatial experimental control over each of these weathering factors within and among laboratory exposure devices has made it difficult, if not impossible, to correlate results between laboratory devices and to link laboratory and field exposure data.4-7 The sources of experimental errors in laboratory exposure devices have been well-documented and are largely associated with the emission physics of line light sources.1,5 Deficiencies include not taking into account aging of the light source,8, 9 non-uniform spatial irradiance of the specimens,5 differences in the spectral emission distributions of the sun and laboratory light sources, and the inability to independently, temporally and spatially monitor and control the temperature and moisture content of the exposed specimens.8, 9 Reliability-based methodology has been applied successfully in the fields of electronics, medicals, aeronautic and nuclear industries.10, 11 It was introduced into the field of polymeric materials by Martin et al.1, 12, 13 To date, a number of successful studies in polymer degradation using this approach have been published.12-16 Unlike the current descriptive methodology,17 the reliability-based methodology is a measurement intensive, predictive approach in which laboratory exposure experiments are experimentally designed to include the factors influential in degradation during field exposures, and the data generated from these experiments are viewed as the standard of
3
performance against which field exposure data are compared. As such, laboratory exposure equipment and experiments must be designed to be able to independently, precisely and accurately control each exposure variable over extended periods of time. Field exposure experiments are also viewed as a laboratory experiment; albeit one in which individual weathering factors can not be controlled, but each can be monitored and characterized in the same manner and with the same degree of precision and accuracy as its equivalent laboratory exposure variable. Successful linkage between the laboratory and field exposure results for a polymeric coating will be demonstrated in this paper using the reliability-based methodology. The paper consists of four parts: 1) assessing the effects of critical environmental conditions on the photodegradation of specimens exposed on the SPHERE (Simulated Photodegradation via High Energy Radiant Exposure), 2) characterization of chemical degradation for specimens exposed outdoors; 3) comparison of the degradation mechanism for SPHERE and outdoor exposures, and 4) linking the laboratory results to the field data based on chemical degradation via a model-free heuristic approach and a mathematical predictive model . EXPERIMENTAL ∗
Materials and Specimen Preparation A model epoxy coating was selected for this study. It was an amine-cured epoxy selected was a stoichiometric mixture of a pure diglycidyl ether of bisphenol A (DGEBA) with an epoxy equivalent of 172 g/equiv (DER 332, DOW Chemical) and 1,3bis(aminomethyl)-cyclohexane (1,3 BAC, Aldrich). Appropriate amounts of toluene were added to the mixture to obtain proper viscosity for spin coating, after which all components were mixed using a mechanical stirrer for 7 minutes. After being degassed in a vacuum oven at ambient temperature to remove air bubbles, the epoxy/curing agent /solvent mixture was applied to the substrates. Thin films of approximately 6 μm thick ∗
Instruments and materials are identified in this paper to describe the experiments. In no case does such identification imply recommendation or endorsement by the National Institute of Standards and Technology (NIST).
4
were obtained by spin casting the solution onto calcium fluoride (CaF2) substrates at 209 rad/s (2000 rpm) for 30 s. All samples were cured at room temperature for 24 h in a CO2free dry glove box, followed by heating at 130 °C for 2 h in a circulating air oven. The glass transition temperature, Tg, of the cured films was 123 o C ± 2 oC, as estimated by dynamic mechanical analysis. The thickness and cure state of the films were assessed by FTIR and UV-visible spectroscopies. Only films meeting predetermined specifications for thickness and cure were selected for laboratory or field exposure so that the specimen population would be sufficiently homogeneous.
Outdoor Experiments Outdoor UV exposures were conducted on the roof of a NIST laboratory located in Gaithersburg, Maryland. Specimens were first loaded into multiple-window exposure cells, which were then placed in an outdoor environmental chamber at 5 degrees from the horizontal plane and facing south. The bottom of the chamber was made of blackanodized aluminum, the top was covered with borofloat glass, and all sides were enclosed with a breathable fabric material that allowed water vapor to permeate into the chamber but not dust. UV-visible spectral results showed that the borofloat glass did not “solarize”, i.e., change transmission in the solar spectrum range, over the exposure times. The borofloat chamber cover was used to minimize deposits of dust, particles and airborne containments on the specimen surfaces that would affect the transmission of the specimens and prevent studies of microstructures of degraded samples by nanoscale techniques (data shown elsewhere) The specimen exposure chamber was equipped with a thermocouple and a relative humidity sensor, and temperature (T) and relative humidity (RH) within the chamber were recorded once every minute. Gaps due to equipment failures in the T/RH log of the roof environment were filled in and corrected as needed using T and RH values from nearby Dulles Airport and from a neighboring group at NIST 18. Outdoor UV exposures were carried out from June, 2002 through April, 2006. Twenty groups of specimens were placed in a covered outdoor environmental chamber starting at different times of the years. The exposed groups were designated G1 through G20 where G1 indicates the first exposure group while G20 represents the last exposure
5
group. The starting months covered most months of the year. Every fourth month, a separate and independent set of specimens was exposed outside chamber to assess changes occurring in the real outdoor exposure. The exposure conditions for specimens outside chamber were measured in the same manner as those in the covered chamber. Because the weathering conditions, and hence, the rates of degradation of the epoxy films, exposed at different starting dates differed, the exposure durations required to achieve the same amount of degradation for each group were different. The chemical degradation of the specimens exposed to outdoor environments was measured using FTIR and UV-visible spectroscopies at regular intervals (e.g., every 3-4 days). In estimating the solar dose (energy incident upon the specimen) on the roof, all radiation was assumed to come directly from the sun and none from the blue sky. The dose was estimated from the STAR (System for Transfer of Atmospheric Radiation) spectra of the sun supplied by the Smithsonian Institution (Edgewater, MD), which was corrected for solar inclination and, where appropriate, for reflection at a cover glass, using the equations in Duffie and Beckman.19 The dosage (energy absorbed by the specimen) was corrected for the angle at which the rays traversed the specimen because the UV-visible spectra used in the estimation of dosage were measured normal to the specimen.
High Radiant Laboratory Exposure The NIST SPHERE is an integrating sphere-based weathering device that effectively reduces or eliminates all known sources of experimental error occurring in laboratory weathering devices and does not appear to introduce any new source of experimental error.20,
21
The SPHERE is a uniform light source in which panel
temperature, exposure relative humidity, spectral irradiance, and spectral radiant intensity can be independently, precisely, and accurately controlled over a wide exposure ranges and over time. Radiant uniformity of the SPHERE is ensured by the optical physics underlying integrating sphere technology. Currently, the SPHERE is equipped with six high intensity light lamps; the maximum total intensity in the range between 290 nm and 400 nm achievable is equivalent to 22 suns. Each lamp is equipped with a dichroic reflector that effectively removes most of the long wavelength visible and infrared
6
radiation. Ultraviolet radiation below 290 nm is eliminated from the reflected beam by positioning a cut-off filter between the lamps and the interior of the integrating sphere. The homogenized spectral radiant flux on the SPHERE is monitored continuously from 290 nm to 800 nm using a UV-visible spectrometer. Microprocessors control the temperature within each exposure chamber at individual values over extended periods of time (i.e., thousands of hours) from 25°C to 75°C with a precision of ± 0.1°C, while RH is independently controlled from 0 % to 95 % within ± 0.2%. The NIST SPHERE is equipped with 32 exposure chambers, each of which can expose multiple specimens can be exposed. In the current configuration, 17 specimens are exposed within each chamber. Effectively, therefore, the NIST SPHERE is capable of simultaneously exposing 544 specimens (32 chambers x 17 specimens per chamber). Each specimen can be exposed to a unique, well-delineated and well-controlled exposure environment. The temperature and relative humidity are controlled for each exposure chamber using a custom network of microprocessor-based systems. Spectral radiant flux and spectral irradiance are controlled for each specimen by inserting interference and neutral density filters in front of each specimen. A factorial design of four temperatures, four relative humidity levels, four spectral wavelengths and four spectral intensities was used for this study. The four temperatures were 25°C, 35°C, 45°C and 55°C. The four relative humidities were 0 % RH, 5% RH, 50% RH and 75% RH. The four wavelengths were controlled by four bandpass (BP) filters with nominal center wavelengths of 306 nm, 326 nm, 353 nm and 450 nm, having full-width-half maximum values of ± 3 nm, ± 6 nm, ± 21 nm, and ± 79 nm, respectively. The spectral intensity for each BP filter was modified by placing a neutral density (ND) filter (transmissions nominally 10 %, 40 %, 60 % or 100 %) in the beam path. Within each treatment, four replicates were exposed. The chemical degradation of each specimen was monitored at regular intervals (e.g., once every 3-4 days) using FTIR and UV-visible spectroscopy and the corresponding damage, dose and dosage were calculated. In this investigation, IR peak absorbance values were used to follow damage, although several other quantities, included IR peak area and yellow index, also can utilized.
7
Measurements FTIR Chemical degradation of the epoxy coatings was measured every few days by FTIR transmission using a PIKE auto-sampling accessory (PIKE Technologies). This automated sampling device allows efficient and rapid recording of the FTIR transmission spectra. Since the exposure cell was mounted precisely on the auto-sampler, errors due to variation of sampling at different exposure times are minimized. The auto-sampler accessory was placed in a FTIR spectrometer compartment (Nicolet 560x) equipped with a liquid nitrogen-cooled mercury cadmium telluride (MCT) detector. Spectra were recorded at a resolution of 4 cm-1 and were the average of 128 scans. The peak height was used to represent IR intensity, which was expressed in absorbance.
UV-visible Spectroscopy In this study, the outdoor and laboratory chemical degradation results are linked using the total effective dosage model. The total effective dosage13, D, defined as the radiation that is incident upon and absorbed by the specimen, can be calculated via: t
D total (t ) =
λ max
∫0 ∫λ E o (λ , t )(1 − e
− A( λ )
) φ (λ ) dλ dt
min
where Dtotal (t) is the total effective dosage at time t; λmin and λmax are the minimum and maximum photolytically effective wavelengths; E0 (λ, t) is the spectral UV irradiance of the light source at wavelength λ and time t; A (λ, t) is the spectral absorption of specimen at wavelength λ and time t, and φ(λ) is a spectral quantum efficiency at wavelength λ. To obtain the dosage, the spectra irradiance of the light source, the spectral transmittance of the neutron density filters and the band pass filters, and the UV-visible absorbance spectra of the specimens coated on CaF2 were recorded between 190 nm and 820 nm at a resolution of 2 nm using an HP 8452a UV-visible spectrometer equipped with a PIKE auto-sampling accessory. UV-visible measurement was taken each time as the FTIR measurements. To convert the UV-visible spectrometer signal into irradiance units (W/m2), the HP 8452a UV-visible spectrometer was calibrated in NIST’s Spectral Irradiance and Radiance Calibrations with Uniform Sources Facility.
8
The spectra were loaded into database tables using custom software22 developed at NIST. Other custom software programs were used to examine and analyze the IR and UV-visible spectra, and to calculate dose, dosage and the damage (changes in the absorbance of IR bands). 23 Basically, multiplying the spectra irradiance of the SPHERE UV source by the spectra transmittance of the filters (ND and BP) and the elapsed time yields the dose at a given wavelength. The dose is then convoluted with the UV-visible absorbance spectrum of the specimen to yield the dosage. Integrating over the BP filter range gives the total effective dosage for that filter range.
RESULTS AND DISCUSSION
1. Exposure on SPHERE (a) Chemical Changes during Laboratory Exposure Typical FTIR absorbance spectra of the amine-cured epoxy as a function of exposure time at SPHERE are presented in Figure 1, along with difference spectra obtained by subtracting the spectrum of the unexposed specimen from those of the exposed specimens after baseline correction. The bands at 1250 cm-1, 1510 cm-1, 2925 cm-1 are typically observed for an amine-cured epoxy before and after UV exposure. The 1250 cm-1 band is attributed to C-O stretching of aryl ether, the 1510 cm-1 band to benzene ring stretching, and the 2925 cm-1 band to CH2 anti-symmetric stretching.24, 25 Decreases in intensities of these bands indicate that chain scission and mass loss in the films have taken place during UV exposure. The spectra also show the formation of new chemical species in the 1620 cm-1 to 1800 cm-1 region as a result of exposures. Two prominent bands at 1658 cm-1 and 1728 cm-1, which have been attributed to C=O stretching of amide24,
25
and ketone24,
25
or aldehyde26, respectively, are due to the
formation of oxidation products. The band near 1728 cm-1 is very broad, indicating the formation of a variety of carbonyl products, such as aldehyde, ketone, acids, and esters. 24-30
The OH stretching bands near 3400 cm-1 also shift to lower frequency,
indicating hydrogen bonding, and new bands appear around 3225 cm-1. The above IR
9
trends are in good agreement with the photo-oxidative mechanisms proposed by Bellinger, et al. 24, 25 and Rivaton, et al. 28, 29 for epoxy cured with aliphatic amines. Figure 2 displays changes in the peak absorbance of the bands of interest as a function of SPHERE exposure time. Results from four replicates are presented. The tightness of these four curves is typical, indicating the accuracy and precision of preparation, selection, measurement of specimens and the control environments. The intensities of photooxidation bands (1658 cm-1, 1728 cm-1) increase with exposure time until a plateau has been reached, after which the curves change direction. Continuous losses in the intensities of bands at 2916 cm-1, 1250 cm-1 and 1510 cm-1 are attributed to chain scission. Since the high flux UV radiation is so aggressive, it is nearly impossible to keep the optical components of an exposure condition at the same level over extended periods of time. Therefore, dose or dosage is a better metric than time because these variations are taken into account. Figure 3 shows chemical change as a function of dose for the specimens shown in Figure 2. Compared to the IR absorbance plot using exposure time, Figure 3 reveals the effect of the actual UV irradiance upon the specimens on chemical degradation regardless of changes of light source or total radiation.
The
similarity between the plots in Figure 2 and Figure 3 indicates that the light intensity of the SPHERE was mostly constant during that exposure period.
(b) Total Effective Dosage In cases where absorbed energy causes a specimen to degrade, the total effective dosage (hereafter referred to as “dosage”) is probably the most scientifically accurate metric for quantifying the severity of damage in the reliability-based methodology. Figure 4 shows the chemical changes as a function of dosage. The slopes of these curves decrease gradually with increasing dosage, probably due to the shielding effect of the degradation products as well as the depletion of the initial material. The initial slope of the curve is defined as the apparent spectral quantum yield and can be used to evaluate the initial efficiency of the radiation at different wavelengths.31 Later in this paper, we will estimate the relative efficiency of different wavelengths of the spectral UV using the entire damage-dosage curve.
10
(c) Effect of Critical Exposure Parameters on Chemical Degradation Since many combinations of the environmental conditions were carried out in this study, only representative results of the different treatments are presented to provide an indication of the affect of different environmental factors on this epoxy material. Figure 5 illustrates the intensity change of four IR bands as a function of dosage for specimens exposed on the SPHERE at 25 °C and approximately 0 % RH under 326 nm BP filters and four ND filters transmittance values of 10 %, 40 %, 60 %, and 100 %. Four replicates were exposed for each treatment. The curves for all irradiance levels superimpose onto a master curve, suggesting that the dosage needed to cause a given level of damage is independent of the intensity of the incident irradiance, suggesting that the reciprocity law.is obeyed for this material over the ranges of temperature, relative humidity and irradiance used. Similar behavior has been reported for the UV degradation of an acrylicmelamine polymer.32 The effect of spectral wavelength on the efficiency of photodegradation of aminecured epoxy can be seen in Figure 6, in which specimens were exposed at 25 °C and 0 % RH under 306 nm, 326 nm, 354 nm and 452 nm BP filters and at a ND of 100%. The expanded initial portion of the curve (the dosage is up to 1.6×10⁴ kJ/m2) is shown in the inset. As expected, the longer the wavelength, the lower the damage per unit dosage. The damage-dosage curves for all wavelengths can be nearly superimposed when the dosages for the other curves are scaled to that of the curve for 452 nm, especially for the initial dosage range. The shift factors for the 306 nm, 326 nm, 354 nm and 452 nm BP filter ranges in Figure 7 are 100:50:6:1, respectively, and represent the relative efficiencies of the different wavelengths. The ratios for the four wavelengths obtained from damagedosage curves for other conditions are very similar, indicating that the relative photodegradation efficiencies of the wavelengths are independent of UV irradiance intensity, specimen temperature and humidity for this material. Relative efficiencies obtained from other IR damage bands also follow this trend. The effect of temperature on photodegradation is illustrated in Figure 8A, which shows damage versus dosage for specimens exposed on the SPHERE at different temperatures under 326 nm BP filters and 100% ND filters and at 0 % RH. Although higher temperature produced higher damage per unit dosage for all major IR bands, the
11
rate of increase in the damage efficiency seems to be lower when the temperature is above 35 °C. Compared to the exposure at 0% RH, a similar temperature effect is observed for specimens exposed at 75% RH. As shown in Figure 8B, no visible enhancement of damage efficiency is observed when the temperature increases from 35 °C to 55 °C for the band at 1250 cm-1, and only a slight increase is observed for the band at 1658 cm-1. The results indicate that the temperature dependence of the photodegradation is not Arrhenius, and different degradation modes response differently to the temperature change. The effect of relative humidity on the photodegradation of amine-cured epoxy is displayed in Figure 9, where the specimens were exposed on the SPHERE with 100% ND filters and 326 nm BP filters at 25 °C under four different RH levels. When RH is increased from 0 % RH to 25 % RH, the damage per dosage decreases substantially for the degradation modes corresponding to the bands at 1510 cm-1, 1728 cm-1 and 1250 cm-1, but only decreases slightly for the band at 1658 cm-1. The humidity effect seems to slow down when the RH is higher than 25 % RH. Among the four IR bands, the 1728 cm-1 band shows the most sensitivity to changes in RH. The different responses of the different IR bands on the humidity changes result from the differences in degradation mechanisms. The carbonyl absorption band at 1728 cm-1 has been attributed to the formation of ketone products by Bellinger24, 25 and to aldehyde formation by Patterson-Jones.26 In both cases, the products are formed through the release of water molecules by dehydration of the hydroxyl groups (Schemes 1 and 2 in Figure 10). The process of water release may be hindered at high RH so that the formation of the products corresponding to 1728 cm-1 band would be retarded with respect to the same amount of dosage at dry exposure condition. However, it is uncertain why changes in other degradation modes, such as the loss of 1250 cm-1 band, which has been attributed to chain scission of C-O stretching of aryl ether, and the loss of 1510 cm-1 which has been attributed to the chain scission of the benzene ring, also decrease substantially as the RH increases from 0 % RH to 25 % RH. One possibility is that when the degradation mode corresponding to 1728 cm-1 is impeded, other reactions such as chain scission are subsequently affected.
12
(d) Effect of Critical Exposure Parameters on Mechanism of Chemical Degradation Effect of critical exposure parameters on degradation mechanism was investigated using IR absorbance ratio method developed by Gerlock et al. 33 They used this method to compare the weathering chemistry of automotive coatings exposed to accelerated laboratory environments with different light sources. When the peak ratio plots show a similar trend, the degradation mechanisms may be assumed to be similar. Figure 11 shows the effect of the incident wavelength on the ratio plots of the chemical changes of 1250 cm-1 vs. 1510 cm-1, 1728 cm-1 vs. 1658 cm-1, 1510 cm-1 vs. 1658 cm-1, and 1510 cm1
vs. 1728 cm-1. The specimens were exposed on the SPHERE at 45 °C, 25% RH, and
100% irradiance level with 306 nm, 326 nm, 354 nm, and 452 nm BP filters. Results from four replicates for each exposure condition are shown. The curves for all wavelengths coincide, except that the tails of the curves corresponding to severe degradation are slightly scattered. At severe degradation levels, the amounts of carbonyl products (1658 cm-1 and 1728 cm-1) decrease, probably due to secondary chemical reactions and physical depletion of these products, while the absorbance at 1510 cm-1 continues to grow, as reflected in the ratio plot for those bands. It appears that the mechanism of chemical degradation is independent of the wavelength of the UV irradiation for this material, though different wavelengths of the spectra UV have different efficiencies for photodegradation. This data has laid the groundwork for an ongoing study to more rigorously validate the additivity law. The effect of temperature on degradation mechanism is shown in Figure 12, where the ratios of different chemical changes for specimens exposed on the SPHERE with 353 nm BP filters and 100% ND at four temperatures (25° C, 35 ° C, 45 ° C and 55 °C) and 25% RH are presented. Sixteen (16) curves are displayed in each ratio plot. As was the case for the incident wavelength, the different temperatures do not substantially alter the ratios of the chemical changes from 25 °C to 55 °C. The same trend is observed for the intensity effect of UV irradiance on the ratios of different chemical changes. However, an obvious effect of relative humidity on the ratios of chemical changes is observed, particularly in the plots associated with the 1728 cm-1 band. As shown in Figure 13, for both plots of 1250 cm-1 vs. 1510 cm-1 and 1510 cm-1 vs. 1658 cm-1, the
13
curves essentially superimpose for specimens exposed to SPHERE under different humidities. On the other hand, the ratios for 1728 cm-1 vs. 1658 cm-1 and 1510 cm-1 vs. 1728 cm-1 do not superimpose but monotonically drop with increasing RH.
This
-1
phenomenon suggests that the band at 1728 cm is more sensitive to the humidity than the other three bands and the relative humidity influences the ketone/aldehyde formation involved in this particular degradation mechanism.
2. Outdoor Exposure Typical temperature and RH values inside the outdoor exposure chamber and outside the chamber are shown in Figures 14 and 15, respectively. The temperatures and RH’s within and outside the rooftop chamber changed dramatically over the diurnal cycle. During the day, the temperature within the chamber is sometimes as much as 25 °C higher than the surrounding ambient temperature. The RH both inside and outside the chamber frequently reached 100 % RH, mostly at night. However, the environment within the chamber tends to be drier than the observed ambient RH during the day, due to the higher temperature in the chamber. The chemical degradation of amine-cured epoxy exposed in the outdoor chamber was monitored by FTIR spectroscopy in transmission mode in the same way as for the SPHERE-exposed specimens. Chemical changes as a function of exposure time for four groups exposed in the outdoor environmental chamber are presented in Figure 16. These four groups were selected as being representative of the four seasons. The starting times were September 30, 2002 for G4, December 24, 2002 for G7, March 4, 2003 for G9, and June 6, 2003 for G12. As expected, the four groups exhibit different rates of chemical degradation with respect to exposure time. The initial rate of chemical change for each group depends on the starting dates; the summer group (G12) is fastest and the winter group (G4) is the slowest. When the intensities of the IR bands associated with degradation are plotted as a function of dosage (Figure 17), the effect of the solar spectra of the different seasons is minimized; therefore, the differences between the curves are mainly due to temperature and humidity effects. The relative efficiencies of different wavelengths have been taken into account in estimating the total dosage. As shown in Figure 17, to achieve the same amount of damage, the lowest dosage is needed for the
14
summer group (G12), while the highest dosage is needed for the winter group (G4). The curves in Figure 17 are much closer than those in Figure 16, showing that the damage is dominated by the dosage rather than the exposure time and that the damage-dosage plot is more meaningful than the damage-time plot in the case where degradation at different outdoor environments are compared. To understand the influence of the covered exposure on the chemical degradation, the results obtained from the specimens exposed in the outdoor chamber are compared with those from specimens exposed outside the chamber, as shown in Figure 18. The changes in the IR bands are quite similar under the two conditions, except that the intensity of the band at 1658 cm-1 for specimens inside the chamber (G11) is slightly enhanced compared to those exposed to real outdoors (G11-Out). Similar results are observed for the other groups. Because the average temperature in the chamber tends to be higher than ambient, the increase in the 1658 cm- 1 product is probably due to the elevated temperature, a result that is consistent with the laboratory exposure data. The chemical degradation of samples exposed to outdoor environments is clearly similar to that of specimens exposed on the SPHERE. When the outdoor environment, i.e., T, RH and the solar spectrum, is monitored, the SPHERE results can be used to predict the results of outdoor exposures on the basis of total dosage or the dose. If dose is used, the course of photodegradation can be predicted for any documented environment and there is no need to expose the specimens in many different environments. When the damage history of specimens exposed outside is also available as IR and UV-visible spectra, as in this investigation, the predictions can be compared with the experiment.
3. Linking Field and Laboratory Exposure Results The ability to link field and laboratory exposure results is critical to predict the service life of a polymeric material in its intended service environment. Based on the results from the SPHERE and the outdoor exposures, we first used ratios of FTIR absorbances to test if the mechanism of chemical degradation for samples exposed to outdoor environments is similar to those exposed on the SPHERE. Then we developed two schemes to predict the chemical damage of the study material in any environments where the appropriate weather data (T, RH and solar spectrum) are available by using the
15
SPHERE data. One is a model-free heuristic approach developed at NIST that uses the SPHERE data to estimate damage in outdoor environment without operator input. The second approach34 abstracts the SPHERE data into a predictive model. Both approaches were based on total effective dosage and cumulative damage, and were derived solely from laboratory data assuming the validity of the additivity law and a variation of the reciprocity law. Outdoor data was only used to verify the predictions using the temporal field values for outdoor spectral irradiance, panel temperature, and panel moisture content as input. (a) Using Chemical Ratio as a Metrics for Degradation Mechanism Comparison Figure 19 presents the ratios of chemical changes (1250 cm-1 vs. 1510 cm-1, left; 1510 cm-1 vs. 1658 cm-1, right) for specimens exposed on the SPHERE under 32 different conditions and specimens exposed to outdoor chamber from 14 different times of the four years. A total of 184 curves are displayed in each plot, including 128 curves from laboratory exposure and 56 from outdoor exposure. A general superposition of these curves is observed for both plots, indicating that not only the degradation mechanisms within the 32 different laboratory conditions are same, but they are also the same as those from the 14 outdoor exposures. As we know, the outdoor environment is time-dependent and cyclical; however, it seems that these environmental variables do not significantly affect the mechanism of chemical degradation of this model amine-cured epoxy. (b) Model-Free Heuristic Approach The approach uses a computer program to estimate the damage of the outdoor exposed specimen from the actual damage/dosage curves derived from the SPHERE exposure. Peak height in the IR spectrum was chosen as the damage statistic, although the program also allows peak area, peak ratios, and yellow index, among others, to be used. The criterion for a suitable damage statistic is that it changes monotonically with degradation. First, the damage-dosage curves for all replicates for a given set of T/RH/BP conditions on the SPHERE were averaged. Since reciprocity is obeyed, only the 100% ND data were used. The average curve was written to the database and used in the following calculations. T, RH and the solar spectrum were available for the outdoor
16
environment inside and outside the outdoor chamber for every 12 minutes of daylight. The solar radiation for the 12 minute time slice was separated into the dose passing through each of the 4 BP filter ranges used on the SPHERE (i.e., 306 nm ± 3 nm; 326 nm ± 6 nm; 353 nm ± 21 nm and 450 nm ± 79 nm) so that incremental dose was known for each filter range for each time slice. The solar radiation in the inter-filter gap from 309 nm to 320 nm was equally divided between the 306 nm and 326 nm filters. The total dosage was calculated from the dose and the specimen UV-visible absorbance spectrum. In estimating the evolution of damage for an outdoor specimen, the latest estimate of the damage (with a starting value of zero) was used to find the corresponding amount of dosage from the damage/dosage curve of the closest SPHERE condition (T/RH) through one of the BP four filters. The incremental solar dosage from the outdoor time slice was used to move along the curve to a new level of dosage on the SPHERE exposure curve and the corresponding damage was found. This new damage level was then used as the starting point in processing the next filter range. The process was cycled over the filters and subsequent 12 minute intervals of outdoor exposure until the time period between measured specimen spectra, typically 3 to 4 days, had been covered, at which point the accumulated damage and dosage (or elapsed time) were added to the output plot. Plotting the damage observed at that stage in the outdoor exposure provided an experimental check on the prediction. Such a procedure assumes that the additivity law is obeyed. For specimens with very similar thicknesses, using dose seems to be just as good as using dosage. The use of the dose also allows calculation of a damage-dose curve for any geographical location where the environment has been sufficiently characterized. The estimated damage and the observed damage for the outdoor exposed specimens can be plotted against outdoor exposure time or the total dosage. When the dosage from the different BP filter ranges is summed for use in the plot, the different efficiencies of different ranges of wavelength must first be taken into account. The superposition of SPHERE damage-dosage curves for different BP filters provided these efficiencies. Typical examples of the fit of calculated and observed damage using the modelfree heuristic approach are shown in Figures 20 and 21 for a group exposed in the
17
outdoor chamber (G17) and a group exposed outside the chamber (G11-Out), respectively. As can be seen, for both exposures the calculated damage from all four IR peaks agrees well with the actual damage as a function of outdoor exposure time, which includes the nighttime. Since the fit between calculation and observation is good, the additivity law seems to be obeyed. An advantage of this approach is that no model is needed. The accuracy and precision of the predicted responses, however, require experimental data covering the range of exposure conditions expected to be observed in the field.
The computer
program automatically makes all judgments of which data to use. The best case is when extrapolation of these data with respect to exposure time can be avoided because the data for all filter ranges cover the desired range of damage. Currently, no correction for deviations from reciprocity has been programmed into the model-free approach because, as remarked earlier, this epoxy material obeys the reciprocity law. (c) Cumulative Damage Prediction Model34 The cumulative damage model10, 13, 34 is expressed as g '(t ) =
⎡ exp( z ) ⎤ d Ð [τ , ξ (τ ) ] 1 = [ Ð (∞) − Ð (0)] ⎢ 2⎥ d (t ) d (t ) × σ ⎣⎢ (1 + exp( z ) ) ⎦⎥
(1)
where ξ (τ ) = [D Inst (τ ), temp(τ ), RH (τ )] , Ð(0 ) is the standardized level of damage at time 0 and Ð(∞) is the long-term asymptote, and z is as defined in equation (2)
z=
log [ d (t )] − μ
(2)
σ
Here d (t ) is the effective total dosage, and μ , and σ are parameters that describe the location and steepness of the damage curve, respectively. Then the prediction equation for the cumulative amount of damage at time t, based on the incremental values of dosage is: t
DosageCUM (t ) = ∑ Δd (i ) i =0 t
DamageCUM (t ) = ∑ Δ Ð(i ) i =0
18
where Δd (t )) = d (t ) − d (t − 1) and Δ Ð(t ) = g ' (t ) * Δd (t ) A detailed description of the cumulative damage model is given in Reference 34. This model includes an extrapolation of damage-dosage with exposure time and permits reciprocity law failure, but not the failure of the additivity law. The same outdoor environment and SPHERE data as in the model-free approach were used. The parameters in the model for temperature, RH, wavelength or the light intensity were estimated from the SPHERE exposure results. Typical examples of the fit between observed and calculated damage are shown in Figure 22, revealing that the predicted damage generally agrees with the observed damage. However, the bias in the fit of the model to the data suggests that it needs to be modified to include some, as yet, unknown degradation effect. The model must account for all trends on the SPHERE degradation data, including the dependence of degradation and dosage on T and RH, which we found that the different degradation modes have different responses to T and RH. In this case, the model development must be carried out for each damage statistic (each IR absorbance in this study). In a summary, all three approaches have successfully linked the laboratory results to the outdoor data, and the chemical changes of the model epoxy coating exposed to more than 20 independent outdoor environments are effectively predicted from the SPHERE data by both the model-free heuristic approach and the cumulative damage prediction model. Future work will extend these concepts to physical properties such as yellowing index and gloss retention, and filled polymeric coating systems as well.
CONCLUSIONS
Linkage between laboratory and field exposure results for a model epoxy coating system has been established via reliability-based methodology. Precise, accurate, and time-based measurements on both exposure environments and degradation properties were carried out. Based on data from well-controlled SPHERE exposures, the environmental factors that are most critical to the chemical degradation of the UV exposed epoxy materials were ascertained. It has been found that exposure conditions such as intensity of UV irradiation, the wavelength of the spectral UV, the temperature
19
and the relative humidity all play important, but different, roles on the efficiency of the chemical damage per unit dosage. High humidity tends to retard the formation of photooxidation products related to the IR band at 1728 cm-1. Wavelength and light intensity, however, did not affect the mechanism of chemical degradation. Outdoor exposures were carried on the roof of a NIST laboratory located in Gaithersburg, Maryland. Chemical changes in the specimens exposed outdoors were measured in the same way as those exposed on the SPHERE. Chemical degradation during outdoor exposure depends on the total effective dosage as well as the specimen temperature and humidity. Tests using FTIR absorbance ratios showed that the mechanism of chemical degradation for outdoor exposed samples is similar, perhaps identical, to the chemical failure degradation mechanism for specimens exposed in the laboratory. Both the model-free heuristic approach and the accumulated damage prediction model were derived solely from laboratory data assuming the validity of the additivity law and a variation of the reciprocity law. These methods were successfully fitted to and validated against greater than 20 independent outdoor exposure datasets, using only the time series for individual outdoor factors (T, RH, and solar spectrum) as input to the models. Hence, we effectively predicted the service life of this material for exposures starting at different times of a year and for different years. It suggest that it is possible to predict the service life of this material exposed in any environments, as long as, temperature, relative humidity, and solar spectral irradiance have been measured at suitable time intervals and they are the dominant degradation factors. The success of this study strongly indicates that the reliability-based methodology is an effective tool for linking laboratory and field exposure data, and predicting the service life of this type of polymeric material.
ACKNOWLEDGEMENTS
This research is part of a Government/Industry consortium on Service Life Prediction of Coatings at NIST. Companies involved in this consortium include AKZO Nobel, Arkema, Atlas Materials Testing Solutions, Dow Chemical, DuPont Automotives, Duron Inc., Eastman Chemicals, Millennium Inorganic Chemicals, PPG, and Sherwin Williams Co.,
20
USDOT Federal Highway Administration, Wright Patterson AFB, USDA Forest Products Laboratory in Madison, WI, and the Smithsonian Environmental Research Center located in Edgewater, MD. We also gratefully acknowledge help from Bouchra Kidah, David Martin, Aziz Rezig and Cyril Clerici from BFRL, NIST for their help on data collection and evaluation.
21
REFERENCES:
(1)
Martin, J.W., Nguyen, T. and Wood, K.A., “Unresolved Issues Related to Predicting the Service Life of Polymeric Materials,” Service Life Prediction:
Challenge the Status Quo, Martin, J.W., Ryntz, R.A. and Dickie, R.A. (Eds.), Federation of Societies for Coatings Technology, FSCT, Blue Bell, PA, p. 13 (2005). (2)
Hofmann, A.W., “Remarks on the Changes of Gutta Percha Under Tropical Influences,” J. Chem. Soc., 14, 87 (1860).
(3)
Russell, W.J. and Abney, W. de W., “Repot to the Science and Art Department of the Committee of the Council of Education on the Action of Light on Water Colors,” H.M. Stationary Office, London (1888).
(4)
Blakely, R.R., “Evaluation of Paint Durability-Natural and Accelerated,” Prog.
Org. Coat., 13, 279 (1985). (5)
Fisher, R.M., Ketola, W.D., and Murray, W.P., “Inherent Variability in Accelerated Exposure Methods,” Prog. Org. Coat., 19, 165 (1991a).
(6)
Riedl, A., ‘What Makes a Xenon Weathering Instrument High-End?” Atlas
Sunspots, 33 (70), 1 (2003). (7)
Sullivan, C.J. and Cooper, C.F., “Polyester Weatherability: Coupling Frontier Molecular Orbital Calculations of Oxidative Stability with Accelerated Testing,”
J. Coat. Technol., 67 (847), 53 (1995). (8)
Searle, N.D., Giesecke, P. Kinmonth, R., and Hirt, R.C., ‘Ultraviolet Spectra Distributions and Aging Characteristics of Xenon Arcs AND Filters,” Appl. Opt., 3, 963 (1964).
(9)
Kinmonth, R.A. and Norton, J.E., “Effect of Spectral Energy Distribution on Degradation of Organic Coatings,” J. Coat. Technol., 49 (633), 37 (1977).
(10)
Meeker, W. Q., and Escobar, L. A. Statistical Methods for Reliability Data. John Wiley & Sons: New York. (1998).
(11)
Whittaker, I.C. and Besumer, P.M., A Reliability Analysis Approach to Fatigue Life Variability of Aircraft Structures. Air Force Materials Laboratory Technical
Report AFML-TR-69-65 (1969).
22
(12)
Martin, J.W. and McKnight, M.E. “Prediction of the Service Life of Coatings on Steel. 2. Quantitative Prediction of the Service Life of A Coating System,” J.
Coatings Tech., 57(724), 31 (1985). (13)
Martin, J. W., Saunders, S. C., Floyd, F. L., and Wineburg, J. P. “Methodologies for Predicting the Service Lives of Coating Systems,” Federation of Societies for Coatings Technology: Blue Bell, PA. (1996)
(14)
Schutyser, P. and Perera, D.Y., ‘Use of Reliability-based Methodology for Appearance Measurements,” Service Life Prediction of Organic Coatings: A
Systems Approach, Bauer, D.R. and Martin, J.W. (Eds.), ACS Symposium Series 772, American Chemical Society, Oxford Press, NY, p. 198 (1999). (15)
Tait, W.S., ‘Reliability Engineering: The Commonality between Airplanes, Light Bulbs, and Coated Steel,” Service Life Prediction of Organic Coatings: A Systems
Approach, Bauer, D.R. and Martin, J.W. (Eds.), ACS Symposium Series 772, American Chemical Society, Oxford Press, NY, p. 186 (1999). (16)
Guseva, O., Brunner, S., and Richner, P., “Service Life Prediction for Aircraft Coatings,” Polym. Degrad. Stab., 82, 1 (2003).
(17)
Nelson, H.A. and Schmutz, F.C., ‘Accelerated Weathering: A Consideration of Some Fundamentals Governing its Application,” Ind. Eng. Chem., 18 (12), 1222 (1926).
(18)
Hutzel, W. J.; Healy, W. M, “Remotely Accessed Photovoltaic Power Project”,
Journal of Engineering Technology, 23(1), 32, (2006). (19)
Duffie, J. A., and Beckman, W. A., “Solar Engineering of Thermal Processes”, Second Edition. New York: Wiley-Interscience (1991).
(20)
Chin, J.W., Byrd, W.E., Embree, E., Martin, J.W., and Tate, J.D., “Ultraviolet Chambers Based on Integrating Spheres for Use in Artificial Weathering,” J. Coat.
Technol., 74 (929), 39 (2002). (21)
Chin, J.W., Byrd, W.E., Embree, E., and Martin, J.W., “Integrating Sphere
Sources for UV Exposure,” Service Life Prediction Methodology and Metrologies, Martin, J.W. and Bauer, D. (Eds.), Oxford Press, NY, p. 144 (2001). (22)
B. Dickens,” Programs to estimate UV dosage and damage”, NISTIR, in preparation
23
(23)
B. Dickens, “Computer Programs for Nearly Real-Time Estimation of Photolytic
and Hydrolytic Degradation in Thin Transparent Films”, Service Life Prediction: Methodology and Metrologies, Martin, J.W. and Bauer, D.R. (Eds.), ACS Symposium Series 805, American Chemical Society, p. 414 (2001). (24)
Bellinger, V., and Verdu, J., “Oxidative Skeleton Breaking in Epoxy-Amine Networks,” J. Appl. Polym. Sci., 30, 363 (1985).
(25)
Bellinger, V., and Verdu, J., “Structure-Photooxidative Stability Relationship of Amine-Crosslinked Epoxies,” Polymer Photochemistry, 5, 295-311 (1984).
(26)
Patterson-Jones, J.C., Mechanism of Thermal Degradation of Aromatic AmineCured Glycidyl Ether Type Epoxide Resins, J. Appl. Polym. Sci., 19, 1539-1547 (1975).
(27)
Rabek, J. F., “Polymer Photodegradation – Mechanisms and Experimental Methods”, Chapman & Hall, New York, 1995, pp 269-278.
(28)
Kelleher, P.G., and Gesner, B.D., “Photo-Oxidation of Phenoxy Resin”, J. Appl.
Polym. Sci., 13, 9-15 (1969). (29)
Rivaton, A., Moreau, L., and Gardette, J-L., Photo-Oxidation of Phenoxy Resins at Long and Short Wavelengths-I. Identification of the Photoproducts, Polym.
Deg. Stab., 58, 321-332 (1997). (30)
Rivaton, A., Moreau, L., and Gardette, J-L., Photo-Oxidation of Phenoxy Resins at Long and Short Wavelengths-I. Identification of the Photoproducts, Polym.
Deg. Stab., 58, 321-332 (1997). (31)
Nguyen, T., Martin, J.W., Byrd, E., and Embree, N., “Relating Laboratory and Outdoor Exposure of Coatings: II. Effects of Relative Humidity on Photodegradation and the Apparent Quantum Yield of Acrylic-Melamine Coatings,” J. Coat Technol., 74, 65 (2002).
(32)
Chin, J., Nguyen, T., Byrd, W.E., and Martin J.W., “Validation of the Reciprocity Law for Coating Photodegradation”, J. Coat Technol. Research, 2 (7), 499 (2005).
(33)
Gerlock, J.L., Peters, C.A., Kucherov, A.V., Misovski, T., Seubert, C.M., Carter III, R.O., and Nichols, M.E., “Testing Accelerated Weathering Tests for Appropriate Weathering Chemistry: Ozone Filtered Xenon Arc,” J. Coat Technol.,
75 (936), 35 (2003).
24
(34)
Vaca-Trigo, I., and Meeker, W.Q., “A Statistical Model for Linking Field and Laboratory Exposure Results for a Model Coating,” Proceedings of 4th
International Symposium on Service Life Prediction: Global Perspectives, Key Largo, Florida (2006).
25
Figure 1. FTIR spectra of the amine-cured epoxy after exposure on the SPHERE with 353 nm band pass (BP) filters and 100% neutral density (ND) filters at 35° C, 25 % RH for 0 h, 25 h, 50 h and 75 h: (upper) absorbance spectra; (bottom) difference spectra.
26
Figure 2. Absorbance changes of IR bands at 1658 cm-1, 1728 cm-1, 2916 cm-1, 1250 cm-1 and 1510 cm-1 as a function of exposure time for amine-cured epoxy exposed to the SPHERE with 353 nm BP and 100 % ND filters at 35° C, 25 % RH. Results from four replicates for each exposure condition are shown.
27
Figure 3. Absorbance changes of IR bands at 1658 cm-1, 1728 cm-1, 2916 cm-1, 1250 cm-1 and 1510 cm-1 as a function of dose for amine-cured epoxy exposed to the SPHERE with 353 nm BP filters and 100 % ND filters at 35° C, 25% RH. Results from four replicates for each exposure condition are shown.
28
Figure 4. Absorbance changes of IR bands at 1658 cm-1, 1728 cm-1, 2916 cm-1, 1250 cm-1 and 1510 cm-1 as a function of dosage for amine-cured epoxy exposed to the SPHERE with 353 nm BP filters and 100 % ND filters at 35°C, 25 % RH. Results from four replicates for each exposure condition are shown.
29
Figure 5. Absorbance changes of IR bands at 1658 cm-1, 1728 cm-1, 1250 cm-1 and 1510 cm-1 as a function of dosage for amine-cured epoxy exposed to the SPHERE at 25 °C, 0 % RH under 326 nm BP filters and four ND filters with target transmittance values of 10 %, 40 %, 60 %, and 100 %. Results from four replicates for each exposure condition are shown.
30
Figure 6. Absorbance changes of IR bands at 1510 cm-1 as a function of dosage for amine-cured epoxy exposed at 25 °C and 0 % RH under 306 nm, 326 nm, 354 nm and 452 nm BP filters and at a ND of 100%. The expanded initial part (the dosage is up to 1.6×10⁴ kJ/m2) is shown in the inset. Results from four replicates for each exposure condition are shown.
31
Figure 7. Absorbance changes of IR bands at 1510 cm-1 as a function of dosage for amine-cured epoxy exposed at 25 °C and 0 % RH under 306 nm, 326 nm, 354 nm and 452 nm BP filters and at a ND of 100% when the dosages for the other curves are scaled to that of the curve for 452 nm, The shifting factors for the 306 nm, 326 nm, 354 nm and 452 nm, 100:50:6:1, respectively, reflect the relative efficiencies of the wavelengths. Results are averaged from four replicates for each wavelength. The uncertainty of the measurements was < 5%.
32
(A)
(B)
Figure 8. (A) Absorbance changes of IR bands at 1510 cm-1, 1658 cm-1, 1728 cm-1 and 1250 cm-1 for specimens exposed on the SPHERE under 326 nm BP filters and 100 % ND filters at 0 % RH and four different temperatures (25°C, 35°C, 45°C, and 55°C). Results from four replicates are shown. (B) Absorbance changes of IR bands at 1510 cm-1and 1658 cm-1 for specimens exposed on the SPHERE under 326 nm BP filters and 100 % ND filters at 75 % RH and two different temperatures ( 35°C and 55°C). Results from four replicates for each temperature are shown.
33
Figure 9. RH effect on the damage-dosage curves for the IR bands at 1510 cm-1, 1658 cm, 1728 cm-1 and 1250 cm-1 for amine-cured epoxy exposed on the SPHERE with 326 nm BP filters and 100% ND filters at 35°C. Four RH values are 0%, 25%, 50% and 75%. Results from four replicates for each RH are shown.
1
34
(Scheme 1)
(Scheme 2)
Figure 10. Proposed mechanisms for (top) formation of ketone C=O group (Schem1) and (bottom) formation of aldehyde C=O group (Scheme 2) of an amine-cured epoxy exposed to UV light.
35
Figure 11. Effect of of BP filter wavelength on the ratios of chemical changes of 1250 cm-1 vs. 1510 cm-1, 1728 cm-1 vs. 1658 cm-1, 1510 cm-1 vs. 1658 cm-1, and 1510 cm-1 vs. 1728 cm-1. Specimens were exposed on the SPHERE at 45° C and 25% RH under 306 nm, 326 nm, 354 nm and 452 nm BP filters and at a ND of 100%. Results from four replicates for each exposure condition are shown.
36
Figure 12. Effect of temperature on the ratios of chemical changes of 1250 cm-1 vs. 1510 cm-1 and 1728 cm-1 vs. 1658 cm-1. Specimens were exposed on the SPHERE with 353 nm BP filters and 100% ND at four temperatures (25° C, 35 ° C, 45 ° C and 55 °C) and 25% RH. Results from four replicates for each exposure condition are shown.
37
Figure 13. Effect of relative humidity on the ratios of chemical changes of 1250 cm-1 vs. 1510 cm-1, 1728 cm-1 vs. 1658 cm-1, 1510 cm-1 vs. 1658 cm-1, and 1510 cm-1 vs. 1728 cm-1. Specimens were exposed on the SPHERE at 35 °C with 100% ND filters and four different BP filters (306 nm, 326 nm, 353 nm and 450 nm) and four RHs (0 %, 25 %, 50 % and 75 %). Results from four replicates for each exposure condition and a total of 64 curves are shown.
38
Figure 14. Relative humidity (top) and temperature (bottom) inside rooftop exposure chamber, March, 17, 2004 to May 26, 2004.
39
Figure 15. Relative humidity (top) and temperature (bottom) outside the rooftop exposure chamber, March, 17, 2004 to May, 26, 2004.
40
Figure 16. Absorbance changes of IR bands at 1250 cm-1, 1658 cm-1, 1510 cm-1 and 1728 cm-1 as a function of exposure time for four groups of epoxy specimens exposed in outdoor environmental chamber in Gaithersburg, MD; 6/06/03 for G12, 3/04/03 for G9, 12/24/02 for G7 and 9/30/02 for G4. Results are averaged from four replicates in the same group. The uncertainty is within 5%.
41
Figure 17. Absorbance changes of IR bands at 1250 cm-1, 1658 cm-1, 1510 cm-1, and 1728 cm-1 as a function of dosage for four groups of epoxy specimens exposed in covered outdoor chamber in Gaithersburg, MD; 6/06/03 for G12, 3/04/03 for G9, 12/24/02 for G7 and 9/30/02 for G4. Results are averaged from four replicates in the same group. The uncertainty is within 5%.
42
Figure 18. Absorbance changes of IR bands at 1250 cm-1, 1658 cm-1, 1510 cm-1, 1728 cm1 as a function of dosage for epoxy specimens exposed in the outdoor chamber (G11) and outside the chamber (G11-Out) from 5/06/03 in Gaithersburg, MD. Results are averaged from four replicates in the same group. The uncertainty is within 5%.
43
Figure 19. Ratios of chemical changes for 1250 cm-1 vs. 1510 cm-1 (left) and 1510 cm-1 vs. 1658 cm-1 (right) for specimens exposed on the SPHERE and specimens exposed outdoors. The SPHERE exposure parameters include 4 temperatures (25°C, 35°C, 45°C, and 55°C), 4 relative humidities (0% RH, 25% RH, 50% RH and 75% RH, except only 0% RH for 25°C), 4 BP wavelengths (306 nm, 326 nm, 353 nm and 450 nm) and 100% irradiance. Outdoor specimens include 14 groups (G4-G17) exposed in the outdoor chamber. Four replicates are shown for each condition. A total of 128 curves for SPHERE exposure and 56 curves for outdoor exposure are presented.
44
Figure 20. Comparison of the predicted damage calculated by Model-Free Heuristic Approach and observed damage (actual) for the changes of IR absorbances at 1250 cm1 , 1510 cm-1, 1658 cm-1 and 1728 cm-1 for G17, exposed in the outdoor chamber starting 7/19/04.
45
Figure 21. Comparison of the predicted damage calculated by Model-Free Heuristic Approach and observed damage (actual) for the absorbance changes of IR bands at 1250 cm-1, 1510 cm-1, 1658 cm-1 and 1728 cm-1 for G11-Out, exposed outside the chamber starting 5/06/03.
46
Figure 22. Comparison of the predicted damage calculated by Cumulative Damage Model34 and observed damage for the absorbance changes of IR bands at 1250 cm-1, 1510 cm-1, 1658 cm-1 and 1728 cm-1 for G3, exposed in the outdoor chamber starting August 30, 2002.
47