Hindawi Publishing Corporation VLSI Design Volume 2013, Article ID 529150, 10 pages http://dx.doi.org/10.1155/2013/529150
Research Article A Prototype-Based Gate-Level Cycle-Accurate Methodology for SoC Performance Exploration and Estimation Ching-Lung Su,1 Tse-Min Chen,2 and Kuo-Hsuan Wu1 1 2
Department of Electronics Engineering, National Yunlin University of Science Technology, Yun-Lin 640, Taiwan Graduate School of Engineering Science and Technology, National Yunlin University of Science Technology, Yun-Lin 640, Taiwan
Correspondence should be addressed to Tse-Min Chen;
[email protected] Received 27 December 2012; Accepted 8 April 2013 Academic Editor: Yeong-Kang Lai Copyright © 2013 Ching-Lung Su et al. This is an open access article distributed under the Creative Commons Attribution License, which permits unrestricted use, distribution, and reproduction in any medium, provided the original work is properly cited. A prototype-based SoC performance estimation methodology was proposed for consumer electronics design. Traditionally, prototypes are usually used in system verification before SoC tapeout, which is without accurate SoC performance exploration and estimation. This paper attempted to carefully model the SoC prototype as a performance estimator and explore the environment of SoC performance. The prototype met the gate-level cycle-accurate requirement, which covered the effect of embedded processor, on-chip bus structure, IP design, embedded OS, GUI systems, and application programs. The prototype configuration, chip postlayout simulation result, and the measured parameters of SoC prototypes were merged to model a target SoC design. The system performance was examined according to the proposed estimation models, the profiling result of the application programs ported on prototypes, and the timing parameters from the post-layout simulation of the target SoC. The experimental result showed that the proposed method was accompanied with only an average of 2.08% of error for an MPEG-4 decoder SoC at simple profile level 2 specifications.
1. Introduction Due to the advancement of the semiconductor processing technology, the system-on-a-chip (SoC) design is more popular in consumer electronics than it ever will be. SoC design can effectively reduce system price and promote more functions in a compact product. The embedded processor core, coprocessor, memory subsystem, on-chip bus, intellectual properties (IPs), and various I/O peripherals are well organized on an SoC hardware platform to perform complex functions. In modern products, hierarchal software architecture yields boot loader, embedded OS, graphic user interface (GUI), IP device driver, and application software, which all operate on an SoC. However, the system level of hardware/software (HW/SW) cosimulation and coverification tools are limited by the computational limit of the simulation platform and the tradeoff of model accuracy. The adjustment of simulation time versus exactness always harms system designers, especially communication and standard
compatible products with huge simulations. Prototype simulation plays the role of final HW/SW function verification. There are several HW/SW codesign EDA tools in the design phase, such as Mentor Graphics Seamless [1], Synopsys Eaglei [2], and CoCentric [3]. Although these EDA tools allow HW/SW cosimulation at bus level, where each bus transaction involves all signals necessary to complete the bus function, the simulation efficiency is restricted to the platform computational capacity. Several techniques can estimate the time of the merged hardware/software systems. In [4], the authors employed VISTA methodology and tool to model SoC virtual platform and analyze system level performance. The simulation adopted the exact instruction set models for accurate time estimation in [5]. Research [6] reports a good simulation performance. However, the codes generated by POLIS system limited the software structure. A simulation technology [7] called “timed compiled-code simulation” used the time stamp generated by I/O accesses to perform the timed functional simulation to speed up the simulation.
2
VLSI Design Table 1: The simulation time of the H.264/AVC decoder.
Sequence Stefan Foreman Mother-daughter Average simulation time Accuracy
C code 0.02670 Sec. 0.02452 Sec. 0.01694 Sec. 0.02272 Sec. Algorithm/untimed
RTL Verilog HDL 5 Sec. 6 Sec. 6 Sec. 5.6666 Sec. RTL/cycle accurate
CPU core module 4
CPU core module 1 (CM-920T)
CPU core module 2 HDRA/B
CPU core module 3
Integrator/AP
EXPA/B
Configurable AHB or APB bus
AMBA to PCI bridge
FPGA logic module 1 (LM-EP20K)
FPGA logic module 2
PCI slot 1
FPGA logic module 3
FPGA logic module 4
PCI slot 2
PCI slot 3
Interface module
Analog design
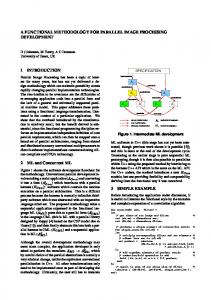
Figure 1: ARM Integrator architecture.
Type Synthesized HDL netlist 4 hrs 5 Min. 4 hrs 1 Min. 4 hrs 6 Min. 4 hrs 4 Min. Gate level/cycle accurate
SoC prototyping 0.52328 Sec. 0.44141 Sec. 0.31611 Sec. 0.41783 Sec. Gate level/cycle accurate
environment. In a real SoC system, analyzing the mixture of application program with a multitasking OS and GUI subsystems is a challenge in system HW/SW codesign. In IC design, the gate-level cycle-accurate verification is the key checkpoint of front-end design process. Table 1 lists the average simulation time of each frame H.264/AVC [15] decoded with a picture resolution of 176 × 144 pixels. The platform of the C code simulation is Intel Pentium 4 PC. The RTL and Synthesized gate-level HDL simulation was operated on the SUN Blade 2000 workstation. The SoC prototype simulation adopted the ARM Integrator [16], with ARM 920T core module operated at 124 Mhz. The simulation time of the SoC prototype was 28463 times faster than its gate-level simulation. The SoC prototype would be a possible simulator if we can build an exact model on it. The rest of the paper is organized as follows. The SoC prototype is described in Section 2. Section 3 analyzes the SoC system in detail. The proposed prototype-based gatelevel cycle-accurate method for SoC performance estimation is illustrated in Section 4. Section 5 presents the prototype-toSOC model, which was integrated by the prototype-measured parameters and post-layout simulation result to estimate the target SoC performance. We have chosen a systemon-a-programmable chip (SOPC) development board as the experimental target SoC to evaluate our methodology. Section 6 shows the simulation result. Finally, Section 7 gives a conclusion.
2. SoC Prototype Several other techniques provided electronic system-level (ESL) design method and virtual platform techniques, which can achieve highly accurate prediction and analysis. In addition, ESL can be used to develop software and explore architectures with HW/SW codesign at an early design stage before implementing the real chip [8]. Research [9] modeled PAC Duo SoC, which can achieve high accuracy and is with an error rate of less than 10%. However, the virtual platform of PAC Duo SoC did not run OS and thus ignored the effect of OS on overall performance. In the early stage of the design process, an accurate and fast performance analysis method was proposed, which used a behavioral model [10]. Works [11–14] adopted QEMU and SystemC-based virtual platform to achieve fast cycle-accurate prediction. The improvements of these researches are obvious, but their simulations are still based on the analysis of target application program. The simulation is invalid beyond simplex
Traditionally, SoC Prototype plays the role of final function verification. ARM and MIPS technologies also provide ARM Integrator and ARM Versatile [16], while MIPS SEAD-2 provides SoC prototyping. They are combined with processor modules, FPGA modules, and a motherboard with an onchip-bus structure to form a configurable SoC prototype. ARM Integrator architecture is illustrated in Figure 1. The configurable AMBA AHB or APB bus with a system controller is built on the Integrator/AP motherboard. The four core modules, each included an ARM test chip, can be stacked on Integrator/AP via AHB or APB bus. In the same fashion, the synthesized gate-level design netlist can be downloaded to the logic modules for digital design verification. The connection grids on the logic modules support the interfaces of analog designs. Figure 2 shows the core module circuit. The module is organized with three main components, which includes an
VLSI Design
3
Core module FPGA
FPGA Cfg. controller
PLD
State/Ctrl Reg
Reset controller
SDRAM controller
ASB bus (local bus)
SSRAM
ARM 920T test chip
SSRAM controller PLD
Interrupt controller
programs. Figure 4 is the snapshot of the QT/embedded welcome picture on the experimental prototype.
128 MB SDRAM DIMM
AHB or APB bus (HDRA/HDRB)
Programmable Osc./divider
24 Mhz Osc.
System bus bridge
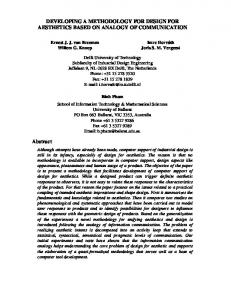
Figure 2: ARM Integrator core module.
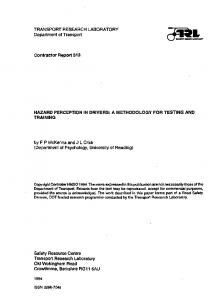
ARM test chip, a core module FPGA controller, and an SDRAM DIMM interface. The ARM test chip can be replaced by ARM7, ARM9, ARM10, and ARM11 series CPU module [16]. The configurable FPGA is responsible for the system controller, which glues CPU, SDRAM, and an ASB to AHB (or APB) bus bridges. Figure 3 presents four types of SoC architectures, which can be formed by configuring ARM Integrator and ARM Versatile. ARM Integrator only supports an AMBA bus architecture, while ARM Versatile supports the multilayer AMBA bus structure for the high performance SoC. These architectures can cover various SoC designs, and the prototype can instantly replace the processor, adjust SDRAM size, reconfigure SoC architecture, vary clock frequency, and download latest IP designs. Therefore, the importance of the prototype is apparent in SoC HW/SW codesign and verification.
3. SoC System Analysis To analyze a real SoC example, we chose an ARM Integrator prototype to build an entire SoC HW/SW. Firstly, a RedBoot [17] was ported on the selected ARM Integrator prototype. Secondly, Linux kernel 2.4 and 2.6 versions were also ported on the prototype for the embedded OS. QT/Embedded [18] was transferred on ARM Integrator for the Linux GUI. Finally, several interfaces such as VGA adaptor, USB 1.1, and 2.0 adaptor, audio adaptor, IDE adaptor, and network interface card were driven for the system functional extensions. The prototype must be a standalone. Any redundant device can cause inaccurate analysis, for instance, the interruption of in-circuit emulators (ICEs). Therefore, the prototype can be automatically booted to execute the GUI application
3.1. The Scope of the SoC HW/SW Components. Figure 5 presents our prototype architecture for an MPEG-4 decoder SoC. It also shows the MPEG-4 decoder demonstrating prototype in parentheses. Most portable consumer electronics with multimedia and internet access functions must be integrated with these hardware and software elements. The software successively operated as follows. Bootloader scanned the hardware configuration and prepared the parameters to introduce the embedded operation system (OS). The embedded OS booted all the hardware components and created a good environment for application execution, such as the file system. The graphic user interface (GUI) system simplified the manipulation for end users. The hardware device drivers provided the system call under OS control for any resource access. These organized an advanced and robust system, but they also affected system performance and caused analyzing difficulties. Besides, the processor core and memory subsystem were responsible for software execution. On-chip bus subsystem was used to forward data, which included bus masters, bus slaves, bus controllers (or arbiters), and bus bridges. IPs can be coworked with the processors to improve system performance. More hardware components, for example, memory manage unit (MMU), may increase the complexity of virtual processor execution model over the computational capacity of the simulation platform. Nowadays, it is impossible to simulate all the hardware and software components precisely and concurrently in the same environment. A completed SoC prototype can simulate SoC systems and has potential to estimate performance via a good prototype to SoC modeling. 3.2. System Profiling. The profiling tools are usually used to analyze the time consumption of each subprogram. During the program execution, the system time tags and the number of called times of each subprogram are recorded as a data file. The profiling results can analyze this data and map it to the subprogram in software structural relationship. The profiling provides detailed information concerning the critical subprogram on application programs. Since profiling is always a key to SoC HW/SW partition and codesign, the correct system profiling is very important. Profiling tools extract information from the simulation platform, and so the characteristic of the platform architecture dominates the profiling result. For this reason, we adopted the GUN gprof [19] for profiling to compare the result of our ARM Integrator prototype with that of Intel Pentium 4 platform for MPEG-4 SP@L2 decoder at 256 kbps. Table 2 lists the results of the MPEG-4 decoder. Since motion compensation (MC) required most load/store operations, the Pentium simulation platform with the Hyper-Threading technology was applied to efficiently reduce the MC execution time. The third major column presents the Integrator platform with the optimized MC operations, which was programmed by ARM assembly language to perform a dense pipelined data transformation. In a word, the profiling of the SoC prototype supported the
4
VLSI Design Table 2: The profiling of the MPEG-4 SP@L2 decoder. Intel Pentium 4 Sequence Foreman M-D
Function MC (%) Interpolation (%) IDCT (%) ED (%) Others (%) Simulation time (fps)
ARM Integrator Sequence Foreman M-D
Stefan
Integrator (with optimized MC) Sequence Foreman M-D Stefan
Stefan
34.4 22.2 23.2 9.6 10.6
33.5 24.7 22.0 11.6 8.2
35.9 21.8 26.9 9.8 5.6
53.3 11.4 18.4 6.4 10.4
47.5 6.9 21.7 13.1 10.9
48.7 10.0 21.0 8.5 11.8
40.4 15.4 21.5 6.4 16.4
36.8 19.0 23.6 7.1 19.6
34.1 13.5 25.0 7.4 20.1
769.0
822.0
652.0
19.6
22.3
17.7
22.3
24.1
20.7
Pentium platform: CPU 2.8 Ghz, 800 Mhz FSB with Hyper-Threading technology. Integrator platform: CPU 120 Mhz, 52 Mhz FSB in asynchronous bus mode.
SDRAM
SDRAM
DRAM controller
ARM CPU core
IP
IP
IP
IP
IP
IP
AMBA bus 2
IP
IP
CPU AMBA local bus AHB bridge AHB bridge
AMBA bus 2
AMBA bus 1
IP
IP
DMA controller
VGA and LCD controller
IP AMBA bus 2
PCI bus
Keyboard
PS-2 mouse
Audio codec
Serial bus I/F
APB bus
IP
PCI-bridge
IP
Ethernet
IP
USB
IP
APB-bridge
AHB bridge
DRAM controller
PCI-bridge
CPU AMBA local bus AMBA bus 1
32-bit GPIO
Display IF
Ethernet
DMA controller
VGA and LCD controller
ARM CPU core
DRAM
USB
Display IF
APB-bridge
ARM CPU core
DRAM controller
IP
(b)
APB bus
IP
(c)
Serial bus I/F
32-bit GPIO
IP
IP
IP
(a)
DRAM
PCI bus
Bridge
PCI bus Keyboard
IP
IP
AMBA bus
PCI bus
Bridge
PS-2 mouse
AMBA bus
ARM CPU core
Audio codec
DRAM controller
IP
IP
(d)
Figure 3: (a) Integrator architecture 1. (b) Integrator architecture 2. (c) Versatile architecture 1. (d) Versatile architecture 2.
correct HW/SW codesign information, which guided the direction of the system optimization.
4. SoC Performance Estimation The proposed SoC performance estimation involved three phases to predict the target SoC performance. Phase 1 built
up the correct SoC prototyping analysis environment. Phase 2 attempted to configure the core module parameter which yielded a fixed performance estimation ratio for pure software operations. Phase 3 mixed the profiling tools to estimate the application with HW/SW codesign. In addition to the postlayout simulation parameter, the SoC performance can also be predicted.
VLSI Design
5 Table 3: QT performance decrease for MPEG-4 decoder.
Set 1 Set 2 Set 3
1 2 Linux C + GUI 4.09 1.13 10.89 7.90 16.48 13.50 Ave. descent
3 Descent 2.96 2.99 2.98 2.9766
4 Linux 4.27 11.40 17.58
5 C Opt. + GUI 1.24 8.45 14.63 Ave. descent
6 Descent 3.03 2.95 2.95 2.9766
7 Linux 4.28 11.42 17.72
8 Assembly + GUI 1.35 8.45 14.73 Ave. descent
9 Descent 2.93 2.97 2.99 2.9633
Unit: frame per second (fps). Set 1: CPU 57 Mhz/Local Bus 33 Mhz/AHB Bus 33 Mhz/Fast Mode. Set 2: CPU 160 Mhz/Local Bus 52 Mhz/AHB Bus 33 Mhz/Fast Mode. Set 3: CPU 126 Mhz/Local Bus 52 Mhz/AHB Bus 33 Mhz/Asynchronous Mode.
chip post-layout simulation results. The result considered all the hardware and software elements, and so it was the result of the targeted SoC.
Figure 4: Experimental ARM Integrator SoC prototype.
4.1. Estimation Flow. The SoC estimation performance flow is presented in Figure 6. In Section 3, building a complete SoC prototype is discussed, and so the software infrastructure, that is, system software, must be prepared in Phase 1. The parameters of system software influenced several performance features, including the time slot of embedded OS, kernel scheduling for each process, and the GUI resolution with color depth. Phase 2 adjusted the core module parameters, including the processor clock frequency, bus clock frequency, processor operation mode, bus operation mode, SDRAM clock frequency, SDRAM operation mode, and core module FPGA frequency, to map a fixed performance ratio for performance estimation. The phase only modeled the pure software execution part and predicted the performance. Phase 3 focused on the subprogram with HW/SW cooperations. The subprogram with IP co-operation was modeled in the phase. The on-chip bus and the IPs must be modeled at cycle-accurate precision. Phase 3 was combined with the profiling results, the prototype FPGA synthesized data, predicted SoC post-layout simulation data, and the measured data from the prototype to extract the gate-level cycle-accurate performance estimation. All the parameters of the prototype setup must be coordinated with other prototypes in Phase 3 to keep a linear proportion with the target SoC parameters. Otherwise, prediction error may occur. The configuration of the prototype parameters is very important in the proposed methodology, for it is not the only requirement in traditional system verification. After previous works, we obtained the SoC performance through the combination of cycle-accurate simulation results and the
4.2. System Software Environment on SoC. The system software was the infrastructure of the operational environments of application programs. It established the possibility for multitask operation at the cost of system performance. For exploration, we simulated the performance digression of the QT/Embedded GUI on Linux. The GUI had been ported on our SoC prototype. The simulation was also targeted on the MPEG-4 decoder. The specifications of the MPEG-4 decoding were the same as those in Table 2. Table 3 illustrates the performance decrease by QT/Embedded GUI. Columns 1–3, 4–6, and 7–9, respectively, present the original reference software, the optimized C program, and the program optimized by assembly language coding for the MC algorithm. Columns 1, 4, and 7 list the program performances on textural Linux with direct frame buffer video display. Columns 2, 5, and 8 perform the program execution on Linux plus QT/Embedded GUI environment. The last ones of the three MPEG-4 programs presented the performance decrement by QT/Embedded, which showed that different prototype configurations had 2.96∼2.98 fps decrease in average. The three prototype setups are presented in the notes of the table. Through the simulation, we can see that the establishment of the system software environment was important in predicting the SoC performance. Moreover GUI, the embedded OS tuning, device driver optimization also affected the precision of the performance estimation.
5. Prototype Performance Model The prototype is a product of printed circuit board (PCB), and so the performance is sensitive to the production. In the same batch, two prototypes always measure different parameters. Thus, except for the parameters inside FPGA, the prototype parameters should be extracted by logic analyzer. Figure 7 demonstrates the performance of the application program in the three estimation phases. In the previous section, we have mentioned the factors of system software. The performance of Phase 1 was lower than one of the processor instruction set simulator (ISS), but a complete environment must be ported on the prototype. In Figure 7, the performance loss between the bare environment and Phase 1 was caused by
6
VLSI Design
MPEG-4 decoder application software
Software elements
Embedded GUI (QT/embedded or miniGUI)
FPGA device driver
Embedded OS (Embedded ARM Linux kernel) Interrupt Bootloader (U-boot/Redboot)
Power on
On-chip bus System controller On-chip bus Embedded processor IPs (ARM integrator) (920T core module) (ASB) (FPGA module) (AHB) 15.1 TFT
Matrox millennium (2 MB version)
2.5 HD
USB 2 for kernel 2.6 USB 1.1 for kernel 2.4
1 G flash
AC/97
802.11g adaptor
IDE
14 G HD
Intel pro 100/10
I/O interface (PCI controller)
Hardware elements DVD-RW
Ethernet
Figure 5: MPEG-4 decoder SoC HW/SW architecture and ARM Integrator prototype configuration.
Application programs Bootloader (firmware) Embedded OS OS GUI
Logic module model Phase-1 system SW environment on SoC prototype
Phase-3 segmented linear system HW/SW performance estimation
Device driver Core module model Core module measured data
Profiling results Motherboard measured data Logic module measured data
Phase-2 fixed ratio SW performance estimation
Chip post layout simulation parameters
Gate-level cycle-accurate estimation results
On-chip bus model
Figure 6: Three-phase SoC performance estimation flow.
VLSI Design
7
Performance A Software porting 𝑓1
𝑓2
𝑓3
𝑓4
B
Performance mapping 𝑓1
𝑓3
𝑓2
𝑓4
C
Profiling 𝑓1
𝑓2
𝑓3
𝑓4
D
Procedure
A
Bare environment
Without OS
B
System software
Phase 1
C
Fixed ratio software prediction
Phase 2
D
Segmented linear HW/SW prediction
Phase 3
Figure 7: Performance estimation procedure.
the consumption of the system software. In the SoC design division, the system software provider rapidly supplied the initial version in this phase. The second phase adjusted the CPU speed, cache speed, and bus speed to the ratio of target SoC. Phase 3 was mixed with the profiling results to focus on the subprogram with IP system call. The measured parameters, via the proposed HW/SW codesign strategy, performed gate-level cycle-accurate performance prediction. The additional post-layout simulation can assist the designer to extract SoC system performance. 5.1. Software Performance Model. The software performance estimation [6–8] is a traditional issue in computer science. The cross-platform simulation of SoC design is more complex before SoC tapeout. However, manufacturing IC with a deep submicron technology is costly. Time is required in the whole system simulation for standard compatibility test and stability verification, and consumer electronics are able to meet the requirement. To reduce estimation complexity, Phase 2 only included the components for software execution. These elements were connected by the ASB local bus. The strategy adopted the ratio of down-scale frequency of the elements on core module to the target SoC. However, the PCB transmission delay often causes local bus parameter skew. Figure 8(a) illustrates a bus parameter skew, and Figure 8(b) lengthens the bus period to meet a bus transaction pattern of the target SoC. Figure 8(a) demonstrates the cycle ratio of Transfer 1 to Transfer 2, which was 3 : 1 in ASB sequential mode. Since the ratio of the target SoC was 2 : 1, the prototype of the bus period should be lengthened from 10 ns to 15 ns. After a series of prototype parameter verification and tuning, a down-scale cycle-accurate prototype can be used in estimating the SoC performance by the ratio of prototypemeasured performance. The theoretical cycle-accurate result was considered as the system software effect.
5.2. System HW/SW Performance Model. The system HW/ SW performance model focused on the SoC subprogram with IP system call. Generally speaking, the plan of an SoC design exhausts the performance of the embedded processors. The IP is usually located in the critical functions. The proposed system performance model was composed of the profiling tools, on-chip bus measured parameters, and the timing of the IP synthesized netlist to predict an SoC performance with IP cooperations. The profiling tools synthesized application programs as a subprogram tree. Each branch (subprogram) was marked with the subprogram execution time with a percentage note. We presented the subprogram tree in Figure 9. All the subprograms were decomposed into elementary instructions. If the subprogram is replaced by the IP design, the performance of Phase 2 can be swapped by the estimation result of Phase 3 model, which can be estimated by the prototype-measured bus parameter and the IP timing data of the synthesized gate-level design, and so forth. Figure 10 illustrates the AMBA bus parameters, which were fed into the AMBA Mode 2 in Figure 9. The proposed SW model, system HW/SW model, and the profiling results were unified to perform the SoC gate-level cycle-accurate performance estimation methodology.
6. Experimental Results To automatically analyze the profiling result, we had programmed a tool profile GUI to analyze and joint the parameters to estimate the application performance. Figure 11 presents the screen shot of the profile GUI. The right region is a synthesized view of the profiling result. The top left one is directed to a profiling texture file generated by GUN gprof. The bottom left corner is available to input the model parameters. Key calculation performs the process of Phase 2 and Phase 3 model to predict a target SoC performance.
8
VLSI Design Transfer 1 (30 ns)
N-TRAN
S-TRAN
Transfer 2 (10 ns)
S-TRAN
S-TRAN
S-TRAN
Addr + 4
Addr
Control
Wait
Wait
Done
Done Data (A)
Data (A + 4)
(a)
Transfer 1 (30 ns)
N-TRAN
S-TRAN
Transfer 2 (15 ns)
S-TRAN
S-TRAN Addr + 4
Addr
Control
Wait
Done
Done Data (A)
Data (A + 4)
(b)
Figure 8: (a) Local bus parameter skew 3 : 1. (b) Recovery the bus skew 2 : 1.
SOPC is an SoC-like chip, which consisted of an embedded processor and several programmable logic cells. The on-chip bus is similar to that of SoC. Therefore, we chose the Altera EXPA10 development board [20] as the target SoC. Contained in the embedded processor stripe were the ARM922T processor, SDRAM controller, and 38,400 logic elements. Figure 12 presents the EXPA 10 architecture. The CPU processor core was the same as the ARM 920T test chip on our prototype. Since the cache size was different from ours, we disabled it. The MPEG-4 player was also the simulation program. The simulation results and the main model parameters are listed in Table 4. We followed the estimation flow of Figure 6, and thus the Linux kernel 2.6 was also ported on the EXPA10 development board. The simulation result showed that the ARM Integrator performance estimation model was very close to the result of the EXPA10 platform. The C and assembly optimized programs showed 3.5% and 0.66% of error, respectively. The average
error rate was 2.08%, which was caused by the SDRAM controller design and the different types of local buses. The experimental results can sufficiently support the proposed SoC performance estimation methodology.
7. Conclusions In the paper, we presented an SoC gate-level cycle-accurate performance methodology based on SoC prototype. Traditionally, SoC prototype is used in system function verification, compatibility, and stability test. Because of the advance of semiconductor process, SoC is able to integrate more and more elements in a single chip. The complex software hierarchy makes SoC HW/SW co-deign a barrier waiting to be conquered. The application program executed on embedded OS, GUI subsystem, device driver increases the gap between software and system HW/SW codesign. The tradeoff is the HW/SW model and time consumption in
VLSI Design
9 Table 4: Experimental results of the MPEG-4 decoder.
Platform Program Stefan Foreman M-D Average
C 0.207 0.261 0.269 0.246
Integrator Assembly 0.220 0.249 0.278 0.249
EXPA10 Assembly 0.437 0.501 0.565 0.501
C 0.404 0.510 0.510 0.475
Platform CPU Local Bus AHB SDRAM
Main model parameters Integrator 25 Mhz 25 Mhz 25 Mhz 128 MB
EXPA10 50 Mhz 50 Mhz 50 Mhz 128 MB
Unit: frame per second (fps). HW/SW performance estimation
Target SoC application
𝑓1
𝑓2
+
+
𝑓3
···
𝑓𝑛
=1
···
𝑓1𝑛
···
+
···
𝑓2𝑛
···
+
···
𝑓3𝑛
···
=1
···
𝑓21𝑛
···
+
···
𝑓22𝑛
···
+
···
𝑓23𝑛
···
=1
SW cycle accurate AMBA mode 1
AMBA mode 2
IP1 model
Prototype AMBA1 frequency
SoC bus grant delay
IP1 frequency
HW model Prototype bus wait cycle
Measure data gate-level timing
SoC AMBA1 frequency
Prototype bus grant delay
Figure 9: Profiling tree and HW cycle-accurate model.
Grant delay Wait cycle
Bus period
HCLK HBUSREQx HGRANTx HMASTER[3:0]
#1
HADDR[31:0]
A
HWDATA[31:0]
A+4 Data (A)
Figure 10: AMMA AHB parameter.
simulation. We reused the rapid simulation time of the SoC prototype and offered accurate estimation model to transfer the prototype into a semi-real-time SoC design environment. The framework was a three-phase design process. It can meet the gate-level cycle-accurate requirement, which concurrently covers the effects of the embedded processor,
Figure 11: Profile GUI: performance estimation tool.
on-chip bus structure, IP design, embedded OS, GUI systems, and application programs. The system performance can be explored according to the proposed estimation models, the profiling results of the application programs, and the timing parameters from the post-layout simulation of the target SoC. The experimental results showed that our method was
10
VLSI Design 922T + cache + DMA
SDRAM controller
Local bus AHB 1 Slave Master
D-port SRAM
Master Slave
Flash
ROM
EBI
S-port SRAM
AHB 2
SRAM Slave Master
PLD
Figure 12: Altera EXPA10 architecture.
accompanied by an average of only 2.08% of error in an MPEG-4 decoder SoC at simple profile level 2 specifications.
Acknowledgment The authors are grateful to the National Science Council, Taiwan, for the sponsorship under Grant NSC 100-2221-E224-034-MY3.
References [1] Mentor Graphics, Seamless CVE, http://www.mentor.com/ seamless. [2] Synopsys, Eaglei, http://www.synopsys.com/home.aspx. [3] “CoCentric system studio,” Sysnopsys, http://www.synopsys .com/home.aspx. [4] I. Moussa, T. Grellier, and G. Nguyen, “Exploring SW performance using SoC transaction-level modeling,” in Proceedings of the Design, Automation and Test in Europe Conference and Exhibition, pp. 120–125, 2003. [5] L. Guerra, J. Fitzner, D. Talukdar, C. Schlaeger, B. Tabbara, and V. Zivojnovic, “Cycle and phase accurate DSP modeling and integration for HW/SW co-verification,” in Proceedings of the 36th Annual Design Automation Conference (DAC ’99), pp. 964– 969, June 1999. [6] K. Suzuki and A. Sangiovanni-Vincentelli, “Efficient software performance estimation methods for hardware/software codesign,” in Proceedings of the 33rd Annual Design Automation Conference (DAC ’96), pp. 605–610, June 1996. [7] J. Y. Lee and I. C. Park, “Timed compiled-code simulation of embedded software for performance analysis of SoC desogn,” in Proceedings of the 39th Annual Design Automation Conference (DAC ’02), pp. 293–297, 2002. [8] I. Y. Chuang, T. Y. Fan, C. H. Lin, C. N. Liu, and J. C. Yeh, “HW/SW co-design for multi-core system on ESL virtual platform,” in Proceedings of the International Symposium on VLSI Design, Automation and Test (VLSI-DAT ’11), pp. 149–152, April 2011. [9] I. Y. Chuang, C. W. Chang, T. Y. Fan et al., “PAC Duo SoC performance analysis with ESL design methodology,” in Proceedings of the 8th IEEE International Conference on ASIC (ASICON ’09), pp. 399–402, October 2009. [10] M. K. Chung, S. Na, and C. M. Kyung, “System-level performance analysis of embedded system using behavioral C/C++ model,” in Proceedings of the IEEE VLSI-TSA International Symposium on VLSI Design, Automation and Test (VLSI-TSADAT ’05), pp. 188–191, April 2005.
[11] M. C. Chiang, T. C. Yeh, and G. F. Tseng, “A QEMU and SystemC-based cycle-accurate ISS for performance estimation on SoC development,” IEEE Transactions on Computer-Aided Design of Integrated Circuits and Systems, vol. 30, no. 4, pp. 593– 606, 2011. [12] T. C. Yeh, G. F. Tseng, and M. C. Chiang, “A fast cycle-accurate instruction set simulator based on QEMU and SystemC for SoC development,” in Proceedings of the 15th IEEE Mediterranean Electrotechnical Conference (MELECON ’10), pp. 1033–1038, April 2010. [13] T. C. Yeh, Z. Y. Lin, and M. C. Chiang, “Optimizing the simulation speed of QEMU and SystemC-based virtual platform,” in Proceedings of the 2nd International Conference on Information Engineering and Computer Science (ICIECS ’10), December 2010. [14] T. C. Yeh, Z. Y. Lin, and M. C. Chiang, “Enabling TLM-2.0 interface on QEMU and SystemC-based virtual platform,” in Proceedings of the IEEE International Conference on Integrated Circuit Design and Technology (ICICDT ’11), May 2011. [15] “Draft ITU-T Recommendation and Final Draft International Standard of Joint Video Specification,” Joint Video Team, ITUT Recommendation H. 264 and ISO/IEC, 14496-10 AVC, 2003. [16] ARM, http://www.arm.com/. [17] eCos, http://ecos.sourceware.org/redboot/. [18] Qt-PROJECT, http://qt-project.org/. [19] “GUN gprof,” http://www.cs.utah.edu/dept/old/texinfo/as/ gprof toc.html. [20] Altera, http://www.altera.com/.
International Journal of
Rotating Machinery
Engineering Journal of
Hindawi Publishing Corporation http://www.hindawi.com
Volume 2014
The Scientific World Journal Hindawi Publishing Corporation http://www.hindawi.com
Volume 2014
International Journal of
Distributed Sensor Networks
Journal of
Sensors Hindawi Publishing Corporation http://www.hindawi.com
Volume 2014
Hindawi Publishing Corporation http://www.hindawi.com
Volume 2014
Hindawi Publishing Corporation http://www.hindawi.com
Volume 2014
Journal of
Control Science and Engineering
Advances in
Civil Engineering Hindawi Publishing Corporation http://www.hindawi.com
Hindawi Publishing Corporation http://www.hindawi.com
Volume 2014
Volume 2014
Submit your manuscripts at http://www.hindawi.com Journal of
Journal of
Electrical and Computer Engineering
Robotics Hindawi Publishing Corporation http://www.hindawi.com
Hindawi Publishing Corporation http://www.hindawi.com
Volume 2014
Volume 2014
VLSI Design Advances in OptoElectronics
International Journal of
Navigation and Observation Hindawi Publishing Corporation http://www.hindawi.com
Volume 2014
Hindawi Publishing Corporation http://www.hindawi.com
Hindawi Publishing Corporation http://www.hindawi.com
Chemical Engineering Hindawi Publishing Corporation http://www.hindawi.com
Volume 2014
Volume 2014
Active and Passive Electronic Components
Antennas and Propagation Hindawi Publishing Corporation http://www.hindawi.com
Aerospace Engineering
Hindawi Publishing Corporation http://www.hindawi.com
Volume 2014
Hindawi Publishing Corporation http://www.hindawi.com
Volume 2014
Volume 2014
International Journal of
International Journal of
International Journal of
Modelling & Simulation in Engineering
Volume 2014
Hindawi Publishing Corporation http://www.hindawi.com
Volume 2014
Shock and Vibration Hindawi Publishing Corporation http://www.hindawi.com
Volume 2014
Advances in
Acoustics and Vibration Hindawi Publishing Corporation http://www.hindawi.com
Volume 2014