Finance Letters, 2003, 1, 1-4
The Measurement of Operating Performance Following Corporate Acquisitions: A Comparison of Event-Time to Calendar-Time Measures Allan C. Eberhart a,* and Akhtar R. Siddique b a
b
Georgetown University, USA Office of the Comptroller of the Currency, USA Abstract
We examine a sample of 1,175 firms following their acquisition of another firm. Consistent with previous work, we measure the operating performance of these firms in event-time, and find that they experience significantly positive abnormal operating performance subsequent to their acquisition. When we measure their abnormal operating performance in calendar-time, however, we find that our sample firms’ abnormal operating performance is insignificant. In short, we find that the standard event-time measures of abnormal operating performance overstate the benefits of corporate acquisitions. Key words: Mergers and Acquisitions, Operating Performance, Corporate Finance JEL classification: G14, G30, G34
1. INTRODUCTION Many studies in empirical corporate finance examine firms’ operating performance following corporate events such as seasoned equity offerings (SEOs; e.g., Loughran and Ritter, 1997), stock repurchases (e.g., Nohel and Tarhan, 1998), and mergers and acquisitions (e.g., Heron and Lie, 2002). Though the details of the operating performance measures differ across these studies, they all measure operating performance in eventtime. For example, if a firm conducts an SEO in 1993, then this year can be designated event year 0, 1994 is event year 1, 1995 is event year 2, etc. A firm’s abnormal operating performance is defined typically as its raw operating performance minus the operating performance of its matched firm (e.g., a firm in the same industry as the sample firm and with similar characteristics) and cross-sectional statistics, such as the median abnormal operating performance, are computed for firms with a common event time (i.e., the calendar period is irrelevant as long as the event occurs during the sample period). In this study, we show that these event-time measures of abnormal operating performance are biased toward significance for the same reasons that event-time measures of abnormal stock returns are biased. Event-time measures of (long-term) abnormal stock returns following corporate events have been used in many studies. These studies test the null of the efficient market hypothesis (EMH) that abnormal stock returns should be insignificant, and many report evidence against the EMH (e.g., Eberhart and Siddique, 2002). Fama (1998), however, argues that these event-time measures of abnormal returns are biased toward finding significant abnormal returns, and consequently biased toward rejecting the EMH, for two reasons. First, the event-time returns have a cross-sectional dependence problem that biases the standard error downwards. Second, these event-time returns usually assign equal weights to small firms and large firms (e.g., they use equal-weighted average returns), and equal-weighting does not capture the total wealth effect experienced by investors. *
Corresponding author. Email:
[email protected] Eberhart received support from a McDonough School of Business Research Grant and a Steers Faculty Research Fellowship. We thank Lisa Fairchild for her helpful comments. ISSN 1740-6242 © 2003 Global EcoFinance™ All rights reserved.
1
Eberhart and Siddique
2
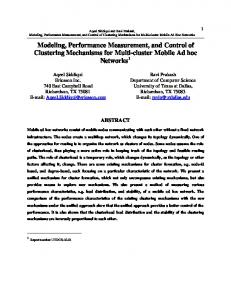
To circumvent these biases, Fama (1998) recommends the use of value-weighted calendar-time returns. A calendar-time return is a portfolio return computed as of a particular calendar period; for example, the average return in January 1988 for a sample of firms following their SEOs. The difference between this portfolio return and its expected return is the abnormal return for that month (this can also be done for a particular year, or any other calendar period). The average of these monthly abnormal returns is computed over the sample period, and their significance is based on their time-series variation (see, for example, Eberhart and Siddique (2002) for an application of this technique to stocks and bonds). Eckbo, Masulis and Norli (2000), and Brav, Geczy and Gompers (2000) examine abnormal stock returns following SEOs and fail to reject the EMH with value-weighted calendar-time abnormal returns (using their respective models of expected stock returns). Loughran and Ritter (2000), however, argue that the valueweighted calendar-time abnormal return measure is biased in favour of the EMH because it obscures the mispricing that is more likely to occur with smaller firms. Nevertheless, they acknowledge the importance of Fama’s (1998) arguments by reporting this measure in their examination of abnormal stock returns following SEOs. With their models of expected stock returns, they continue to reject the EMH with value-weighted calendar-time abnormal stock returns. Therefore, any bias in these return measures in favour of the EMH only strengthens their results. As mentioned above, we show that the concerns about biases in event-time measures of abnormal stock (or bond) returns also apply to event-time measures of abnormal operating performance, and yet no previously published study has examined the significance of this bias. We examine the operating performance of a sample of 1,175 firms following their acquisition of another firm. Consistent with previous work, we find that our sample firms’ event-time abnormal operating performance is significantly positive in the 5-year period following their acquisition. When we compute the value-weighted abnormal performance in calendar-time, however, the abnormal operating performance becomes insignificant. We do not conclude from these findings that event-time measures of operating performance used in previous studies are invalid. Our point, again, is that these measures are biased toward finding significant abnormal performance.1 Therefore, a comprehensive investigation of abnormal operating performance should include a calendar-time measure. 2. SAMPLE SELECTION AND DESCRIPTIVE STATISTICS Our initial sample consists of 3,308 firms that complete an acquisition between January 1, 1977 and December 31, 1992, as reported by Securities Data Corporation (SDC) in their Mergers and Acquisition database. When we require that these firms have the necessary data available in Compustat, our final sample consists of 1,175 firms. We show the descriptive statistics for our sample firms in Table 1. The average (1997) US dollar sales, total assets, and common stock value are all over one billion for our sample firms. Our typical and average sample firm is also a growth firm as estimated by their market to book ratios. Table 1. Descriptive Statistics Sales Book Value of Total Assets Market Capitalization of Common Stock Market to Book Ratio
Mean Median Mean Median Mean Median Mean Median
(in millions of 1997 US dollars) 2,627 493 5,825 1,048 1,645 437.29 2.47 1.60
This table provides summary statistics for the sample of 1,175 firms that acquire another firm between 1977 and 1992. A firm’s market to book ratio is estimated as the sum of its common stock and book value of debt divided by the book value of its total assets. All dollar figures are reported in millions of 1997 US dollars.
1 Of course, in contrast to abnormal stock return tests, abnormal operating performance tests do not provide direct evidence on the EMH. Evidence of significant abnormal operating performance has been used, however, to bolster previous findings of significant abnormal stock returns. For example, Loughran and Ritter (1997) argue that the decline in operating performance following SEOs, that they report, is consistent with the negative abnormal stock returns following these offerings (i.e., the market appears to be underreacting to the negative consequences of an SEO).
Eberhart and Siddique
3
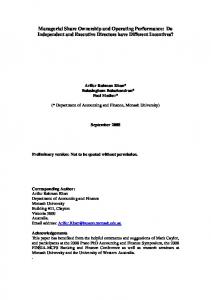
3. METHODS AND RESULTS For the event-time operating performance, we measure our sample firms’ annual abnormal operating performance for five years following the year in which they acquire another firm (i.e., year 0). Following Heron and Lie (2002), we measure raw operating performance as operating income (Compustat Item 178) divided by sales (Compustat Item 12), and we refer to this measure as the profit margin (PM). We follow the standard procedure of choosing matched firms. That is, we begin with a group of matched firms in the same 2-digit SIC code as the sample firm. The matched firm is defined as the firm with the lowest combined absolute difference (with the sample firm) in the PM, size (i.e., equity capitalization, defined as Compustat Item 25 times Compustat Item 199), and book-to-market ratio as of year 0 (defined as Compustat Item 60 divided by the equity capitalization). As noted above, a sample firm’s abnormal operating performance (i.e., its abnormal profit margin (APM)) is the firm’s raw PM minus its matched firm’s PM. We compute these measures annually in event time for year 1 through year 5, or the last year data are available. Because each matched firm has an operating performance close to the sample firm by design (as of year 0), the null hypothesis is that the difference in the PM of these firms (i.e., the APM) should be insignificantly different from zero for years 1 through 5. We also compute each firm’s average APM for years 1 through 5. Because of the skewness in event-time operating performance measures across firms, many studies (e.g., Loughran and Ritter, 1997) present median measures, and we follow this convention. That is, we compute the (cross-sectional) median abnormal performance for each event year, and for the firms’ average abnormal performance (measured over their event years 1 through 5). Table 2. Abnormal Operating Performance in Event-Time and Calendar-Time Following a Corporate Acquisition Event-Year 1 Event-Year 2 Event-Year 3 Event-Year 4 Event-Year 5 Event-Years 1-5 Calendar-Time
APM (%) 0.71 0.70 0.61 0.50 0.38 0.49 0.82
P-value 0.00 0.00 0.00 0.00 0.10 0.02 0.15
We examine the operating performance of 1,175 firms following their acquisition of another firm between 1977 and 1992. For the event-time operating performance, we measure our sample firms’ median annual abnormal operating performance (i.e., the abnormal profit margin (APM)) for each of the five years following the year in which they acquire another firm (i.e., event years 1 through 5). We also compute the (cross-sectional) median of the firms’ average abnormal operating performance (measured over event years 1 through 5). The performance measures are reported in percent, and the p-values are based on the Wilcoxon signed-rank test. For the calendar-time operating performance, we compute a value-weighted average (across our sample firms; using total assets as the weight) of the abnormal operating performance for each calendar year over the 1977 to 1997 period (where a sample firm is included if the calendar year is within the 5-year period following its acquisition). Then we compute the average of this “portfolio” time-series of annual abnormal performance measures, using the time-series volatility of these annual measures to compute the significance of this average over the 1977 to 1997 period (the p-value for this measure is based on the t-test and is corrected for heteroskedasticity using the White test).
The results in Table 2 show that our sample firms experience significantly positive (event-time) abnormal operating performance for each of the five years following their acquisition of another firm. Moreover, the APM measured over years 1 through 5 is also significantly positive. These results are consistent with Heron and Lie (2002) in showing that acquiring firms benefit from acquisitions. For the calendar-time measure of abnormal operating performance, we follow the standard practice used in studies computing calendar-time abnormal stock returns.2 That is, we compute a value-weighted average (across our sample firms; using total assets as the weight) of the abnormal operating performance for each calendar year over the 1977 to 1997 period (where a sample firm is included if the calendar year is within the 5-year period following its acquisition).3 Then we compute the average of this “portfolio” time-series of annual abnormal performance measures, using the time2
The only notable difference is that we do not use an asset pricing model (for example, the Fama and French three-factor model) to estimate expected performance, as is done often with studies examining calendar-time abnormal stock returns. We follow the convention of using a matched firm as a measure of expected operating performance (i.e., the difference between the sample firm’s PM and its matched firm’s PM is the APM). So this APM is the same APM we use in event-time. As suggested above, the difference between the calendar-time and event-time measures is how this APM is weighted across firms and over time. 3 We compute the operating performance through 1997 since our last year 0 is 1992. Unless otherwise stated, we use the terms operating performance and abnormal operating performance interchangeably.
Eberhart and Siddique
4
series volatility of these annual measures to compute the significance of this average over the 1977 to 1997 period. We correct the standard error for any heteroskedasticity (White, 1980) that may result from the different number of firms that are in the sample each year. The last row in Table 2 shows the calendar-time operating performance result. In contrast to the event-time measure, this abnormal performance measure is insignificantly different from zero. Therefore, this measure shows that firms do not benefit from corporate acquisitions. Considering the event-time and calendar-time results jointly, the evidence is mixed on whether firms benefit from acquisitions. 4. CONCLUSIONS The measurement of operating performance following corporate events is a large and growing part of the empirical corporate finance literature. Though recent work on long-term abnormal stock returns recognises the biases in event-time measures, we are not aware of any study that examines the effect of these biases on operating performance measures. We show that these biases matter with our sample of firms that complete acquisitions. With our standard event-time measures of operating performance, these acquisitions appear to generate significantly positive abnormal operating performance for the acquiring firms. Yet the abnormal operating performance measured in calendar-time is insignificant. In short, we find that the standard event-time measures of abnormal operating performance overstate the benefits of corporate acquisitions. Our findings suggest that all future operating performance studies should include calendar-time measures.
REFERENCES Brav, A., G. Christopher and P.A. Gompers (2000) Is the Abnormal Return Following Equity Issuances Anomalous, Journal of Financial Economics, 56, 209-249. Eberhart, A.C. and A. Siddique (2002) The Long-Term Performance of Corporate Bonds (And Stocks) Following Seasoned Equity Offerings, Review of Financial Studies, 15, 1385-1406. Eckbo, B.E., R.W. Masulis and Ø. Norli (2000) Seasoned Public Offerings: Resolution of the “New Issues Puzzle,” Journal of Financial Economics, 56, 251-291. Fama, E.F. (1998) Market Efficiency, Long-Term Returns, and Behavioral Finance, Journal of Financial Economics, 49, 283-306. Heron, R. and E. Lie (2002) Operating Performance and the Method of Payment in Takeovers, Journal of Financial and Quantitative Analysis, 37, 137-155. Loughran, T. and J.R. Ritter (1997) The Operating Performance of Firms Conducting Seasoned Equity Offering, Journal of Finance, 52, 1959-1970. Loughran, T. and J.R. Ritter (2000) Uniformly Least Powerful Tests of Market Efficiency, Journal of Financial Economics, 55, 361-389. Nohel, T. and V. Tarhan (1998) Share Repurchases and Firm Performance: New Evidence on the Agency Costs of Free Cash Flow, Journal of Financial Economics, 49, 187-222. White, H. (1980) A Heteroskedasticity-Consistent Covariance Matrix and a Direct Test for Heteroskedasticity, Econometrica, 48, 817-838.