THE MODELLING OF BRANCHED STRUCTURES USING A SINGLE POLYGONAL MESH† J. LLUCH, M. J. VICENT, S. FERNANDEZ, C. MONSERRAT, R.VIVO Computer Graphics Section Department of Computer Systems and Computation Valencia University of Technology (Spain) E-mail:
[email protected]
ABSTRACT This paper presents a method to obtain a single continuos polygonal mesh representing a branched structure taken from a tree and modelled by a L-systems-based method. A refinement process is made once the model of the tree is obtained. This process produces smooth transitions in the tree areas joining the branches. That is, the overlapping problems and geometry discontinuities are avoided. Because of this process, a continuous polygonal mesh that represents all the tree branches is generated. This mesh allows mesh simplification algorithms. Keywords. Computer Graphics, polygonal mesh, modelling of natural phenomena, modelling of vegetable species.
parameterisation [5] of some tree characteristics obtained by observing different species have also been used to model trees in order to make the visual result noticeable. The model used in this work to generate trees is based on the parametric L-systems. The main difference is the use of random variables inside the system and the making of special modules that allows chain derivation control. There is a great variety of models for tree generation . However, none of them creates a homogeneous geometric structure to render the generated objects. The final result of the methods studied is a union of different geometric models that represent each branch or branch segment. The primitive and mostly used ones are: truncated cones, generalised cylinders and polygon meshes for each branch.
1. Introduction Natural environments modelled by a huge amount of geometry cause a great number of problems. So, it is necessary to use techniques capable to accelerate this kind of scene visualisation. This work introduces a method to allow the modelling of a tree, plant or any other branched form, using a single polygonal mesh. This mesh is suitable for applying simplification techniques. Vegetable species modelling is a computer graphic field studied by many authors. Initially, the main motivation for vegetable species modelling was biological. The first steps in this field were made by biologist Aristid Lindenmayer who formulated the L-system model for its application in cellular interaction. This simple model was developed later by Prusinkiewicz [1] for its application to vegetable species. The model is based on rewriting rules concepts. Starting from an initial module called axiom, the rules are applied in parallel, obtaining a chain that may be interpreted in a graphic form. Particle systems [2], fractals [3], models based on botanical principles [4], or methods based on the † This work was supported by TIC1999-0510-C02-01
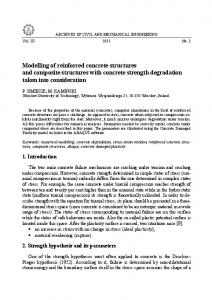
Figure 1. Visibility and discontinuity problems due to using primitive unions. Using truncated cones to obtain curved branches may generate discontinuities. Problems also arise when using generalised cylinders or meshes for each branch when representing bifurcations, because the polygons belonging to different branches overlap. This produces visibility problems (see figure 1). Therefore, it is necessary to develop a solution in order to obtain a single polygon mesh representing the whole tree structure. When rendering ecosystems, a great amount of trees must be represented simultaneously [6][7]. In this kind of applications, a fast visualisation of every model is very important. Obtaining a single mesh will allow a multi-
resolution structure adapted to the branched model structure.
2. Materials and methods The interpretation of the resulting chain provided by the iteration of a RL-system generating vegetal species, may be used to construct a tree formed by a single triangular mesh. This process goes through three sequential phases: • • •
Tree representation phase. Tree knot refinement phase. Polygonal model obtaining phase.
We use a tree-like hierarchic structure in order to store the contours generated by the turtle. Each node of this tree is formed by: the corresponding contour generated by the turtle, a transformation matrix that will contain the rotation and translation operations allowing the turtle to pass from the previous node (node father) to the present one, a pointer to the following brother node, a pointer to the first child node and a pointer to the father node (see figure 3). The father node is that from which the turtle started (starting point movement) to arrive to the present node (point end of movement). All the children nodes that belong to the same father are linked together by a crossed list ordered by generation time. A father node only has a direct link to his first child node.
The result of the last phase is a single 3D triangular mesh that represents the tree built by the RL-system.
2.1. Tree representation Chain interpretation is based on the “turtle” metaphor habitually used in graphic application development with the programming language LOGO [1]. This turtle is characterised by a position, an orientation and a stack-like structure that allows storing previous positions and orientations. Any movement is generated from the present position in the direction marked by the present orientation. The turtle generates a graphic primitive between the initial and final position indicated by this movement. Besides, at any time, the turtle can recover a previous position and orientation stored in the associated stack. Our research team has developed a turtle interpreter. It can change the turtle orientation by turn operations for every orthogonal 3D axis associated to the turtle. The movement is always generated in the direction marked by the H axis (Head). In each movement, the turtle creates a contour (elliptic or circular) in the initial position and another one in the final position. The contour size depends on the thickness and inclination of the branch to be constructed at that time (see figure 2).
Figure 3. Contents of a node. The input chain interpretation generates this hierarchic structure from which a triangular mesh is generated. This mesh will respect the shape of the contours and the topology set by the structure obtained during this phase.
2.2. Obtaining a polygonal model The polygonal model construction uses a library developed by our research group [8]. This library allows to obtain a triangular mesh from a contour sequence.
node11
node12
node1
root
Figure 4. Triangle mesh generation between two adjacent sections.
Figure 2. Turtle geometry and parameters.
The reconstruction library is applied to the triangular mesh generation between pairs of consecutive sections. In the algorithm presented in this work, the lower section
will always be composed of a single contour that is a part of the father node. On the other hand, all the children nodes related to the present father node will form the higher section.
structure generated in the tree representation phase. The result presents visually inaccurate geometry at the union point with the father node. In order to improve the result, a structure refinement is performed as a previous step before obtaining the polygonal model (see figure 5).
As shown in figure 4, the reconstruction library is directly applied to generate the triangular mesh from the
Figure 5. Subcontour insertion performed by the Interval Refinement Method.
2.3. Union refinement We developed an algorithm called refinement by intervals in order to correct the geometrical errors that appear at the union points (tree knots) of the branches. This method allows to add an equally-spaced-in-height set of new contours to the structure, between the father and the children nodes. These contours are added from the union point of the branches up to the place where they are completely separated (see figure 5).
The interval refinement implies that the tree branches are represented by contours defined by cylinders or truncated cones. The primitive height and width are equal to the represented branch length and thickness. Assuming this, the intermediate contours generation follows the following three-step sequence:
b)
a)
c)
d)
Figure 6. Ellipse parameter calculation.
•
h = pz =
Parameter calculation for the ellipses obtained when sectioning the cylinders at a given height. We calculate the ellipse radius first, as you can see in figure 6 (picture a and b):
vz
vx δ = arccos v x2 + v y2 + v z2
re r =r , Re = , e c sin(α ) then, we calculate the centre of the ellipse, using the height where it is to be translated, and the rotation angle that situates the ellipse onto its final position (see figure 6, pictures c and d):
− (px ⋅ vx + p y ⋅ v y )
•
,
.
Single contour generation from the ellipses obtained for every fixed interval from the father node up to the point in which all the ramifications are separated (see figure 7).
Ellipse points direction
Initial point
Added point
Next point
Figure 7. Single contour generation obtained from intersection between edges. •
Finally, a node is built with the contour generated in the previous step. This node is added to the tree structure. This structure is generated by the input chain interpretation of the present algorithm. This node addition procedure respects the tree structure.
The amount of contours inserted will depend exclusively on the inclination of the cylinders. If their inclination is small with respect to the plane defined by the father node contour, the method will detect the absence of intersections between the ellipses in a few iterations. Therefore, the number of nodes to be inserted will be lower. On the other hand, if the cylinders show a big inclination angle, the separation point will be very far from their base and, accordingly, a lot of intermediate nodes will be inserted for the same interval value.
3. Results
cost of increasing, at worst, around 20 times the temporal cost and 4 times the spatial cost. But notice that this process is performed only the first time, when you generate the polygonal model. The inclusion of these elements when generating virtual fields is the main objective of these kind of reconstructions. The spatial cost increment demands the application of decimation processes that respect the topology of the meshes. When applying a decimation algorithm to the reconstructions obtained with the algorithm described in this work, we achieve a 80% reduction in the number of mesh triangles. This reduction does not affect the visual improvement reached by the Interval Refinement Method. The use of unions of primitives produces visibility and discontinuity problems. This problems are solved using our algorithm as shown in figure 8.
The output of the algorithm described in the present work is a single triangular mesh that represents a 3D tree coded by a character string input. Figure 9 shows the result after applying the reconstruction algorithm. These results are shown with and without applying the refinement method. The reconstruction result with refinement is visually better. Table 1 shows a comparison between the number of triangles generated by the Interval Refinement Method and those generated by the Direct Method. This table proves that the visual improvement is performed at the
Figure 8. Solution to visibility and continuity problems.
• • •
Solving problems such as discontinuities and geometry overlapping. Implementing dynamic models, wind effects-like, on the mesh. Applying simplification methods to polygon meshes
Obtaining details after the application of simplification methods presents many difficulties such as the spatial cost increment and the discontinuity between different levels. These difficulties may cause undesired visual effects when performing the transition between two levels. For these reasons we intend to implement, in a future work, a multi-resolution model allowing smooth transitions with a reasonable spatial cost increment. We think that it is possible to apply continuous textures through all the model. We also propose the use of parametric curves to represent the branch contours and paths in order to improve the descriptive power of the method.
References [1] P. Prusinkiewicz, A. Lindenmayer, The algorithmic beauty of plants, (New York, Ed. Springer-Verlag, 1990). [2] W. Reeves, Aproximate and probabilistic Algoriths for Shading and Rendering Structured Particle Systems. Proc Siggraph’85, 22-26.
Figure 9. Results after applying the algorithm to a chain generated by a RL-system. The image on the left shows the resulting 3D tree without the application of the Interval Refinement Method. The image on the right shows the same tree with refined knots.
Contour resolution
Polygons generated
Required time
Original tree
Interval refining
Original tree
Interval refining
5
826
1942
330ms
10
1962
4442
1s 100ms
7s 310ms
15
2106
7810
1s 700ms
22s 250ms
1s 480ms
Table 1. Temporal and spatial cost comparative of the tree reconstructed with the Direct Method and using refinement by intervals for different contour resolutions.
4. Conclusions and future works We have presented in this work a new model to represent a branched structure in a homogeneous form: trees, plants…etc. The homogeneous model representation allows for:
[3] P. E. Oppenheimer, Real Time Design and Animation of Fractal Plants and Trees, Proc. Siggraph '86, Dallas Texas, 1986, 18-22. [4] P. de Reffye, C. Edilin, J. Françon, M. Jaeger, C. Puech, Plant Models Faithful to Botanical Structure and Development, Siggraph’ 88, 151-158. [5] J. Weber and J. Penn, Creation and Rendering of Realistic Trees, Siggraph 95, 119-128. [6] D. House Et al, Visualizing a real forest, IEEE Computer Graphics and Aplications, 18 (1), 1998, 12-15. [7] N. Max, Hierarchical rendering of trees from precomputed multi-layer Z-buffer. Rendering Techniques 96 (Wien,Springer Verlag, 1996), 165-174. [8] S. Fernández, Sistema de interpolación 3D de una gramática RL para la edición de entornos naturales, Facultad de Informática, Universidad Politécnica de Valencia (Spain).