of the project involved workers with back- grounds in hydrocarbon, water, radioactive waste, mining .... Downloaded from ..... Critical point in coupled mechanics and fluid flow. (a) Fluid flow ...... Professor Stuart Crampin whilst writing the paper, ..... paper0579.pdf. CRAMPIN, S. ~z ... HEFFER, K.J., FOX, R.J., MCGILL, C.A. &.
Downloaded from http://sp.lyellcollection.org/ by guest on May 1, 2017
The NERC Micro to Macro Programme: implications for fluid resource management K. J. HEFFER
Institute o f Petroleum Engineering, Heriot Watt University, Edinburgh EH14 4AS, UK
Abstract: The Micro to Macro (I~2M) Programme has been focused on developing understanding of subsurface fluid flows within geological heterogeneities spanning wide ranges of spatial and temporal scales. This paper highlights the opportunities for industries to incorporate recent observations and emerging theories in this field towards improved fluid resource management. The background to, and objectives of, the 1~2M Programme are reviewed. Selected results from the projects in the programme are discussed and, where possible, compared with evidence from industrial field data. Some conclusions and recommendations for future practice in reservoir characterization are made. For example, there is currently very little recognition of modern theories that point to the likelihood of prevailing criticality in the mechanical state of the Earth's crust and its implication for coherent large-scale collective behaviour emerging from small-scale interactions. Also associated with criticality are long-range spatial correlations and the likelihood that flow properties change during the life of commercial developments: such changes, for example, to absolute permeability, should be looked for and analysed for spatial and temporal patterns. Allied with these features is the importance of coupled processes, principally geomechanics, fluid flow, heat flow and chemistry. Knowing that local faults and fractures play a strong role in fluid flow mechanisms in a potentially time-varying, rather than just a static, fashion, gives even more motivation for acquiring detailed information on micro- and macro-structure over a range of scales.
Industries whose resources lie in the subsurface base most of their planning and investment decisions on models of their sites that require numerical description of the geology. Such modelling has often turned out to be inadequate. The commercial consequences of poor geological modelling can be particularly severe where fluid flow is involved because fluid flow is governed by the spatial arrangement of extremes in the range of permeabilities. The Micro to Macro (p~2M) Programme has been focused on developing understanding of the relationships between measured and modelled subsurface fluid flows, spanning the range of spatial and temporal scales relevant to fluid resource management. The programme was motivated by observations and emerging theories of how geological heterogeneities vary across these ranges in scales, and the consequences for extrapolating fluid behaviour both in time and space; the aim was to provide a clearer physical understanding on which to base more effective geofluid management and to allow better integration of data for reservoir characterization and improved models for fluid flow. The scope of the project involved workers with backgrounds in hydrocarbon, water, radioactive waste,
mining, and geothermal industries and a major objective was to foster communication between disciplines and communities to mutual benefit. In order to place the aims and achievements of the ~2M Programme into context, it is worth first outlining the current standard practice in exercises of characterizing the geology of subsurface commercial resources. Of course, this outline can only be of a general norm, about which there will be, in any one industry, examples of greater or less sophistication.
Current standard practice in characterization of geology and its shortfalls Efforts to improve the realism of spatial distributions of heterogeneity in exercises of reservoir characterization in the oil industry began in the late 1970s and early 1980s, essentially with liaison between sedimentologists, geostatisticians and reservoir engineers. Parallel developments began in the groundwater industry. Models of spatial covariance in heterogeneities were dominated by the statistics of sedimentological data, gleaned mostly from outcrop studies.
From: SHAW,R. P. (ed.) 2005. Understanding the Micro to Macro Behaviour of Rock-Fluid Systems. Geological Society, London, Special Publications, 249, 5-27. 0305-8719/05/$15.00 9 The Geological Society of London 2005.
Downloaded from http://sp.lyellcollection.org/ by guest on May 1, 2017
6
K.J. HEFFER
Most early applications employed limited range variograms and Gaussian frequency distributions. Alternatively, geological bodies were modelled as 'objects' distributed in space, with correlated internal heterogeneities. Later, methods were developed to incorporate so-called 'soft' information on heterogeneities from seismic data. The pioneering work of Hewett (1986) in using fractal interpolation functions (fractional Brownian motion and fractional Gaussian noise) has been applied to many reservoirs since (e.g. Hardy & Beier 1994). However, such modelling has lacked a detailed geoscientific basis, and is, therefore, probably incomplete, for example in anisotropy or relationship to other known structural features. Treatment of structural discontinuities in characterization models was led by the geothermal, mining and radioactive waste industries. Initially, in the hydrocarbon industry, only large, seismically 'visible' faults were included in reservoir models, mainly as disruptions to the geometric continuity of beds and possibly as 'sealing' membranes. Only recently have characterizations begun to incorporate statistical models of fractures and 'sub-seismic' faults, including variability and anisotropy in their properties. However, a notable exception is conductivity of the faults or fractures, which is often assumed to be uniform and uncorrelated with other properties. Also, many 'realizations' of fracture or fault patterns in stochastic modelling exercises do not appear very realistic to the eyes of structural geologists. More fundamental amongst the deficiencies of current practice in any of the industries is that there is very little recognition of modem theories that point to the likelihood of prevailing criticality in the mechanical state of the Earth's crust and its implication for coherent large-scale collective behaviour emerging from small-scale interactions. This is analogous to the critical point phenomena that occur in continuous phase transitions (in liquid-gas mixtures, metallurgy, magnetism, (super-) conductors, etc.) in thermodynamic equilibrium and on which there is a rich literature. The word 'critical' appears in several contexts in this paper, which, although related and in common use, can cause some confusion; Appendix A attempts to distinguish and clarify those contexts. Concomitant with criticality are long-range correlations, power-law distributions, strong susceptibility to perturbation and the magnification of anisotropies. Allied with these features is the importance of coupled processes, principally geomechanics, fluid flow, heat flow and chemistry. The field evidence for criticality
and its application to hydrocarbon reservoirs are given in Appendix B. Omission of these issues in resource characterization can have many practical consequences. Crampin (1999) outlines some implications, and others are implicit in the results of the individual projects of the ix2M Programme. Two of the key implications will be manifest in both 'static' and 'dynamic' aspects of characterization. 9
9
In 'static' modelling, for example, as well as the immediate implication to use variograms with long-range correlation, there is also the consequence that conditioning of stochastic geostatistical models should incorporate distant measured data points as well as more local measurements. More importantly, there is a need to understand the full 3D nature of the scaling that has been observed in many 1D well-log sequences. One possibility is that such scaling has an origin associated with coupled processes at a critical point as outlined above, either modern-day or ancient. If so, there may well be structural patterns to the heterogeneities, implying lineations, strong anisotropy and possible association with older structural trends. In 'dynamic' modelling, the strong stresssensitivity of fault and fracture properties, imply that system permeabilities are likely to change over the development life of a field and that those changes may also exhibit long-range correlations (see also Crampin 1999, 2000).
Currently, time-lapse seismic surveys are showing good promise as a direct means to monitor changing inter-well properties. However, in order to be able to invert the seismic responses with a model containing the complete physics it will be important to incorporate the influence of geomechanical changes in not only the reservoir, but also the over-, under- and side-burdens, on (a) the seismic responses themselves and (b) the reservoir permeability, compressibility and flow behaviour. The prospect of making significant progress with understanding and predicting these complex characteristics of heterogeneities that cover many orders of magnitude in scale was a prime incentive for the ix2M Programme.
Scaling in well-log measurements An allied stimulus for the ~2M Programme was the pre-existing set of observations of spatial correlation in the fluctuations of well-log measurements. Spatial correlation can be described
Downloaded from http://sp.lyellcollection.org/ by guest on May 1, 2017
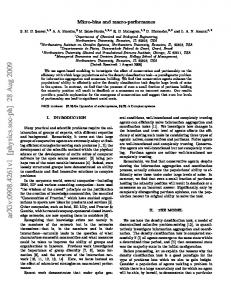
MICRO TO MACRO PROGRAMME: IMPLICATIONS through its Fourier transform, the powerspectrum, which provides the amount of 'power' in the fluctuations at each spatial frequency, or wavenumber, k. Many researchers (e.g. Hewett 1986; Bean & McCloskey 1993; Bean 1996; Holliger 1996; Dolan et al. 1998; Leary 1998, 2002; A1-Kindy 1999; Marsan & Bean 1999; Leary & A1-Kindy 2002) found that fluctuations in heterogeneities in well logs show scaling of a type that is often described as '1/f', 'flicker' or 'pink' noise. In contrast with 'white' noise, in which the power is distributed evenly over all frequencies, the power in 'pink' noise is distributed evenly in logarithm of frequency. For example, there is as much noise power in the octave 2 0 0 - 4 0 0 Hz as there is in the octave 2000-4000 Hz. 'Pink' noise is the most natural sound to human ears. In terms of wavenumber, k, the spectral power densities of the heterogeneities show power-law behaviour:
S(k) ~ 1/k t~
(1)
where/3 ~ 1.0 to 1.6 (see Fig. 1a). For example, A1-Kindy (1999) found average scaling exponent values/3 = 1.02 ___ 0.1 for 245 logs in both sedimentary and crystalline rocks. The power-law behaviour implies that there is no natural scale to the fluctuations. It is worth examining some of the issues and previous work surrounding
7
these scaling relationships in more detail, although it is fair to say that understanding of the origin for the case of natural rock heterogeneities is still limited and that there is a need for further validation in some aspects.
Potential causes o f 1 / k scaling in heterogeneities The 1/k scaling in well logs has been interpreted as symptomatic of the involvement of self-organized criticality (SOC - see Appendix A) in structural deformation, for which there exists many other indications (e.g. Crampin 1994, 2000; Main 1996; Grasso & Sornette 1998; Leary 1998, 2002; Crampin & Chastin 2000). There are, however, several issues surrounding this interpretation that requh'e further investigation. One problem is that the observed 1/k scaling in well logs, although of a power-law nature, is not consistent with power spectra calculated for usual models of critical phenomena in equilibrium thermodynamics, in which exponent /3 ~ 0 (e.g. Binney et aL 1992); nor with the analyses to date of far-from-equilibrium SOC (Somette et aL 1990; Tang & Bak 1988; Somette 2000). This issue has received some attention (Leary 1998; Heifer in press), but still requires resolution.
Fig. 1. (a) Typical power spectra of well logs showing N 1/k behaviour (Marsan & Bean 1999). Copyright (1999) American Geophysical Union. Reproduced by permission of American Geophysical Union). (b) Spatial correlation functions corresponding to fluctuations described by fractional Brownian motion with various values of the Hurst exponent, H; compared with a more common correlation function used in reservoir description (corresponding to an exponential variograrn) with a finite range (indicated by double headed arrow). Note that the fractional Brownian motion correlations have infinite range but with a significant 'nugget' effect.
Downloaded from http://sp.lyellcollection.org/ by guest on May 1, 2017
8 2.
K.J. HEFFER Anisotropy may exist in the scaling: Somette et al. (1990) developed field equations for a
3.
4.
scalar order parameter representing strain in a SOC model of the lithosphere that scales with distance differently for directions either parallel or orthogonal to the main direction of strain transport. Might, for example, the sensitivity of scaling in well logs with deviation be due to horizontal wells sampling across faults/fractures formed in extensional or strike-slip regimes, whilst the vertical wells are sampling sub-parallel to them? Another remaining puzzle is that the spectral densities of well-logs imply antipersistence (i.e. any two consecutive intervals of log, of any length scale above that resolved by the instrument, are anticorrelated: a positive increment of the log is followed, on average, by a negative increment). The heterogeneity distributions in well logs can be modelled with fractional Brownian motion (fBm) with a Hurst coefficient (Hurst et al. 1965), H = ( / 3 - 1)/2. This implies that H < 0.5 and usually ~0. This is in contrast to the persistenee (i.e. a positive increment is followed, on average, by another positive increment) (H > 0.5) found in the long-run behaviour of other geophysical records related to the weather and climate (e.g. Mandelbrot & Wallis 1969; Feder 1988). Leary (2002) has pointed out that well logs are better fitted with fractional Gaussian noise (fGn), such that the fBm that forms the integral of the fGn will show persistence, with H ~ 1. If the scaling of well-log heterogeneities is attributable to strain fluctuation, then its integral will correspond to fluctuations in displacement (the vector joining the initial and final positions of a point in deforming rock). Intuitively, the latter are, indeed, expected to be persistent. Behaviour of a 1/k nature is found in sedimentary rocks as much as crystalline (Leary & A1-Kindy 2002). Although the origin of scaling is often attributed to the scaling of the fracture set along the borehole (Leary 1991; Holliger 1996), Bean (1996) showed that scaling in the lithology distribution can also be taken as a contributing cause. Bean (1996) has examined this scaling carefully in wells penetrating both volcanic and sandstone facies. There is a slight difference in the scaling exponents between these facies. Dolan et al. (1998) concluded that the fractal dimension obtained from well logs does vary with lithology, but the difference is slight and not detectable
by rescaled range or power-spectral techniques for the available data. Dolan et al. (1998) also stated that the fractal dimensions are different because the controlling mechanisms are different: primary porosity in the clastics and fracture porosity in the volcanics. However, both produce antipersistence. Walden & Hosken (1985) also noted anti-correlations in reflection coefficients at small lags in sedimentary sequences, and cited the importance of this property to the viability of the seismic reflection method. Heifer (in press) has pointed out that the scaling of stiffness modulus at the critical point of failure, as determined in several investigations (e.g. Chakrabarti & Benguigui 1997), is consistent with exponent/3 taking a value ~ 1 in the power spectrum of strain: this supports the role of strain in the fluctuations demonstrated by heterogeneities in well logs, particularly in crystalline rocks where fractures are the main heterogeneity. Dolan et al. (1998) appealed to the fractal dimensions of pore-space distributions in sedimentary rock (Krohn 1988), reporting Hurst coefficients for sandstones similar to those from the porosity tools. However, it is difficult to imagine that the geometry of pore space at grain scales and below would be continued to the larger scales investigated by logging tools if the original depositional process were entirely responsible. It is more likely that the similarity of the fractal dimensions of porosity in unfractured rock with those of rock whose porosity does derive mainly from fractures, is due to tectonic/deformational influences on diagenetic processes (compaction, dissolution, cementation, pressure solution) which over-write the statistics of porosity derived from the original depositional process. The influence of tectonism on deposition (e.g. in controlling avulsions of fluvial systems or the accommodation space available for sedimentation) is also probably significant. Practical factors of measurement need to be considered; in particular, the influence of the stress field surrounding the wellbore on measurements by wellbore tools. There are other causes of 1 / k scaling than SOC. Somette (2000, Chapter 14), examines various mechanisms for power laws. Hooge et al. (1994) have argued that seismic processes are scaling tensor multifractal fields (of e.g. strain or stress) in both space and time. In addition, Li (1991) noted that scale invariance usually derives from balance
Downloaded from http://sp.lyellcollection.org/ by guest on May 1, 2017
MICRO TO MACRO PROGRAMME: IMPLICATIONS between two opposing tendencies. In the context of fracturing, the complex patterns surrounding each fracture of positive and negative stress changes, which act to encourage and inhibit further fractures in the vicinity, are potential candidates to fill the role of opposing tendencies.
Implications of 1/k scaling of heterogeneities for stochastic modelling Irrespective of the origin of 1/k scaling, what is
9
the issues discussed above. Reference to the worker(s) on a tx2M project (a list of these appears separately at the beginning of the 'References' section below) is made in the usual manner, but with the acronym '(ix2M)' replacing a year. It is emphasized that the selected results represent only a small proportion of the overall outcome of the programme; other papers in this volume provide more detail of a fuller scope.
Scaling of diagenetic overprint
a partial loss of predictability from well data even in the immediate surroundings; (b) a long-range correlation that has much more widespread influence than 'usual' variograms with finite ranges (see Fig. lb). Crampin (1999), following Leary (1996), has given example realizations of heterogeneities modelled with 1/k spectral densities in contrast with white noise (constant spectral density for all wavenumbers). Crampin (1999) noted 1/k noise implies that fluctuations at long wavelengths are greater than at short wavelengths, implying strong clustering in the distributions of physical properties. However, the degree of difficulty that 1/k noise poses for reservoir geostatistics is still to be evaluated fully: the property of long-range correlation, in that it 'projects' the spatial influence of measurements, may aid the task of interpolation, as long as anisotropy in correlations is catered for. Heifer (2002, in press) is engaged in developing a methodology for interpolating strain and associated indicators, as illustrated further in Figure 10 and its associated text.
What is the influence of diagenesis on the scaling of heterogeneities seen in well logs? Haszeldine et al. (Ix2M) have validated a new non-destructive screening tool, based on measuring the magnetic susceptibility of the sample, for measuring the content of certain clays, in particular illite, quickly and cheaply. By examining samples from a shoreface facies at different depths in a North Sea reservoir, the co-workers have shown that permeability is correlated strongly with percentage illite content as measured with the new tool, with the interpretation that the illite is filling the remanent pore space left by quartz overgrowths from a previous diagenetic episode. The measurement technique has also been applied to, and is helping to explain the diagenetic histories of, other North Sea reservoirs, including the interpretation of cementation of faults in the Moray Firth through hot fluids advecting cement from the deeper basin. An additional investigation which is highly relevant to the explanation of the 1/k spectral densities of well logs was collection of values of illite % from foot-by-foot core samples, so that the power spectrum could be calculated from this larger bandwidth. A strong spatial correlation between porosity and permeability has been reported in Brae oil field sediments, together with a systematic power-law scaling of log (permeability) over spatial frequencies from 5 km-1 to 3000 km-1 (Leary & A1-Kindy 2002). This was interpreted to result from longrange correlated fracture-permeability networks. The power spectrum of the illite data ostensibly indicated a spatial correlation exponent of 0.54, in line with the porosity and permeability correlation. However, the interpretation is not definitive: the errors involved in the transform from the magnetic data to illite % may have interfered with the interpretation of correlation.
Selected results of the Micro to Macro Programme
Evolution of fracture systems through diagenesis
The following results of the ~2M Programme have been selected on the basis that they illustrate
Diagenetic changes to a pre-existing fracture system can alter its properties significantly. Full
the practical significance of this in reservoir characterization, particularly stochastic modelling exercises? The spatial correlation that is equivalent to 1/k spectral densities (strictly generalized autocovariance function, GACV) is ~log(r), where r is the lag distance (Greenhall 1999). For spectral densities of the form 1/k t~, where/3 r 1, the GACV varies with lag distance as r (t~- 1~.These covariance functions are obviously long-range in nature, although they have a sharp drop-off at small lag distance (Fig. lb). These forms of correlation imply:
(a)
Downloaded from http://sp.lyellcollection.org/ by guest on May 1, 2017
10
K.J. HEFFER
coupling of chemistry with thermal, hydraulic and mechanical processes can be involved, because permeability is often associated with periods of tectonism. However, a lower degree of coupling can arise from the passage of groundwaters through mechanically stable rock, changing the permeability by erosional and/or chemical processes. Such restricted coupling may be applicable to sedimentary aquifers, particularly fractured sandy aquifers or fractured carbonate aquifers, such as the Chalk aquifer of NW Europe, which may be modified significantly over relatively short geological time-scales. Bloomfield & Barker (tx2M) have developed a 2D model (MOPOD) to investigate general relationships in fracture aperture growth and the geometry of evolved fracture apertures using generic growth laws and simple fracture geometries. The work is intended as a precursor to future systematic studies of the emergent behaviour of dynamic fractured aquifer systems. Basic features of the evolved fracture aperture arrays were summarized by Bloomfield et al. (2005). Most pertinent to this discussion of scaling is that the effective permeabilities of the arrays increase as power-law functions of time; the exponent decreases with increase in the erosion parameter (Fig. 2). Effective permeabilities are also lower at the higher values of
20 18 16 14 r I.--
12 10
9 0
e=0.2 e=0.3
&
e=0.4
A 9 []
e=0.5 e=0.6 e=0.7
8
o
6
o
9 9
o o i
0
20
40
60
80
i
100
Time Fig. 2. Fracture porosity development modelled with a generic law for aperture growth (from Bloomfield et al. 2005). Effective transmissivities (TEFF) of the arrays increase as power-law functions of time; note that the exponent decreases with increase in the erosion parameter, e. (Reprinted from Ground Water, copyright (2005), with permission from Blackwell Publishing).
erosion rate: a single flowpath, albeit wider, is apparently less effective than the dispersed flowpaths. However, it is recognized that parameterization of such arrays and prediction of their evolution in terms of the initial boundary conditions are not trivial tasks. One possibility is to investigate multifractal properties of the spatial distributions of the fracture apertures at various stages of their development, in analogy to the analysis of Zhang & Sanderson (2002, Chapter 7). The modelling has some similarities with that of development of drainage networks by Hergarten & Neugebauer (2001), who argued that stationary patterns arising from fixed boundary conditions cannot reproduce the fluctuations characteristic of SOC; however, SOC characteristics were produced when boundary conditions were periodically changed. This might be another consideration to add to the list of future developments outlined by Bloomfield et al. (2005).
P e r m e a b i l i t y o f individual f r a c t u r e s
The characteristics of flow in an individual fracture have never been satisfactorily defined. The roughness of the fracture surfaces cause significant departures from the cubic law for flow-aperture relationship that is often deployed. Ogilvie et al. (Ix2M) have developed a new capability of non-destructive high-resolution profiling of fracture surfaces that avoids alignment problems of previous methods. From the results of such profiling new software is able to derive statistical parameters of the profiles of fracture surfaces and of the aperture between pairs of surfaces, in order to relate these to fluid flow. From the statistical parameters, synthetic fractures can be modelled with more software developed under the p~2M project. Flow experiments on High Fidelity Polymer Models (HFPM) in association with numerical FEMLAB T M modelling of the Navier-Stokes equation within suites of synthetic fractures have the potential to improve the characteristics of fluid flow modelling in rough fractures. An important influence on fluid and electrical transport within a rough fracture is the anisotropy of the fabric. Ogilvie et al. (lx2M) have demonstrated in an HFPM experiment the different characteristics of flow parallel to, and orthogonal to the fabric of the surface roughness. The anisotropy will, of course, be related to the geometry of deformation that created the fracture. Even more interesting will be two-phase flow experiments with these tools, especially perhaps the stress-sensitivity of
Downloaded from http://sp.lyellcollection.org/ by guest on May 1, 2017
MICRO TO MACRO PROGRAMME: IMPLICATIONS two-phase properties of fractures, which are commonly just assumed at present.
Effective permeability o f fractured or faulted rock In deriving effective permeabilities for fractured rock with non-zero background matrix permeability, it is nearly always assumed that the fracture permeability can be locally added to the matrix permeability. On the contrary, using lattice Boltzmann simulation of flow in simplified 2D porous media over a range of solid fractions, Dardis & McCloskey (1998) illustrated the importance of matrix-fracture flow interactions. Figure 4 from Dardis & McCloskey (1998), reproduced here as Figure 3, indicates that the system permeability of fracture and matrix minus the fracture permeability is well in excess of the matrix permeability. That trend reproduces the similar laboratory results of Mattison et al. (1997). Permeabilities of fractures and matrix rock are non-additive. Fluid coupling seems to multiply (in fact by almost an order of magnitude) the effect of fractures on bulk permeability. This large field of influence of flow in a fracture on flow in the surrounding porous medium has also been demonstrated by further lattice Boltzmann modelling of the effect of a relatively sparse population of fractures, not connected, within a porous matrix; the fractures are modelled to cause increase in permeability much more than the nominal calculation of upscaled bulk permeability from, say, effective medium
11
calculations or direct fine-scale modelling of the system as a macroscale continuum. It seems that the pore-scale feedback from fracture to matrix combines with a feedback from matrix to fracture (J. McCloskey, pers. comm. 2002). The spatial extent of the influence of the fracture flow is widespread across the matrix domain. There are potential implications from this finding for many aspects of fluid flow in fractured rock, including influence on relative as well as absolute permeabilities and even on the attenuation factors for seismic waves. Further investigation of these effects is warranted, including perhaps the influence of viscosity (the modelling was, of necessity, run with a relatively high viscosity). Also vital, however, is a means of validating the numerical modelling with a physical model: this was the task of Cassidy et aL (lx2M), who have developed a particle imaging apparatus with which fluid velocities throughout a complex 2D medium can be measured accurately. The velocity fields measured with this apparatus compare visually very well with those predicted by lattice Boltzmann modelling on the same pattern of heterogeneity. However, although the validation has been very successful semi-quantitatively, the lattice Boltzmann modelling is, as yet, unable to simulate the low viscosities of the physical modelling, which remains a task for a future project. An implication that is potentially very important to fluid resource management is that conductive fractures, even before they become connected, can significantly increase the bulk permeability. As well as investigating
Fig. 3. Non-additive influence of fracture and matrix permeabilities - from lattice Boltzmann modelling (after Dardis & McCloskey 1998, copyright (1998) American GeophysicalUnion. Modifiedby permission of American Geophysical Union): (a) configuration of fracture in host rock and typical velocity profiles; (b) modelled effective permeability of fractured media, Kfm,reduced by the fracture permeability, Kf, is much greater than the unfractured matrix permeability, Kin.
Downloaded from http://sp.lyellcollection.org/ by guest on May 1, 2017
12
K.J. HEFFER
non-linear interactions between fracture and matrix flows, Cassidy et al. (lx2M) have developed the ability to examine scaling laws near a percolation threshold (with fractal fracture population and matrix permeability) and scaling of the velocity flow field in comparison with scaling of the material geometry. Harris et al. (Ix2M) have modelled the effect of complex fault structure on fluid flow, to date for the case where faults have lower permeabilities than the host rock. Their methodology can cope with conductive faults but such have not been studied within the Ix2M project. The work has assumed configurations of fault damage zones based on a large background of observational data. A hierarchical clustering model has been developed to give the most realistic realizations smaller faults cluster around larger ones, which cluster around even larger etc. The project has used finite difference, constant volume finite element, and Green element modelling with a variety of sample configurations of faults. The group has also developed a new methodology which both derives the minimum value of the fault rock thickness along flow paths traversing the fault zone, and predicts areas of reduced fault zone connectivity for matrix host rock (Km) and fault rock (Kf) of varying permeabilities. In this method, path tortuosity is controlled by a trade-off between pathway length and net fault-rock thickness crossed. Although it is strictly only applicable to a binary permeability distribution between fault rock and host rock, the method is very quick to apply to very complex geometrical situations. Preliminary results indicate that the geometrical method gives path lengths very similar to those determined by the discrete fracture flow modelling technique of Odling & Webman (1991). A critical threshold value of the ratio in permeabilities is observed to exist at which the flow characteristics transfer from long, tortuous pathways (high Km/Kf) to shorter, direct pathways (low Km/Kf) which encounter an increased thickness of fault rock. An interesting question is whether the permeability distributions of such realizations are consistent with the observations of 1/k spectral densities observed in well logs. One practical outcome for stochastic fault modelling that has been suggested by the findings (Harris et al. 2003) is that clustering tends to degrade the theoretical relationships between exponents for fault-length frequency distributions (1D sample exponent = 2D sample exponent - 1 = 3D sample exponent - 2). Odling et aL (2004) have taken several sets of 2D areal samples from regularly spaced intervals
throughout a large, stochastically modelled hierarchical fault damage zone. For an individual set the size of the samples was uniform, but the size changes between sets from 5 m to 50 m. The effective permeability of each of these samples has been calculated using the 2D, finite difference, discrete fracture flow model. Amongst other findings, the one-point frequency distributions of effective permeability are interesting. The distributions are closer to log-normal than
2.0
frequency distribution ............... frequency curve slope , ~ 9 best-fit log-normal
1.5 ,~i ~'~~''~(~ 0 3 2.0
-2
1.5
~
-I
A
0.5
0-3 2'0i
-~ o,5i o_"3
-2
-t
/
0
0
Increasing size of sample
:: -2
-I
2.0
0 10
5
~
l,O"
00~
~
0.51
"-5
~
-2
_ -t
-10 0
tog k
Fig. 4. Frequency distributions of the effective permeabilities of samples of various sizes from a simulated fault zone calculated by Odling et al. (2004). Each double logarithmic plot shows the frequency distribution (bold line), its local slope (thin line) and a fitted log-normal distribution (triangles). Size of sample increases down through figures. Only at the small sample size (5 m) is the distribution possibly power law; larger samples give distributions which ale closer to lognormal. Reprinted from Journal of Structural Geology, copyright (2004), with permission from Elsevier.
Downloaded from http://sp.lyellcollection.org/ by guest on May 1, 2017
MICRO TO MACRO PROGRAMME: IMPLICATIONS to power law, except possibly at the lower sample size of 5 m. The frequency distributions are shown in Figure 4 and can be contrasted with those produced by coupled modelling at the critical point (see section entitled 'criticality and coupled modelling'). The origin of the power law in the work of Odling et al. (2004) must be a consequence of the statistics of the geometrical variables input to the 'static' fault damage model. However, in the case of coupled modelling, the power-law distribution of permeabilities can arise spontaneously from the interactions of the different processes at the critical point; given that the spatial distribution of permeabilities in this latter case is multifractal, it is unlikely that the univariate distributions are only power-law at certain scales of permeability measurement. There is ample scope for further study of such statistics from both modelling and field data, with the key objective of understanding whether well-test permeabilities measured in the field are dynamic (arising from coupled processes at a critical point) or static (arising from geological heterogeneities unresponsive to production). Criticality in f r a c t u r e p e r m e a b i l i t y
Rather than modelling fractured rock with discrete fractures, a more convenient way is with a continuum model in which effective properties take into account the presence of fractures. Spatial variations in fracture densities, apertures and orientations can be incorporated through
strain modelling in the continuum. One of the most important relationships for such an approach is that between the effective bulk permeability and strain. Various theoretical and laboratory investigations of this relationship have been made and the most common form has been a power law, but with a large range of exponents depending mainly upon the assumed configuration of the fractures (Walsh & Brace 1984; Yale 1984; Charlaix et al. 1987; Bernab6 1988, 1995). Charlaix et al. (1987) indicated that the exponent, s, is larger if the aperture distribution of individual elements which are needed to establish the percolation path at threshold extends continuously to zero with a finite density. One of the difficulties in calibrating these theoretical relationships with laboratory experiments has been in obtaining rock samples that are essentially undamaged prior to testing, and introducing in a controlled manner a characterized fracture set. Meredith et aI. (ix2M) have been able to do this through thermal cracking of a microgranite (the Ailsa Craig microgranite actually used in the tests is commonly used for making curling stones because of its essentially unflawed nature). Both permeability and porosity were measured despite difficulties caused by the extremely low connected fracture density and the essentially zero matrix permeability. Figure 5 shows the crossplot of measurements from one set of tests on the same sample, heated to increasing temperatures (cooled before flow measurements made), and corresponding increasing
Results from Bernabe (1995) incorporating those from Yale (1984) ..... b m e a s u r e m e n ~ ........... m
Bernabe (1995) 2d network model: cracks only] . . . . . J
15
~9
abe (1988) & Walsh & Brace (1984)] easurement crystalline rocks
~
9
2d network modelling
,~Nmnl 9
combined
Log. (lab measurements sst) . . . . . . . Log, (2d network modelling', - -
lo
- -
Log. (combined} 9 "''.. 9
9
9 "'""
f 5 10 2d 3d percolation theory I
,t
15
13
20
value of exponent,
25
30
s
Fig. 5. Values of the exponent, s, in the percolation equation for permeability k = a(p - po)S, p > Pc. The range of values of s measured by Meredith et al. (Ix2M) is compared with the values, or frequencies of values, measured or calculated by Bernab6 (1988, 1995), Walsh & Brace (1984) and Yale (1984).
Downloaded from http://sp.lyellcollection.org/ by guest on May 1, 2017
14
K.J. HEFFER
densities of fractures. Fitting to the data the percolation equation: k = a ( p - pc) s, p > Pc
-- 0, p < pc
(2)
where p is the porosity, Pc is the porosity at the percolation threshold, k is the permeability, and a, s are constants, with increasing assumed values of the percolation threshold, ostensibly yields a 'best fit' (highest value of correlation coefficient) when Pc is 0.0075 and s = 4.92. It is interesting that this (very preliminary) interpretation of threshold porosity is just below the actual natural porosity of the starting material (mostly due to isolated altered phenocrysts) of 1% or so (I.G. Main, pers. comm.). The value of the exponent is well in excess of the theoretical conductivity scaling implied by percolation theory (1.3 for 2D; 2.0 for 3D) and lies in the middle of the large range for mixed cracks and pores analysed by Bernab6 (1995) (Fig. 5). It is possible that the large value of the exponent, s, is attributable to heterogeneity in the apertures of the thermally-induced cracks. Whatever the final analysis of these data yields, the data
themselves provide a valuable benchmark against which to compare other values derived from theory or from laboratory measurements made under different conditions. The work has also been another illustration of the extreme sensitivity of permeability to fracture density - a highly non-linear relationship that can act as a threshold in critical behaviour and play a large role in coupled systems of fluid flow and geomechanics. Criticality and coupled modelling
Sanderson et al. (p~2M) (see also Zhang & Sanderson 2002; X. Zhang et al. 2002) looked at the critical point associated with the connectivity of fractures with a 2D distinct element model (UDEC), which couples deformation and fluid flow. The changes in deformability and permeability in the model with increasing input densities of fractures have been calculated (note that, in contrast with later studies described below, the fracture patterns were input into the model rather than induced by failure during deformation). The fracture connectivity is posed as a power-law function of fracture density above a threshold value, as with permeability vs.
Fig. 6. Critical point in coupled mechanics and fluid flow. (a) Fluid flow velocities modelled in loaded domain with three pre-existing fractures: (i) below; (ii) just below; and (iii) at the critical point when new percolating pathways subparallel to Shmaxare created. Reprinted from Zhang & Sanderson, copyright (2002), with permission from Elsevier. (b) Field data confirm that directionalities of flooding axe sub-parallel to the local orientation of Shmax,rotated to align with the modelling of X. Zhang et aL (2002) (adapted from Heifer & Lean 1993).
Downloaded from http://sp.lyellcollection.org/ by guest on May 1, 2017
MICRO TO MACRO PROGRAMME: IMPLICATIONS
porosity described above. Sharp increases in both deformability and permeability are observed at the critical (threshold) fracture density. Four groups of simulated fracture patterns and 15 natural fracture patterns were studied. Exponents of permeability increase above the threshold were found in the range 1.05 to 1.37, in line with 2D percolation theory (exponent of 1.3). When the models were loaded, the stress-strain curves showed softening above the critical fracture density, but then an even greater deformability was observed above a second threshold of fragmentation. Exponents of the relationship between deformability and fracture density above this higher threshold were found to be 0.64 for a zero confining stress and 0.91 for an applied confining stress of 0.3 MPa: it would be a useful exercise to rationalize these values with experimental observations (Chakrabati & Benguigui, 1997, Section 3.4) of the scaling of modulus in a bond percolation model in which increasing densities of bonds incrementally stiffen the model (exponent close to 4 in 2D). The modelling of Sanderson et al. (/x2M) has also provided guidelines for estimating the effective failure variables (friction coefficient and cohesion) for a fractured rock mass. Based on these models they have defined an indicator for criticality in stress state, termed the 'driving
(a)
15
stress ratio' and given by: R=
(fluid pressure - mean stress)
(3)
(~ • differential stress) Instability occurs when the R-ratio exceeds some critical value Rc in the range - 1 to - 2 . These limits respectively represent failure by hydraulic fracturing and by shear failure in a cohesionless material with friction angle of 30 ~. Criticality can occur with shear failure with the fluid pressure still below the minimum principal stress. Sanderson et al. (o.2M) studied the statistics of fracture apertures arising from their modelling in relation to progress of the model to and through a state of criticality (see Fig. 6a). Apertures were actually examined in terms of the fluid flow 'vertically through' the 2D areal model, using essentially a cube law between flow rate and aperture. One-point cumulative frequency distributions of flow rate showed a dependency on degree of criticality: below criticality, the distribution is approximately log-normal; however, at and above the point of criticality, the distribution is better described as a power law. At the critical point the exponent of the power law is 1.1 (Fig. 7a). This modelled distribution can be
(b) 1000
|
',, '1 ,,
SIope~l.1
slope-~1 , t ~
,
.o m 100 "6 r E Z
, vvvv
9~
256
IOOC
ivv
10
N
1 0.001
0.01
0.1
1
10
Vertical flow-rates (x 10 -6 m s -1)
100
1.E-07 1.E-06 1.E-05 1.E-04 1.E-03 1.E-02 1.E-01 I.E+00
Well rate, PI, cum prod, or permeability relative to maximum Im'='Giant field ~
Composite of several smaller fields I
Fig. 7. Frequency distribution of flow rates is power law at and near the critical point. (a) Results of modelling coupled mechanics and fluid flow; reprinted from Zhang & Sanderson, copyright (2002), with permission from Elsevier. Cumulative frequency distribution of flow rates (A) below, (B) and (C) just below the critical point. (b) Field data: cumulative frequency distributions of well rates, cumulative well production or permeability (each divided by the maximum for the field). Data are from one giant field, and also aggregated from a number of smaller naturally fractured fields.
Downloaded from http://sp.lyellcollection.org/ by guest on May 1, 2017
16
K.J. HEFFER
compared with that from field data on the flow productivities from individual wells. Figure 7b shows that power-law distributions also apply to two examples of the latter: one from a giant field; the other as a composite from several fields. The exponent of the fitted power law common to both sets of data is also 1.1. The existence of the power law in the field data combined with the implication from modelling that powerlaw behaviour is expected only at or above the critical point is consistent with the concept of criticality in field behaviour. The equality of the exponent of the power law may not be so significant and further study would be necessary to demonstrate that it is not coincidental. Since, in the modelling of Sanderson et al. (lz2M), flow rate is calculated as the cube of the fracture aperture, the cumulative frequency distribution of fracture aperture is also a power law, with exponent - 3 . 3 . There are few direct datasets on fracture apertures from the field with which to validate these one-point statistics; fracture apertures in recovered core are under relaxed stress conditions. One exception is the large dataset measured downhole with a borehole televiewer log in the Cajon Pass well; from this, Barton & Zoback (1990) calculated a powerlaw frequency density distribution of fracture apertures, with an exponent of - 3 . 0 (equivalent to an exponent of - 2 . 0 for the cumulative frequency distribution). Converting that 1D sample basis to 2D would alter the cumulative distribution to ~ a -3, in good agreement with the distribution of flow rates calculated by Sanderson et al. (tx2M). Sanderson et al. (p~2M) have also investigated multifractal statistics in the distribution of apertures/vertical flow rates arising from their coupled geomechanics-flow modelling. They have found that below the critical point, the spectrum of generalized fractal dimensions Dq(q) varies only weakly with the order q of the moment, indicating an approximate monofractal. The common dimension is equal to 2.0, the space-filling dimension of the underlying input fracture set. However, when the critical point is reached, the multifractal spectrum shows a strong variation, with a sharp decline from negative to positive values of q. No known studies have been made of whether flow rates in a densely drilled field follow a multifractal distribution: such study might lead to further support for criticality in field behaviour. Another example of modelling which produced similar forms of multifractal spectra was the investigation by Cowie et al. (1995) of development of fault patterns by antiplane shear deformation of a 2D plate (in which the displacements
are out of the plane of the plate). No fluid flow was involved in that modelling. Distributions of displacements on the faults were found to evolve with model time from monofractal and space-filling to multifractal. One must be careful not to make too strong a deduction from these model studies: power-law distributions can occur in many ways (Sornette 2000, Chapter 14). Also, interpretation of a power law can be made falsely if the range of data is inadequate, for example extending over only one order of magnitude. However, there are strong indications that geomechanical-flow criticality is a sufficient, if not necessary, condition for power-law and multifractal distributions of flow properties. ls there more direct evidence to support the concept of criticality in oil field developments? Good demonstrations of its applicability are to be found in the North Sea chalk fields, Ekofisk and Valhall. These fields have received intense geomechanical study, mainly because of their strong compaction and its associated, very noticeable, effects of subsidence and casing failures, but it is unlikely that the fields are a special case. Zoback & Zinke (2002) have shown that the stress states in the crests of both fields were consistent with incipient normal faulting at the onset of oil production, and that the subsequent pressure reductions during primary production caused those critically stressed areas to spread downdip to the flanks of the structures (see also Chan et al. 2002). The effective stress states tracked down the Coulomb failure line (with a friction coefficient ~0.6) on a Molar diagram. Passive seismic monitoring in both Ekofisk (Maxwell et al. 1998) and Valhall (Zoback & Zinke 2002) has detected microseismic events, mainly in lower porosity reservoir layers or in the overburden. In Valhall, microseismic events have focal mechanism solutions, also indicating normal faulting. Furthermore, the anisotropy of the detected shear waves has shown evidence of temporal changes. Coleman (p,2M) sought change in fracture characteristics in the Valhall Field, which could be a further indication of criticality. That project has developed a possible diagnostic of fracture activation during reservoir development. In laboratory tests of fluid flow through chalk under stress, it was found that the concentration of the isotope 637C1of the collected fluid was correlated positively with the flux of the fluid through the chalk, this flux being controlled by the fracturing of the rock. Coleman (p~2M) sampled trace waters found in produced oil from several wells in the Valhall Field. No change over time has been observed to date in
Downloaded from http://sp.lyellcollection.org/ by guest on May 1, 2017
MICRO TO MACRO PROGRAMME: IMPLICATIONS the geochemistry of these samples, but the average 637C1 compositions of trace waters varied significantly between wells, always different from that of sea water. It is very interesting that the 837C1compositions indicated more fracture permeability from the crest of the structure than from the flanks (M. Coleman pers. comm. 2002) consistent with the other observations of fracture activity progression. Further modelling by Sanderson et al. (ix2M) also suggests the basis for a reconciliation of the current disagreements in the industry of the importance of critical stressing as a criterion for conductivity of individual fractures. Recent work has shown the strong influence of modern-day stress state on fracture conductivity: fractures which are in a state of incipient shear failure in the modern-day stress field, termed 'critically stressed', will generally be conductive; whilst those fractures stable in the modern-day stress state will generally be nonconductive (Barton et al. 1998; Barton 2000; Chan et al. 2002). An exception to this might be a fracture set that was formed under a palaeo-stress state shortly before, or contemporaneously with, hydrocarbon fill, which inhibited fracture healing when the stress state altered to its modern-day configuration (e.g. Stowell et al. 2001; Gauthier et al. 2002). This scenario is more likely if the original deformation was associated with diagenetic alteration, either dissolution, or partial cementation, such that, when the stress state was altered, bridges between vugs along the fracture path helped to prop open a conductive path. The model of Sanderson et al. (pu2M) of the fluid flow in a granular medium also contained some macro-fractures, with the maximum principal horizontal stress (Shmax) at a large angle (c.60 ~ to the fracture strike (see Fig. 6a). At, or just below, the critical point, smaller-scale fractures formed that were sub-parallel to Shmax, at the same time as the macro-fractures are open. Under conditions of low mean effective stress (as would pertain in waterflooding recovery schemes), the secondary fractures are conductive and form a percolating path for flow. To transpose this to field experience, observations might be made early in the life of a field development of conductive fractures which were formed under some palaeo-stress; whilst, if a secondary recovery scheme is implemented which reduces effective stresses close to a critical point, then coherent fracture trends striking close to the azimuth of Shmax might be equally or even more, influential in governing the directionality of the flooding. This is consistent with the statistics of directionality
17
observed in oil field operations (Heifer & Lean 1993) and in geothermal projects (e.g. WillisRichards et al. 1996). With regard to indicating stress-induced directionality, the modelling complements that of Heifer & Koutsabeloulis (1995) (see Fig. 6b). The semi-quantitative scale invariance of some deforrnational geometries is demonstrated by comparing the results of Sanderson et al. (ix2M), whose model contains overlapping macrofractures at the grain scale, with those of much largerscale modelling of the geomechanical and flow characteristics of a fault relay zone conducted by Y. Zhang et al. (2003), linked to the ix2M project of Yardley et al. (ix2M). In addition to coupled modelling of geomechanics and fluid flow using the explicit finite difference code FLAC in 2D, the modeUing is also explicitly coupled to the finite element code FIDAP, which models chemical reactions. The model has been used to track the mixing of reduced and oxidized fluids, both gold saturated, in the dilatant zones resulting from the geomechanical model. The patterns of fluid mixing are seen to be very similar to the aperture distributions produced by the Sanderson et aL (po2M) model (see Fig. 8). Yardley et al. (Ix2M) are utilizing geochemical methods to investigate palaeo-fluid flow in and around the Navan mine in Eire. A strong control on the flow has been shown to be the density contrast between cooler waters of evaporitic origin overlying hotter hydrothermal waters from the Lower Paleozoic basement. The concentration of lead sulphide mineralization is focused in a ramp zone between two NNE-SSW-trending Caledonian faults, which were activated under a more E-W-directed stress field during Carboniferous-Permian times. The dilatation of this extensional step gave rise to vertical flow to concentrate mixing of the two waters and deposition of lead sulphide. More extensive E - W lineations also hinged upon this focus.
D y n a m i c t r a n s p o r t e q u a t i o n s on fractal structures
If heterogeneous porous media can be described with fractal functions (even if they are uncoupled from geomechanical or chemical changes), is there an effective differential equation which can be applied to describe transport through them? Such an application would have potential for more efficient flow simulations. However, although there have been a wide variety of equations devised in the past to describe flow and transport on a fractal structure, Sellers &
Downloaded from http://sp.lyellcollection.org/ by guest on May 1, 2017
18
K.J. HEFFER
Fig. 8. Similarity across scales of coupled modelling of relay zones loaded under anisotropic stresses. (a) Coupled modelling of mechanics and fluid flow at the grain scale reprinted from Zhang & Sanderson, copyright (2002), with permission from Elsevier. The dark lines indicate the largest induced crack apertures. (b) Coupled modelling of mechanics, fluid flow and chemistry at the scale of a mine by CSIRO linked to the project of Yardley et al. (Ix2M); reprinted from Y. Zhang et al. (2003) with permission from Elsevier. Dark regions indicate high flow velocities where mixing of two fluids occurs in dilated zones.
Barker (~2M) showed that there is a lack of justification for those equations. Their project has supplemented previous study of the so-called anomalous diffusion equations which found that none of those yet devised could successfully match the results of random walks on a standard Sierpinski gasket over the full range of times/ distances (Schulzky e t al. 2000). Sierpinski gaskets and carpets are triangle- and squarebased fractal 2D objects; see, for example, http://astronomy.swin.edu.au/~pbourke/fracta Is/gasket/. Sellers & Barker (lx2M), with careful simulations of random walks on Sierpinski ca rpets, also found the following: 9
9
9
boundary effects can be extremely significant and lead to wrong estimates for the dimensions when an insufficient number of time steps is used; log-periodic oscillations can appear superposed onto the asymptotic response, arising from internal boundaries due to a hierarchy of length scales in the fractal; flow dimension is a local quantity that can vary with origin and direction, and is not a global property of the fractal.
Sellers & Barker (ix2M) conclude that the effective differential equation approach can, in some specific cases, provide reasonable solutions, but it is not clear a priori which equations are appropriate to a given fractal. The authors demonstrate the need for better models of transport on fractals. These findings throw further doubt on whether the fractal geometry of fractures can be interpreted
from well tests. Previous work (e.g. Barker 1988) has identified fractional dimensional behaviour during hydraulic tests (Barker's Generalized Radial Flow, GRF, model). By the analysis of synthetic fracture networks with well-known geometric properties, Jourde e t al. (2002) showed that a fractal-like pressure transient response is not necessarily tied to a fractal geometric arrangement of flow paths (fractures or channels). This result agrees with the analytical study by Doe (1991) who stated that a fractional dimension in a well test only requires the change in conduit area with distance from the source point to scale, and does not require the reservoir to have other fractal properties. Consequently the interpretation of a non-integral flow dimension from well tests is, at the present time, questionable, though it may provide qualitative information on the fracture connectivity. Only if the fractal structure is radially symmetric from the source point will the fractional flow dimension be related to the fractal dimension; this is not a very likely natural situation, given the anisotropic character of sedimentary layers, fracture sets and stress fields, etc. Nevertheless, by simulating diffusion on a set of given fractal structures with random walk simulations, an idea of possible types of fracture patterns investigated by a test might be gleaned. Once the assumption (often of convenience) that geomechanical coupling can be ignored is removed, then the practical problem for well tests in fractured rock arises that the fracture storage can be much larger than usual wellbore storage values and, through the
Downloaded from http://sp.lyellcollection.org/ by guest on May 1, 2017
MICRO TO MACRO PROGRAMME: IMPLICATIONS feedback of port-elastic stresses, can also be changing throughout most of the duration of a well test. The practical implication for fluid flow engineering at this stage, therefore, seems to be that there is no 'shortcut' to simulating conditioned reservoir heterogeneities and performing 'conventional' flow simulations on them, preferably in most circumstances with coupling to getmechanical changes.
Reservoir surveillance to monitor changes in properties Seismic m o n i t o r i n g
One of the most attractive consequences of criticality is the association with pervasive, stress-aligned (micro-) fractures and low aspect-ratio pores throughout the crust that are close to failure at the percolation threshold (Crampin 1994, 1999, 2000). Azimuthally aligned shear-wave splitting with very similar characteristics is observed in almost all igneous, metamorphic and sedimentary rocks of all porosities and permeabilities. The anisotropic poro-elasticity (APE) model of Zatsepin & Crampin (1997), in which the mechanism for deformation is fluid movement by flow or dispersion along pressure gradients between neighbouring cracks at different orientations to the stress field, has been very successful in matching a large range of observations of shear-wave splitting, associated with earthquakes, eruptions and other phenomena. These properties imply a basis for various methods of seismic monitoring of reservoir developments. There are various degrees of coupling between stress, pressure and permeability. At the critical point, where the permeability is a strong function of effective stress, all three variables are interdependent. However, in the case of seismic waves passing through rock, the dependence of permeability on small changes in effective stress during the passage of the wave (apart from an average permeability determined by an average effective stress for the process) might be ignored. The reverse coupling, the influence of permeability on the properties of the seismic waves, is still, however, important in the presence of fractures. The coupling arises because of the phenomenon of 'squirt-flow', due to the seismic wave inducing, in cracks at different orientations, or between cracks and spherical pores, pressure gradients that are not parallel to the propagation direction. Squirt-flow and, therefore, its influence on seismic properties,
19
is frequency dependent; the characteristic frequency depends upon factors including the size of the fractures. Various studies have been made of this influence, assuming various geometries of the pore space. Chapman et al. (2002) have developed an approach that allows the introduction of greater generality in geometries (see also Chapman 2003; Chapman et al. 2003; Maultzsch et al. 2003). Using a network model that comprises spherical pores, randomly orientated microcracks and aligned larger fractures, they have determined a strong dependence of seismic properties (velocities, attenuation, dispersion and anisotropy of P- and S-waves) on frequency, pressure (effective stress), viscosity, permeability and fluid characteristics. Their modelling is consistent with the conventional Gassmann model at low frequencies; the existence of the Biot slow P-wave; the dispersion characteristics predicted by previous modelling for mixtures of cracks and pores. With such a mixture, dispersion of S-waves increases linearly with crack density; whilst dispersion of P-waves is zero for the cases of no cracks and all pore space comprising cracks, and reaches a maximum at some intermediate crack density mixed with spherical pores. Although the model is not fully coupled with stress, pressure dependence can be introduced with an externally derived relationship between crack density and effective stress. This correspondence implies strong dependencies of the velocity dispersion and the attenuation on the effective stress. Parameters of the model can be expressed in terms of macroscale, measurable quantities. An exception is the crucial parameter of the relaxation time of fluid ftow (r, typically in the range 10 - 7 to 10 - 4 s), which although linked to permeability, viscosity etc. would generally have to be considered as an unknown parameter to be used for calibration of the model to field data in applications. Calibration has already been performed for laboratory data (for which r values which best fit velocity and attenuation data are reasonably consistent); and also for field data from a gas reservoir where permeability is controlled by pre-existing fractures. Figure 9 shows the calibration of the model against the observed frequency dependence of S-wave anisotropy. An outstanding item of 'ground-truthing' at the moment is being able to associate the radius of macrofracture that is also derived from this calibration with an independent observation of fractures in the reservoir. Further reassurance will be given by a test that matches a larger range of seismic frequencies as well as the relatively limited bandwidth over which anisotropy is predicted to decline. Future
Downloaded from http://sp.lyellcollection.org/ by guest on May 1, 2017
20
K.J. HEFFER 3.6
I
I
I
I
I
I
I
_
9
3.4
I
Data
> , 3.2 c~ 0 3.0 0 .~_ c-- 2.8 ' ~ 2.6 ca) 2.4 9 O.
2.2 2.0 i
I
10
~
I
12
i
I
f,
14
I
i
16
,~
18
i
,I
20
~,,
I
~
22
I
24
i
,
26
Frequency Fig. 9. Comparison of the frequency dependence of shear-wave anisotropy predicted by the effective medium model of aligned macrofractures, cracks and spherical pores (Maultzsch et al. 2003) with observations from a near-offset multicomponent vertical seismic profile. Reprinted from Geophysical Prospecting, copyright (2003), with permission from Blackwell Publishing. work will include the incorporation of distributions of macrofracture sizes. Work has also progressed under the l-t2M Programme on an alternative model of fluid flow influence on seismic properties by Liu et al. (o~2M) (also Tod 2001). The model incorporates just one set of spheroidally shaped pores of arbitrary aspect ratios. The study has looked at the effects of changing crack shape on wave speeds. A particular application is interpreting seismic data in the case of fractures which are limited in height to bed thickness, whilst varying in lateral length, as commonly occurs with mechanical stratigraphy. Again, strong dependence of the seismic velocities on the seismic frequency has been found, as well as the expected dependence of velocities on the aspect ratios of the cracks. Finite difference modelling has also been conducted by Liu et al. (I~2M) (also Vlastos et al. 2002) to study the effects of fracture spatial distribution and size on the wavefields (not incorporating the influence of squirt-flow). This has shown that when the fractures are smaller than the wavelength, each fracture is a single scatterer resulting in a secondary wavefield independently of the distribution. When the fracture size is larger than the wavelength, the features depend on the distributions. With an almost regular distribution such that the fractures are very close to each other they form clusters which act as
large interfaces; whereas with a completely random distribution the clustering is insignificant and the fractures again act as individual scatterers. It will be interesting to extend this modelling to continuous distributions of fracture size (e.g. power law). The strong dependencies of seismic properties on fracture characteristics, such as size, aspect ratio, orientation and clustering, together with the ambient effective stress, give rise to a range of potential applications in areas such as the interpretation of time-lapse multi-component seismic surveys, pore pressure prediction and the frequency scaling of laboratory measurements.
Temporal and spatial correlations in well-rate fluctuations
Other data that have provided support for the concept of near-criticality in field operations have been derived from fluctuations in production and injection rates at wells over the life of field developments (Heifer et al. 1997). Correlation coefficients have been calculated for temporal series of rate fluctuations at pairs of wells, using the standard Spearman rank correlation (non-parametric) technique. The aggregated results from applications to several fields indicated that rate correlations have the following general properties:
Downloaded from http://sp.lyellcollection.org/ by guest on May 1, 2017
MICRO TO MACRO PROGRAMME: IMPLICATIONS (a)
(b)
(c) (d)
highest positive correlations for well pairs aligned along a direction close to the local orientation of maximum horizontal principal stress; lowest, and on average negative, correlations for well pairs aligned sub-parallel to the local orientation of minimum horizontal principal stress; many of the high correlations are at long range; trends of similar orientation to faulting trends appear in the correlations.
These properties are best explained by the interpretation that the rate fluctuations in a field are (at least partially) due to geomechanical changes in the reservoir causing strain and, therefore, permeability changes. The appearance of long range in the correlations is another indication that the system is close to a critical point. Figure 10 shows the interpolated map of maximum horizontal principal strain corresponding to the principal component with the highest eigenvalue of the matrix of rate correlations between well pairs in one field application. It 'explains' nearly 20% of the variance in the rate fluctuations for this field. The interpolation has been made on the basis that the principal component value corresponds with the local volumetric strain. The lineations that appear in high values of the principal component are even
more plausible when compared with the fault map for the reservoir that is overlaid: there is a good correlation between the trends and locations of faults and zones of high fluctuation. A question that arises is whether the lineations in correlated rate are due to conductive fracture/ fault zones (as, for example, described in Sibson 1996) or to the focusing of fluid flow along sealing faults. It should be borne in mind that the correlations of rate fluctuations imply timevarying properties. Whilst permeability of a set of fractures close to a critical point can be readily time-varying and correlated over long range, it is less easy to imagine the sealing properties of several, spatially separate faults varying in unison. A more sophisticated potential mechanism is that of fluid flow in stress-sensitive flow properties propagating along faults as solitary waves (e.g. Rice 1992; Revil & Cathles 2002).
Conclusions The Ix2M Programme has helped to underpin the concepts of criticality and scaling in reservoir behaviour, with modelling results broadly consistent with observations in the field. There are a number of implications that the lx2M Programme carries for reservoir characterization exercises. 9
9
9
Fig. 10. Map of fault traces on top surface of a reservoir superimposed upon the map of maximum horizontal principal strain as interpreted from the first principal component of the well rate correlation matrix and interpolated using a long-range correlation function appropriate for strain (hotter colours are higher magnitudes of strain). There is a strong association of the trends in high strain with the faulting trends.
21
9
It gives further impetus to deploy long-range spatial correlations in stochastic modelling exercises. The 1/k spectral densities are associated with ~log (lag distance) correlations in real space. It has provided support for the general applicability of reservoir criticality and stress-related anisotropy. Field-specific demonstration and greater understanding of these will require measurement of in situ stress states, magnitudes and orientations, as a matter of course in data acquisition programmes. Associated with criticality is the recognition that flow properties are likely to change during the life of commercial developments. Therefore, for example, in interpreting repeat flow-tests on the same well, changes to absolute permeability should be sought, rather than being considered as aberrational, or force-fit into uniformity, as is the current tendency. Any such changes should be analysed for spatial and temporal patterns, particularly with respect to the local structural and geomechanical characteristics. In order to understand changes in flow properties and provide better predictions for reservoir planning and management, coupled modelling, particularly of geomechanics and fluid flow, is desirable. Although such
Downloaded from http://sp.lyellcollection.org/ by guest on May 1, 2017
22
K.J. HEFFER coupled modelling adds an overhead in computer time and resources to conventional flow modelling, the potential benefits are very large in terms of providing a more representative model of the overall physics of the system. For example, the large operational and commercial influence of horizontal anisotropy in permeabilities on recovery from flooding schemes has been well known in oil reservoir engineering for many decades; additional benefits will surely accrue from modelling the time dependency of such anisotropy and its detailed relationship to local structure and geomechanics. Knowing that local faults and fractures play a strong role in fluid flow mechanisms in a potentially time-varying, rather than just a static, fashion, gives even more motivation for acquiring detailed information on microand macro-structure over a range of scales, from core-logging, borehole image logs, vertical seismic profile and surface seismic surveys. The strong seismic responses that are predicted - especially of anisotropy imply the applicability of a range of seismic techniques such as the interpretation of time-lapse multi-component surveys, particularly of shear-wave signals. The more general association of shearing on pre-existing discontinuities with the progression of fluid flow gives added impetus to deploy passive seismic monitoring of these events. The successes of previous applications can be built upon by validating or calibrating such surveys with coupled geomechanical-flow modelling.
9 9 9 9 9
There are 'new' technologies in which these concepts will be even more pertinent. 9
9
Future developments Whilst the ~2M Programme has helped to underpin new concepts of scaling, criticality, susceptibility to perturbation, long-range correlation etc., there are still many issues outstanding. Many have been outlined above or are mentioned in reports or papers from individual projects. The following are significant examples: 9 9 9 9
Is the applicability of these concepts field specific or ubiquitous? How 'near' is 'near-criticality' in general commercial cases? How best to incorporate power-law spatial correlations and structure-related anisotropy into stochastic modelling? Further searches for multifractal scaling in field data, and development of means of incorporating in modelling.
More detailed understanding of the involvement of sedimentary and diagenetic influences in observed scaling in heterogeneities. Further understanding of the viscous coupling between fracture and matrix flow. Development of faster, more flexible, coupled geomechanical-flow models that can cope with uncertainties in input parameters. Development of acquisition, processing and interpretation techniques for time-lapse shear-wave splitting surveys. Development of equipment for more permanent monitoring of passive seismic events and methodology for incorporating into predictive models of fluid flow and deformation.
9
9
9
CO2 sequestration schemes. One of the key unknowns for projects which seek to 'lockup' CO2 emissions in the subsurface is whether the traps will leak. That places more emphasis upon knowledge of whether potential leakage pathways via faults or fractures are conductive under either original or perturbed conditions. In addition, a sequestration project in an oil reservoir can often only be commercially viable if it assists in enhancing oil recovery: the resolution of issues of heterogeneity patterns, anisotropy and time-variability therefore become even more important for such projects. Geothermal schemes. Much of the awareness of geomechanical influence, including passive seismic monitoring, was pioneered in geothermal projects. However, there is plenty of scope for application of recent technologies and development along the lines listed above. Radioactive waste disposal schemes. The considerations of time variability and longrange correlation become even more acute when applied to schemes that require extreme reliability of prediction for thousands of years. Groundwater. The improved understanding gained by the lx2M Programme, particularly with respect to fractured rocks, will be invaluable in the efficient exploitation of groundwater and in the remediation of contaminated aquifers. Mining industry. Many mineral deposits are closely related to fault/fracture networks and the flow of mineralizing fluids through them. The advances made on modelling fluid flow through fracture networks, at several scales, could be developed
Downloaded from http://sp.lyellcollection.org/ by guest on May 1, 2017
MICRO TO MACRO PROGRAMME: IMPLICATIONS and used, in conjunction with information on such aspects as host-rock type, fluid geochemistry, temperature, stress fields, etc., to help predict favourable sites for mineralization and exploration strategies.
The author thanks Dr Robert Cuss, Professor Rob Knipe, Dr Richard Shaw and Dr Sue Raikes for providing improvements to this paper. Much benefit was also derived from correspondence with Dr Peter Leary and Professor Stuart Crampin whilst writing the paper, without implying that either necessarily agrees with the interpretations given here. Finally, acknowledgement is due to the Natural Environment Research Council for a small grant towards the task of integrating results from the ~2M Programme.
Appendix A: Various uses of the term 'critical' There are several contexts for the term 'critical' in this paper, following common useage in recent literature. Although related in the mechanisms involved, the meanings in the different contexts vary; those meanings are given very brief outlines below.
Rupture as a critical phenomenon The process of faulting or fracturing of rock has been described as a critical phenomenon analogous to those of continuous phase transitions in equilibrium thermodynamics (e.g. in liquid-gas mixtures, metallurgy, magnetism, (super) conductors etc.). As the system stress state approaches the critical point, failures occur, initially at the small scale, and then coalescing to larger scales; the spatial correlation of stresses, strains and earthquakes increases correspondingly. The fact that at the critical point there are no characteristic scales gives rise to power laws in frequency distributions of variables, and relationships between them. The critical point marks the transition from 'intact' to 'fractured' phases of the rock. Fracture criticality is a corresponding term introduced by Crampin (1994), focused towards the implication from widespread observations of shear-wave splitting that there is a very narrow range (a factor of only ~1.5) in average fracture densities between the smallest observed and the threshold for percolation: only a small change in stress state is, therefore, generally required to bring the average fracture density up to the point which will give throughgoing failure.
23
Self-organized criticality (SOC) Critical phenomena are observed in equilibrium thermodynamics only when the system is tuned to the critical point (e.g. by varying temperature). The concept of 'self-organized criticality' was introduced (e.g. Bak 1997) as an explanation of how a system which is far from equilibrium can reach a critical point by self-organization without external tuning, and particularly as an explanation of the origin of 1If noise which is observed in many natural systems. SOC behaviour is found in systems dominated by interactions between many degrees of freedom (rather than the intrinsic dynamics of the individual degrees of freedom) and with thresholds (e.g. for failure) that allow a large number of static metastable configurations (Jensen 1998). It is also required that the system be slowly driven in relation to the time characteristic of the process whereby the threshold in dynamics is crossed (e.g. the build-up of stress on a fault is over much longer time periods than the earthquake that eventually occurs on it). A SOC process is characterized by avalanches of threshold-crossing interactions (e.g. earthquakes) that occur at all sizes, maintaining a significant proportion of the domain in a state close to the threshold (e.g. fractures which are on the verge of further failure, especially in shear, to which the term 'critically stressed' has been applied see below). Several indicators suggest that SOC is a valid model for deformation in the lithosphere (Bak 1997; Sornette 2000), but there is not universal acceptance of this concept (Jensen 1998; Main & A1-Kindy 2002). This use of the term critical in SOC applies to the dynamic state of the whole system which maintains itself in that critical state over an extended time period. At the critical state a significant proportion of the system is close to the threshold at any one time. This concept is congrnous with that of the brittle crust being in a state of failure equilibrium (Zoback & Townend 2001).
Intermittent criticality In contrast to a global state of SOC, the concept of intermittent criticality has been proposed in which the crust is predominantly in a subcritical state, and only approaches criticality during periods of high earthquake activity.
Critical density of fractures The dependence of the permeability of a fractured rock (with insignificant matrix permeability)
Downloaded from http://sp.lyellcollection.org/ by guest on May 1, 2017
24
K.J. HEFFER
on the density of fractures has been treated in terms of percolation theory. There is a critical density of fractures below which there is no connected path of fractures across the rock sample, and the system permeability is negligible: this corresponds to the percolation threshold. Above the critical density, the permeability increases in power-law fashion.
Critically stressed fractures When a fracture has normal and shear stresses (tractions) acting on its surface such that it is in a state of incipient shear failure, it is known as critically stressed (Barton et al. 1995). From field data, it is proposed by Barton et al. (1995) that only fractures which are critically stressed are conductive; more stable fractures are generally non-conductive. This notion, allied to that of a general state of failure equilibrium (see SOC above), implies widespread high bulk permeability through the crust from fractures and, therefore, higher strength than would exist if pore pressures were high due to trapped fluids.
Appendix B: Field evidence for criticality in the Earth's crust, and hydrocarbon reservoirs in particular Some of the following items repeat the lists given by Crampin (1999) and Grasso & Sornette (1998). (1)
(2) (3)
(4)
Direct measurement of in situ stress states in wells: stresses generally lie on the Coulomb frictional failure line and follow this during perturbation of a site (e.g. Zoback & Townend 2001; Zoback & Zinke 2002). Observations of shear-wave splitting that imply fracture criticality, including changes during perturbation (e.g. Crampin, 1999). Observations of induced seismicity caused by commercial perturbations of the subsurface (see www.nyx.net/~dcypser/ induceq/induceq.bib.html for bibliographies which list over 400 references concerned with induced seismicity from fluid injection, oil and gas production, impoundment of water reservoirs, geothermal energy extraction, mining and quarrying and underground gas storage). Triggering of aftershocks by small stress changes (of the order of 1 bar or less) due to the displacements on a main earthquake (e.g. Grasso & Sornette 1998; Stein 1999).
(5)
Power-law frequency distributions of earthquake events and fractal geometries to structures. (6) By considering the relationships between entropy and energy variations calculated from a global earthquake catalogue, Main & A1-Kindy (2002) qualitatively confirmed anticipated criteria for a near-critical state, but conjectured that the degree of variability in entropy was more consistent with intermittent criticality. (7) The observations of 1/k scaling in heterogeneities measured by well logs (see main text). (8) Observed spatio-temporal correlations between rate fluctuations in production and injection from wells in hydrocarbon reservoirs (Heifer et al. 1997), which demonstrate characteristics of (a) longrange and (b) anisotropy related to modernday stress axes. (9) Observations of directionality in fluid injection schemes in oil reservoirs which are strongly correlated to modern-day stress axes (Heifer & Lean 1993) and are reproduced with modelling that involves induced shearing on pre-existing fractures (Heifer & Koutsabeloulis 1995). Microseismicity records during injection in geothermal projects have also revealed a small angle between microseismic clouds and modern-day stress axes occasioned by variable combinations of shear slip and extension on existing fractures (e.g. Cornet & Jones 1994). (10) Power-law frequency density distribution of permeabilities in fractured reservoirs (see main text and Fig. 7).
References Projects under the Micro to Macro (Ix2M) Programme that are referenced in this paper Summaries of these projects may be found in the final chapter of this volume and these are referred to in brackets after each entry in the list below. Bloomfield, J.P. (British Geological Survey) & Barker, J.A. (University College London), 'Modelling porosity development in heterogeneous fracture networks' (A10). Cassidy, R., McCloskey, J. & Morrow, P. (Ulster University, Coleraine), 'Measurement of complete fluid velocity fields in 2D heterogeneous porous media' (A15).
Downloaded from http://sp.lyellcollection.org/ by guest on May 1, 2017
MICRO TO MACRO PROGRAMME: IMPLICATIONS Coleman, M. (Reading University), 'Quantifying contributions from matrix or fracture flow by geochemical analysis of produced oil' (A4). Harris, S.D., Pecher, R., Odling, N.E., Knipe, R.J., Ellis, J.A., Elliott, L. & Ingham, D.B. (Leeds University), 'Scaling of Fluid Behaviour Associated with Flow Through Complex Geological Structures' (A6). Haszeldine, R.S., England, G.L., Quinn, O., Bhullar, A.G., AI-Kindy, F., Barclay, S.A., Graham, C.M. (Edinburgh University); Corbett, P.W.C., Lewis, H., Potter, D. (Heriot-Watt University); Yardley, B.W.D., Cleverly, J., Fisher, Q. (Leeds University); Aplin, A.C. (Newcastle University) & Fallick, A.E. (Scottish Universities Environmental Research Centre), 'Cementation of oilfield sandstones: Micron cementation reveals effects of kilometre-sized hydrogeology, with porosity and permeability scaling' (A2). Liu, E. (British Geological Survey), Hudson, J.A. (Cambridge University), Chapman, M., Vlastos, S., Li, X.Y. (British Geological Survey), Tod, S.R. (DAMTP and British Geological Survey) & Main, I.G. (University of Edinburgh), 'Determination of hydraulic properties of distributed fractures using seismic techniques' (A7). Meredith, P.G., Clint, O.C., Ngwenya, B. (University College London); Main, I.G., Odling, N.W.A. & Elphick, S.C. (University of Edinburgh), 'Crack damage and permeability evolution near the percolation threshold in a near-perfect crystalline rock' (A16). Ogilvie, S., Isakov, E. &Glover, P. (Aberdeen University), 'The Scaling Behaviour of Fluid Flow in Rough Rock Fractures' (A14). Sanderson, D.J., Zhang, X. (Imperial College) & Barker, A.J. (Southampton University), 'Localized flow in fractured rock masses: mechanisms, modelling and characterisation' (A11). Sellers, S. & Barker, J. (University College London), 'Novel flow and transport models for systems exhibiting non-integer flow dimensions' (A9). Yardley, B.W., Barnicoat, A.C., (Leeds University); Wilkinson, J.J. (Edinburgh University); Graham, C.M. (Edinburgh University) & Boyce, A.J. (SURRC) 'Multi-scale fluid-flow path analysis: calibration and modelling using mineralisation systems' (A3). Published references
AL-KINDY, F.H. 1999. Broadband (cm to km) powerlaw scaling heterogeneity in the earth's crust: evidence from fractal analysis of geophysical borehole logs. Master of Research Thesis, University of Edinburgh. BAK, P. 1997. How Nature Works - the Science of SelfOrganized Criticality. Oxford University Press, Oxford. BARKER, J.A. 1988. A generalized radial flow model for hydraulic tests in fractured rock. Water Resources Research, 24, 1796-1804. BARTON, C.A. 2000. Discrimination of Natural Fractures from Drilling-Induced Wellbore Failures in WeUbore Image Data - Implications for Reservoir
25
Permeability. SPE paper 58993, presented at the 2000 SPE International Petroleum Conference and Exhibition, Villahermosa, Mexico, 1-3 February. BARTON, C.A. & ZOBACK, M.D. 1990. Self-similar distribution of macroscopic fractures at depth in crystalline rock in the Cajon Pass Scientific Drillhole. In: BARTON, N. & STEPHANSSON, O. (eds) Rock Joints, Balkema, Rotterdam, 163-170. BARTON, C.A., ZOBACK, M.D. & MOOS, D. 1995. Fluid flow along potentially active faults in crystalline rock. Geology, 23, 683-686. BARTON, C.A., HICKMAN, S.H., MORIN, R., ZOBACK, M.D. & BENOIT, D. 1998. ReservoirScale Fracture Permeability in the Dixie Valley, Nevada, Geothermal Field. SPE paper 47371, presented at the SPE/ISRM Eurock '98 conference, Trondheim, Norway, 8-10 July. BEAN, C.J. 1996. On the cause of 1/f-power spectral scaling in borehole sonic logs. Geophysical Research Letters, 23, 3119-3122. BEAN, C.J. & MCCLOSKEY, J. 1993. Power-law random behaviour of seismic reflectivity in boreholes and its relationship to crustal deformation models. Earth and Planetary Science Letters, 117, 423-429. BERNABt~, Y. 1988. Comparison of the effective pressure law for permeability and resistivity formation factor in Chelmsford granite. Pure and Applied Geophysics, 127, 607-625. BERNABI~, Y. 1995. The transport properties of networks of cracks and pores. Journal of Geophysical Research, 100, 4231-4241. BINNEY, J.J., DOWRmK, N.J., FISHER, A.J. & NEWMAN, M.E.J. 1992. The Theory of Critical Phenomena - an Introduction to the Renormalization Group. Oxford University Press, Oxford. BLOOMFIELD, J.P., BARKER, J.A. & ROBINSON, N. 2005. Modeling fracture porosity development using simple growth laws. Ground Water, 43, 314-326. CHAKRABARTI, B.K. & BENGUIGUI, L.G. 1997. Statistical Physics of Fracture and Breakdown in Disordered Systems. Oxford University Press, Oxford. CHAN, A.W., ZOBACK, M.D., FINKBEINER, T. & ZINKE, J. 2002. Production Induced Faulting and Fault Leakage in Normal Faulting Regions: Examples from the North Sea and Gulf of Mexico. Abstract presented at the AAPG Annual Meeting, 10-13 March 2002, 'Pathways of Hydrocarbon Migration, Faults as Conduits or Seals'. CHAPMAN, M. 2003. Frequency dependent anisotropy due to meso-scale fractures in the presence of equant porosity. Geophysical Prospecting, $1, 369-379. CHAPMAN, M., ZATSEPIN, S.V. & CRAMPIN, S. 2002. Derivation of a microstructural poroelastic model Geophysical Journal International, 151, 427-451. CHAPMAN, M., MAULTZSCH, S., LIU, E. & LI, X.Y. 2003. The effect of fluid saturation in an anisotropic multi-scale equant porosity model. Journal of Applied Geophysics, 54, 191-202. CHARLAIX, E., GUYON, E. & ROUX, S. 1987. Permeability of a random an'ay of fractures of
Downloaded from http://sp.lyellcollection.org/ by guest on May 1, 2017
26
K.J. HEFFER
widely varying apertures. Transport in Porous Media, 2, 31-43. CORNEa', F. & JONES, R. 1994. Field evidences on the orientation of forced water flow with respect to the regional principal stress directions. In: NELSON, P.P. & LAUBACH, S.E. (eds) Proceedings 1st North American Rock Mechanics Symposium, Austin, Balkema, Rotterdam, 61-69. COWlE, P.A., SORNETTE, D. & VANNESTE, C. 1995. Multifractal scaling properties of a growing fault population. Geophysics Journal International, 122, 457-469. CRAMPIN, S. 1994. The fracture criticality of crustal rocks. Geophysical Journal International, 118, 428 -438. CRAMPIN, S. 1999. Implications of rock criticality for reservoir characterization. Journal of Petroleum Science and Engineering, 24, 29-48. CRAMPIN, S. 2000. Shear-wave splitting in a critical self-organized crust: the New Geophysics. Society of Exploration Geophysicists Annual Meeting, Calgary 6-11th August 2000. http:// seg.org/meetings /past/ seg2OOO/ techprog/pdf / paper0579.pdf. CRAMPIN, S. ~z CHASTIN, S. 2000. Shear-wave splitting in a critical crust: II - compliant, calculable, controllable, fluid-rock interactions. In: IKELLE, L. & GANGI, A. (eds) 'Anisotropy 2000: Fractures, converted waves and case studies', 9th International Workshop on Seismic Anisotropy (9IWSA). Society of Exploration Geophysicists, Tulsa. DARDIS, O. & MCCLOSKEY, J. 1998. Permeability porosity relationships from numerical simulations of fluid flow. Geophysical Research Letters, 25, 1471-1474. DOE, T.W. 1991. Fractional dimension analysis of constant pressure well tests. In: Proceedings of the SPE Annual Technical Conference and Exhibition, Formation Evaluation and Reservoir Geology, Dallas, Texas, October 6-9, Society of Petroleum Engineers, 461-467. DOLAN, S.S., BEAN, C.J. & RIOLLET, B. 1998. The broad-band fractal nature of heterogeneity in the upper crust from petrophysical logs. Geophysical Journal International, 132, 489-507. FEDER, J. 1988. Fractals. Plenum Press, New York. GAUTHIER, B.D.M., GARCIA, M. & DANIEL, J.-M. 2002. Integrated fracture reservoir characterization: a case study in a North Africa field. SPE Reservoir Evaluation and Engineering, August, 5, 284-294. GRASSO, J.-R. & SORNETTE, D. 1998. Testing SelfOrganized Criticality by Induced Seismicity. Journal of Geophysical Research, 103 (B12), 29 965-29 987. GREENHALL, C.A. 1999. The General&ed Autocovariance: A Tool for Clock Noise Statistics. TMO Progress Report 42-137J (http://tmo.jpl.nasa.gov/ tmo/progress_report/42-137/42-137J.pdf). HARDY, H.H. & BEIER, R.A. 1994. Fractals in Reservoir Engineering. World Scientific, Publishing Co., New Jersey. HARRIS, S.D., MCALLISTER, E., KNIPE, R.J. & ODLINr, N.E. 2003. Predicting the three-dimensional population characteristics of fault zones: a
study using stochastic models. Journal of Structural Geology, 25, 1281-1299. HEFFER, K.J. 2002. Reservoirs at a critical point - a useful concept in fracture characterization. Extended abstract presented at Petex, 2002, London, December 10-12. HEFFER, K.J. in press. Spatial scaling of effective modulus and correlation of deformation near the critical point of fracturing. Submitted to Pure & Applied Geophysics. HEFFER, K.J. & KOUTSABELOULIS,N.C. 1995. Stress Effects on Reservoir Flow - Numerical Modelling Used to Reproduce Field Data. In: DE HAAN, H.J. (ed.) New Developments in Improved Oil Recovery, Geological Society, London, Special Publications 84, 81-88. HEFFER, K.J. & LEAN, J.C. 1993. Earth stress orientation - a control on, and guide to, flooding directionality in a majority of reservoirs. In: LINVILLE, B. (ed.) Reservoir Characterization IlL PennWell Books, Tulsa, 799-822. HEFFER, K.J., FOX, R.J., MCGILL, C.A. & KOUTSABELOULIS, N.C. 1997. Novel Techniques Show Links between Reservoir Flow Directionality, Earth Stress, Fault Structure and Geomechanical Changes in Mature Waterfloods. SPE Journal, 2, 91-98 (SPE 30711). HERGARTEN, S. & NEUGEBAUER, H.J. 2001. SelfOrganized Critical Drainage Networks, Physics Review Letters, 86, 2689. HEWETT, T.A. 1986. Fractal distributions of reservoir heterogeneity and their influence on fluid transport. Paper SPE 15386. HOLLIGER, K. 1996. Upper-crustal seismic velocity heterogeneity as derived from a variety of P-wave sonic logs. Geophysical Journal International, 125, 813- 829. HOOGE, C., LOVEJOY, S., SCHERTZER,D., PECKNOLD, S., MALOUIN, J.-F. & SCHMITT, F. 1994. Multifractal phase transitions: the origin of selforganized criticality in earthquakes. Non-linear Processes in Geophysics, 1, 191-197. HURST, H.E., BLACK, R.P., & SIMAIKA, Y.M. 1965. Long-term storage: an experimental study. Constable, London. JENSEN, H.J. 1998. Self-Organized Criticality: emergent complex behaviour in physical and biological systems. Cambridge University Press, Cambridge. JOURDE, H., P1STRE, S., PERROCHET, P. & DROGUE, C. 2002. Origin of fractional flow dimension to a partially penetrating well in stratified fractured reservoirs. New results based on the study of synthetic fracture networks. Advances in Water Resources, 25, 371-387. KROHN, C.E. 1988. Fractal measurements of sandstones, shales and carbonates. Journal of Geophysical Research, 93, 3297-3305. LEARY, P.C. 1991. Deep borehole evidence for fractal distribution of fractures in crystalline rock. Geophysical Journal International, 107, 615-627. LEARY, P.C. 1996. Rock heterogeneity and fluid flow. Extended Abstracts L028, presented at the 58th EAGE Conference Amsterdam.
Downloaded from http://sp.lyellcollection.org/ by guest on May 1, 2017
MICRO TO MACRO PROGRAMME: IMPLICATIONS LEARY, P.C. 1998. Relating microscale rock-fluid interactions to macroscale fluid flow structures. In: JONES, G., FISHER, Q.J. & KNIPE, R. (eds) Faulting, Fault Sealing and Fluid Flow in Hydrocarbon Reservoirs. Geological Society, Special Publications, 147, London, 242-269. LEARY, P.C. 2002. Fractures and physical heterogeneity in crustal rock. In: GOFF, J.A. & HOLLIGER, K. (eds) Heterogeneity in the crust and upper mantle: nature, scaling and seismic properties. Kluwer Academic, New York, Chpt 8. LEARY, P.C. & AL-KINDY, F. 2002. Power-law scaling of spatially correlated porosity and log(permeability) sequences from north-central North Sea Brae oilfield well core. Geophysical Journal International, 148, 426-442. LI, W. 1991. Expansion-modification systems: A model for spatial 1/f spectra. Physics Review A, 43, 5242-5260. MAIN, I.G. 1996. Statistical Physics, Seismogenesis and Seismic Hazard, Reviews of Geophysics, 34, 433 -462. MAIN, I.G. & AL-KtNDY, F.H. 2002. Entropy, energy and proximity to criticality in global earthquake populations. Geophysical Research Letters, 29, 7. MANDELBROT, B.B. & WALLIS, J.R. 1969. Some longrun properties of geophysical records. Water Resources Research, 5, 321-340. MARSAN, D. & BEAN, C.J. 1999. Multiscaling nature of sonic velocities and lithology in the upper crystalline crust: evidence from the KTB Main Borehole. Geophysical Research Letters, 26, 275-278. MATT1SON, C., KNACKSTEDT, M.A. & SENDEN, T.J. 1997. Transport in fractured porous solids, Geophysical Research Letters, 24, 495-498. MAULTZSCH, S., CHAPMAN, M., Ltu, E. & LI, X.-Y. 2003. Modelling frequency dependent seismic anisotropy in fluid-saturated rock with aligned fractures: Implications of fracture size estimation from anisotropic measurements. Geophysical Prospecting, 51, 381-392. MAXWELL, S.C., YOUNG, R.P., Bossu, R., JUPE, A. & DANGERFIELD, A. 1998. Microseismic logging of the Ekofisk Reservoir. Paper SPE/ISRM 47276 presented at Eurock 98 SPE/ISRM Rock Mechanics in Petroleum Engineering Conference. 8-10 July, Trondheim. ODLING, N.E. & WEBMAN, I. 1991. A conductance mesh approach to the permeability of natural and simulated fracture patterns. Water Resources Research, 27, 2633-2643. ODLING, N.E., HARRIS, S.D. & KNIPE, R.J. 2004. Permeability scaling properties of fault damage zones in siliclastic rocks. Journal of Structural Geology, 26, 1727-1747. REVIL, A. & CATHLES, L.M. III 2002. Fluid transport by solitary waves along growing faults. A field example from the South Eugene Island Basin, Gulf of Mexico. Earth & Planetary Science Letters, 202, 321-335. RICE, J.R. 1992. Fault stress states, pore pressure distribution, and the weakness of the San Andreas Fault. In: EVANS, B. & WONG, T.-F. (eds) Fault
27
Mechanics and Transport Properties in Rocks. Academic Press, San Diego, 472-503. SCHULZKY, C., ESSEX, C., DAVISON, M., FRANZ, A. & HOFFMANN, K.J. 2000. A Comparison of Anomalous Diffusion Equations. Journal of Physics A: Math Gen, 33, 5501-5511 SIBSON, R.H. 1996. Structural permeability of fluiddriven fault-fracture meshes. Journal of Structural Geology, 18, 1031-1042. SORNETTE, D. 2000. Critical Phenomena in Natural Sciences: chaos, fractals, self-organization, and disorder: concepts and tools. Springer-Verlag, Berlin. SORNETTE, D., DAVY, P. & SORNETTE, A. 1990. Structuration of the lithosphere in plate tectonics as a self-organized phenomenon. Journal of Geophysical Research, 95, 17 353-17 361. STEIN, R.S., 1999. The role of stress transfer in earthquake occurrence. Nature, 402, 605-609. STOWELL, J.F.W., LAUBACH,S.E. & OLSON, J.E. 2001. Effect of modern state of stress on flow-controlling fractures: a misleading paradigm in need of revision. Paper presented at DC Rocks', the American Rock Mechanics Association's 38th US Rock Mechanics Symposium, Washington, D.C., July 9. TANG, C. & BAK, P. 1988. Critical Exponents and Scaling Relations for Self-Organized Critical Phenomena. Physics Review Letters, 60, 23. Too, S.R. 2001. The effects on seismic waves of interconnected nearly aligned cracks. Geophysical Journal International, 146, 249-263. VLASTOS, S., LIU, E., MAIN, I.G. & LL X.Y. 2002. Numerical simulation of wave propagation in media with discrete distributions of fractures: effects of fracture sizes and spatial distributions. Geophysical Journal International, 152, 649-668. WALDEN, A.T. & HOSKEN, J.W.J. 1985. An investigation of the spectral properties of primary reflection coefficients. Geophysical Prospecting, 33, 400-435. WALSH, J.B. & BRACE, W.F. 1984. The effect of pressure on porosity and the transport properties of rocks. Journal of Geophysical Research, 89, 9425-9431. WILLIS-RICHARDS, J., WATANABE, K. • TAKAHASHI,H. 1996. Progress towards a stochastic rock mechanics model of engineered geothermal systems. Journal of Geophysical Research, 101(B8), 17 481-17 496. YALE, D.P. 1984. Network modelling of flow, storage and deformation in porous rocks. PhD thesis, Stanford University. ZATSEPIN, S.V. & CRAMPIN, S. 1997. Modelling the compliance of crustal rock: 1. Response of shearwave splitting to differential stress. Geophysical Journal International, 129, 477-494. ZHANG, X. & SANDERSON,D. 2002. Numerical Modelling and Analysis of Fluid Flow and Deformation of Fractured Rock Masses. Elsevier Science, Oxford. ZHANG, X., SANDERSON, D. & BARKER, A.J. 2002. Numerical study of fluid flow of deforming fractured rocks using dual permeability model. Geophysical Journal International, 151, 452-468. ZHANG, Y., HOBBS, B.E., ORD, A., BARNICOAT, A., ZHAO, C., WALSHE, J.L. & LIN, G. 2003. The influence of faulting on host-rock permeability, fluid flow and mineral precipitation: a conceptual 2-d
Downloaded from http://sp.lyellcollection.org/ by guest on May 1, 2017
28
K.J. HEFFER numerical model. Journal of Exploration, 78-79, 279-284.
Geochemical
ZOBACK, M.D. & TOWNEND, J. 2001. Implications of hydrostatic pore pressures and high crustal strength for deformation of the intraplate lithosphere. Tectonophysics, 336, 19-30.
ZOBACK, M.D. & ZINKE, J.C. 2002. Productioninduced Normal Faulting in the Valhall and Ekofisk Oil Fields. Pure and Applied Geophysics, 159, 403-420.