The Perception of Technical Debt in the Embedded Systems Domain: An Industrial Case Study Areti Ampatzoglou1, Apostolos Ampatzoglou1, Alexander Chatzigeorgiou2, Paris Avgeriou1, Pekka Abrahamsson3, Antonio Martini4, Uwe Zdun5, Kari Systa6 1
Department of Computer Science, University of Groningen, Groningen, Netherlands Department of Applied Informatics, University of Macedonia, Thessaloniki, Greece 3 Department of Computer and Information Science, National Technical University of Norway, Trondheim, Norway 4 Department of Computer Science and Engineering, Chalmers University of Technology, Gothenburg, Sweden 5 Faculty of Computer Science, University of Vienna, Vienna, Austria 6 Department of Software Systems, Technical University of Tampere, Tampere, Finland 2
[email protected],
[email protected],
[email protected],
[email protected],
[email protected],
[email protected],
[email protected],
[email protected]
Abstract—Technical Debt Management (TDM) has drawn the attention of software industries during the last years, including embedded systems. However, we currently lack an overview of how practitioners from this application domain perceive technical debt. To this end, we conducted a multiple case study in the embedded systems industry, to investigate: (a) the expected lifetime of components that have TD, (b) the most frequently occurring types of TD in them, and (c) the significance of TD against run-time quality attributes. The case study was performed on seven embedded systems industries (telecommunications, printing, smart manufacturing, sensors, etc.) from five countries (Greece, Netherlands, Sweden, Austria, and Finland). The results of the case study suggest that: (a) maintainability is more seriously considered when the expected lifetime of components is larger than ten years; (b) the most frequent types of debt are test, architectural, and code debt; and (c) in embedded systems the runtime qualities are prioritized compared to design-time qualities that are usually associated with TD. The obtained results can be useful for both researchers and practitioners: the former can focus their research on the most industrially-relevant aspects of TD, whereas the latter can be informed about the most common types of TD and how to focus their TDM processes. Keywords—technical debt; embedded systems; industry; case study
I. INTRODUCTION Embedded Software (ES), as a type of software targeting devices that is not typically thought of as computers, is usually specialized for a particular hardware and therefore has platform-specific run-time constraints (e.g., memory usage, processing power, etc.) [24]. In recent decades, software plays an increasingly important role in the development process of embedded products: as suggested by Rauscher and Smith some embedded companies have increased the percentage of staff devoted to developing software in the organization—as much as 80% in some software-intensive domains [22]. A possible explanation for that is software’s negligible replication cost and its greater flexibility compared to hardware, which makes it easier to change. Thus, product development managers often allow for some software additions or changes late in the prod-
uct development cycle to address hardware problems or to add new functionality [22], resulting in intense maintenance activities. An additional challenge in embedded systems is the long lifetime expectancy, which is normally beyond a decade (see Section III.B), requiring the management of old systems in parallel to the design and implementation of new ones. Any decision to take advantage of novel hardware and software platforms means that companies need to manage many different configurations. Based on the above, it can be concluded that maintenance is an extremely challenging and costly activity in the ES domain. To decrease the effort spent on maintenance, companies could invest in boosting design-time quality (e.g. maintainability) [3]. However, in most cases, companies trade-off designtime qualities in favor of business qualities such as product time-to-market. The relevance of this strategy for embedded software development has already been acknowledged in the literature: embedded software development is particularly challenging in the high-end technology sector, which is characterized by shortening product lifecycles, rising market fragmentation, and rapid technological changes [5], [18]. The aforementioned compromise between design-time qualities and business qualities, leads to the creation of a financial overhead in future maintenance activities, usually termed as technical debt (TD) [8]. It has been widely accepted that in an industrial context zero technical debt is not realistic, and probably not even desirable; the investment to reduce TD to zero would be extremely inefficient [10]. Thus, establishing Technical Debt Management (TDM) methods, tools and techniques are necessary to guide the (partial) technical debt repayment, the prioritization of refactoring opportunities, and the provision of design decisions that will improve the quality of software. Although current methods, tools and techniques for monitoring and managing technical debt are continuously improving, they do not target specific application domains, like Embedded Systems. In particular, we expect that ES are in need of domain-specific methods, due to the special requirements of such software applications, e.g., hard software constraints, the
need to guarantee run-time qualities, etc. A first step toward the development of domain-specific methods, tools and techniques is the in-depth understanding of TD in the domain under consideration. To this end, in this paper we perform an exploratory case study that aims at understanding how TD is perceived in the ES industries. This understanding can support steering research in technical debt management as well as raising awareness among ES practitioners on technical debt-related issues. The rest of the paper is organized as follows: In Section II, we present related work on studies that report on TDM in an industrial context and studies that report on the important quality attributes for embedded software systems development. In Section III, we report on the case study design, whereas in Section IV we present our results, organized by research question and accompanied with possible interpretations. The results are discussed in Section V, with respect to the implications to researchers and practitioners that they provide. Finally, in Section VI we report threats to validity and mitigation actions, whereas in Section VII, we conclude the paper. II. RELATED WORK We have identified a few studies on investigating the accumulation and management of technical debt in industry. Ernst et al. [11] conducted a survey to understand which Technical Debt type is more frequent among practitioners. The results show that architectural debt is the one that is mostly mentioned by practitioners. Although 31% of the respondents belong to the embedded software domain, the paper does not distinguish results with respect to the application domain. Ernst et al. have also found that the main challenges so far are the lack of systematic practices, and the inadequateness of the tools (too complex to install or to interpret and too many false positives), while another major issue is the difficulty of increasing the awareness of TD for stakeholders without software engineering expertise; the latter is also recognized by both Lim et al. [17] and Martini et al. [20]. According to Lim et al., [17] measuring TD is difficult for practitioners, because the impact is not uniform. Codabux et al. [7] mention that the repayment of TD is highly influenced by the customer needs and they also discuss the fact that practitioners decide to take on debt in order to achieve their short-term objectives, although they cannot be fully aware of the potential serious long-term consequences. Martini and Bosch [19] highlight how TD repayment can be prioritized in an industrial context, by discussing with practitioners. The major difference of these studies, compared to ours is that we focus our investigation on the embedded software domain. In addition to studies that focus on TD in industry, as related work, we discuss papers that provide insights on the important quality attributes (QAs) in the embedded systems domain. This kind of work is pertinent as TD represents in its core a tradeoff between maintainability and other qualities. Concerning the interplay between QAs in the domain of embedded systems, Del Rosso presents an architectural approach for improving the performance of software products, derived from a product family for real-time embedded systems, and its possible implications to maintainability [9]. The results suggest that by analyzing the commonalities and differences among derived products, one can extract bottlenecks and problems in
the core architecture (e.g., a God class). In a similar context, Oliveira et al. investigate the relationship between non-critical quality attributes, measured by metrics obtained from source code, and performance, measured by physical metrics (i.e., memory, time, and energy) obtained from run-time monitoring [21]. The results indicate the existence of trade-offs between quality and physical metrics, as well as the fact that quality metrics can provide information regarding high-level quality attributes, guiding the design solution selection at early stages, which might lead to significant gain in physical characteristics later on. Finally, Feitosa et al. [12] analyze the difference in the trade-offs among quality attributes in critical and non-critical embedded software. The quality attributes of interest were: correctness, performance, security, reusability, understandability, functionality, extendibility, effectiveness, and flexibility. Based on the results of this study, the authors provide some hints that understandability has an inverse relationship with all the other qualities. Compared to the aforementioned studies, we emphasize on (the lack of) maintainability, which can be considered a factor for the accumulated TD. III. CASE STUDY DESIGN To explore the perception of industrial practitioners on technical debt, we have performed an exploratory case study on seven embedded systems companies (see Section III-B). The main reason for conducting this case study is that domainspecific TDM requires a detailed understanding of how the TD phenomenon is perceived in software-intensive industries. In this section we describe the case study design, according to the guidelines proposed by Runeson et al. [23]. A. Objective and Research Questions The goal of this study, described using the Goal-QuestionMetric (GQM) formulation [4], is: “to analyze the perception of technical debt in the embedded systems industry for the purpose of understanding with respect to: (a) the expected lifetime of components that have TD, (b) the types of technical debt that are frequently occurring, and (c) the significance of other quality attributes from the point of view of software engineers, in the context of embedded software development”. By taking into account the inherent relationship of maintainability and technical debt [15] in this study we consider maintainability as a proxy for TD. We have chosen this proxy, since the term TD is not interpreted unambiguously in industry: practitioners may mean different things when discussing TD and related concepts like principal and interest. On the other hand, maintainability, though not associated to a universally accepted definition, is widely accepted as the ability to make changes in a system. Moreover, even when a practitioner is not aware of incurred TD, any decisions aimed at enhancing maintainability, will result in a lower amount of TD. On the other end, if a development team is not interested in producing a maintainable system, then it is highly probable that shortcuts will be made, leading to the accumulation of technical debt. Thus we have used maintainability as the proxy for RQ1 and RQ3; this proxy is discussed further in the threats to validity (see Section VI). Based on the abovementioned goal, we have extracted three research questions (RQs):
RQ1: What is the relationship between the expected lifetime of components and technical debt? This research question is considered important, in the sense that managing technical debt is important for components, whose accumulated interest, at some point becomes larger than the principal [3][6]. In other words, technical debt that is accumulated on components that are not maintained for a large time period is less probable to be harmful than for components with a high expected lifetime. This aspect becomes even more important for embedded systems, since their expected lifetime is usually long. For this research question we will study the relationship between the focus of development teams on maintainability (as a proxy for TD) and the expected lifetime of the software. In other words, we will explore if software engineers focus on maintainability (potentially managing TD) when the system under development is expected to be active for many years. RQ2: What types of technical debt (e.g., code, architectural, etc.) are more frequently occurring in embedded systems? According to Li et al. [16], technical debt can be identified in all phases of software development. In particular, Li et al. have identified 10 types of TD (see Section III.C for more details). Each one of these TD types requires different technical debt management approaches. Therefore, understanding which the most frequent ones are can support prioritization and monitoring of TD. RQ3: What is the significance of building maintainable software systems (with low TD) compared to satisfying other quality attributes? In embedded system industries, run-time constraints are very important for software development. Therefore, trade-offs between run-time and design-time qualities are a common practice [12]. In this research question, we examine which quality attributes are taken into account in embedded software development, and how these are prioritized. In particular we aim at comparing the importance given to maintainability (the QA that is used as a proxy for TD) against the other quality attributes. By answering this research question we gain insight into which quality attributes are prioritized in software development, and which ones are negotiable in the ES domain.
TABLE I. EXPLORED EMBEDDED INDUSTRIES Company Description ID
Application Domain
Country
Type
#Analyzed Components
C1
Telecommunications
Sweden
Large
1
C2
Automotive
Sweden
Large
1
C3
Mobile
Greece
SME
7
C4
Sensors
Greece
SME
3
C5
Printing
Netherlands
Large
1
C6
Smart Manufacturing
Austria
Large
6
C7
Media Devices
Finland
SME
1
From the data of Table I, we can observe that in our dataset we have selected a balanced mix of Small/Medium Enterprises (SMEs) and Large Enterprises. The last column of Table I, presents the number of units of analysis (i.e., analyzed components) that have been provided by each company. In total, 20 units of analysis have been extracted and analyzed. The components from each company and some challenges and interests of the companies are briefly described as follows: • Company C1 contributed a telecom component that has been in use for 50 releases and is expected to be maintained for approximately 30 more years. For C1, compatibility, functional suitability, and reliability are having the highest priority so far. The major challenges that the company faces while repaying TD are: (a) the prioritization of feature development before repaying debt, and (b) the difficulty in smoothly planning refactorings. Developers are mostly interested in test and architecture TD. • Company C2 contributed an automotive component that has already been released 30 times from 2013, and therefore is in need of intense maintenance activities. The expected lifespan for this component is 15 more years. While developing and maintaining this component, C2 is interested in ensuring functional suitability, reliability, and security. The company is interested in working on feature coverage test, pass rates of test cases, and prioritization of features during development.
B. Case Selection Cases and Units of Analysis. According to Runeson et al. [23], case studies can be characterized either as holistic or embedded, based on the way cases and units of analysis are defined. This study is an embedded multiple case study, because we investigate multiple units of analysis (i.e., components in which technical debt has been identified) extracted from multiple embedded systems industries (i.e., cases).
• Company C3 contributed seven mobile components, which are of various levels of maturity (1-21 releases so far), which have an infinite expected/desired lifespan (i.e., as far as the customer wants to use them). Although maintainability is of great interest to the company, since their embedded products might need to survive for a long period, so far the company is mostly focused on other quality attributes (i.e., usability, functional suitability, and performance). The form of TD that the company wants to repay is within the software architecture, source code, testing, documentation, and underlying infrastructure.
Case Selection. In this study, we consider as cases embedded systems companies, specializing in different application domains, and located in different European countries. A brief description of the companies is presented below and is summarized in Table I. The companies have been anonymized due to confidentiality reasons.
• Company C4 contributed three components (i.e., “Monitoring and processing”, “Sensor Configurator”, and “Reporting tool”). The system is a rather “young” project, i.e., half-year, and is expected to be used from the company for 5 more years. Although maintainability is characterized as important from the company, other quality at-
tributes, like security, functional suitability and reliability are getting more priority. The company is interested in managing architectural, source code, test, and build TD. • Company C5 contributed the “Printing Data Path (PDM)” component, which has been used from the company for almost ten years, and its expected lifetime is 5 additional years. PDM is a highly reusable component that needs to be adapted to different printers’ hardware. Compared to the previous years, C5 is interested in putting extra effort in repaying technical debt related to testing, documentation, and design. At the same time, the functional suitability, reliability and performance of PDM are not negotiable. • Company C6 contributed the “Product Status Sensor”, the “Weather Sensing”, the “Product Data”, and the “Data Aggregator” components, and two components of a “Smart Product Maintenance” application. The expected lifetime of the aforementioned components is between 10 – 20 years, so their easy extension and maintenance is crucial to the company. Based on the current knowledge on the quality key-drivers for these components, functional suitability, reliability and performance should be kept at the highest level while managing technical debt. • Company C7 contributed a software component used for home media server applications. The component includes a platform and an SDK for application development. The software has been developed since early 2000 and during the years it has evolved significantly. The expected lifespan of the project is 20 years from now. Since the area of home automation is new and there are many players in the market, the system should be compatible with a huge number of external systems and different installations connected to different sets of home automation systems (high portability and compatibility are required). Rapid implementation of the support for these systems may create technical debt. C. Data Collection Every company (case) has been asked to provide us with a number of components that have accumulated technical debt and are difficult to maintain. Next, for each unit of analysis the following information has been recorded: Project Demographics [V1] Textual description of project, in which the TDI has been identified. [V2] First release date of the project. This variable aims at expressing how old the component is. [V3] Number of releases until now. This variable provides an indication on how frequent the maintenance of this component is. Technical Debt Item Data Points [V4] Estimated lifespan of the TDI. This variable represents how significant it is to eliminate the TD from the component, since it denotes the time period during which the company is paying interest. Due to the low number
of units of analysis, we preferred to recode this variable in a categorical one, so that each data class has more members. Therefore, we recode values less than 10 years to “short-term projects” and values between 10 and 30 years to “long-term projects”. The selection of the threshold of 10 years was made since it is the median of our sample, and a decade is considered as a milestone in terms of time periods. [V5] Types of debt identified. In this variable we record what types of TD are identified in the selected component. The types have been extracted from the work of Li et al. [16], summarized as follows: Requirements, Architecture, Design, Code, Test, Build, Documentation, Infrastructure, and Versioning. We note that from the list provided by Li et al. [16], we have removed Defect Debt, since the TD community does not consider the existence of defects as TD principal [15]. [V6] Importance of quality attributes along TDI evolution. A rating, in a scale from 1(lowest) to 5 (highest), of the importance of the following QAs: Functional suitability, Reliability, Performance, Usability, Security, Compatibility, Maintainability, and Portability. The quality attributes have been selected so as to represent both design-time and run-time quality attributes. The data collection has been performed through interviews with software engineers (i.e., designers, architects, project managers) during which data have been recorded by the researchers (a supervised questionnaire-based approach [14]). The use of supervised data collection methods ensures the understanding of the data collection instrument from the interviewees and strengthens validity. Nevertheless, the use of a supervised data collection method has restricted the size of our dataset to 20 units of analysis (obtained by 7 companies), since it was time consuming. We note that variables [V4] – [V6] have been answered by practitioners without the use of any documentation, since: [V4] represents an estimation of the respondent, in none of the companies the technical debt items ([V5]) were documented, and [V6] represents the importance of several QAs according to experts’ opinion. D. Data Analysis To answer the research questions set in section III.A, we have performed descriptive statistical analysis and hypothesis testing. The analysis plan per research question is presented in Table II. More specifically, concerning RQ1, we used descriptive statistics on the expected lifespan of components that carry technical debt. In addition, we explored the correlation between expected life-time and maintainability tasks to unveil a possible relationship, by performing a chi-square test. Regarding RQ2, we report frequencies for the different types of technical debt of the highest level, as reported by Li et al. [16]. Furthermore, we present details on how industries perceive technical debt types, by synthesizing the obtained results. Finally, concerning RQ3, we analyzed the data in three ways: (a) we present descriptive statistics on the importance of each quality attribute separately; (b) we inspected if there are differences among the importance of quality attributes; and (c)
we performed Wilcoxon Ranks Test between QAs and maintainability (the attribute that is considered as a proxy to technical debt). Using the above, have been able to spot differences in the way different quality attributes are prioritized. Such differences can lead to intentional or unintentional trade-offs. In particular, QA that receive higher priority than maintainability are expected to be non-negotiable while managing TD. TABLE II. DATA ANALYSIS PLAN RQ
regardless of the values of the grouping variable (expected lifespan of the project). TABLE III. RELATION BETWEEN ESTIMATED LIFETIME & MAINTAINABILITY Maintainability Estimated Lifespan
Analysis
1
V4 (Estimated Lifespan) V6 (Importance of Maintainability)
Descriptive statistics Cross-Tabulation chi-square test
2
V5 (Types of TD)
Descriptive statistics
3
V6 (Importance of QAs)
Descriptive statistics Wilcoxon Signed Rank
IV.
Low
neutral
high
very high
Observed Count
0,0
0,0
3,0
5,0
1,0
Expected Count
1,4
1,4
1,4
4,5
0,5
Observed Count
3,0
3,0
0,0
5,0
0,0
Expected Count
1,7
1,7
1,7
5,5
0,6
Long
Analysis Plan Used Variables
very low
RESULTS
In this section we present the results organized by research question. In each section, we first answer the questions using statistical analysis, and then provide a possible interpretation of the obtained results. A. RQ1: Technical Debt and ES Expected Lifetime To answer RQ1 we have performed cross tabulation to examine the relationship between the projects’ lifetime expected duration and the attention given by practitioners to maintainability. The dataset consists of components with expected lifetime that varies from less than one to 30 years. The mean expected lifetime of the components is 12.40 years, with a standard deviation of 8.94, and a median of 10 years. As mentioned above (Section III.C), we have added a categorical variable that separates the dataset into two groups. The first one contains components that are expected to last for less than ten years (short-term projects), and the second one consists of components with an estimated lifecycle between 10 and 30 years (long-term projects). The analysis suggests that 45% of the components belong to the short-term projects category, while 55% of the components belong to the long-term projects one. The results of the cross tabulation suggest that 66.7% (6 out of 9) of the components with long estimated lifecycle receive high attention in terms of maintainability (scores ‘high’ and ‘very high’). On the other hand, practitioners do not consider maintainability issues important for the majority of the shortterm components, as 54.6% (6 out of 11) of them have low maintainability importance scores (‘very low’ or ‘low’). The results of the cross tabulation are presented in Table III. Each column of the table represents the level of importance that practitioners have assigned to maintainability, whereas each line counts the observed and the expected number of long-term or short-term components that correspond to each level. The observed counts represent the frequencies based on experts’ opinion, whereas the expected counts, represents the frequencies that would be expected based on data distribution. The closer the observed and expected counts are, the more unrelated the two variables are [13], in the sense that the frequencies (levels of maintainability) follow the expected distribution,
Short
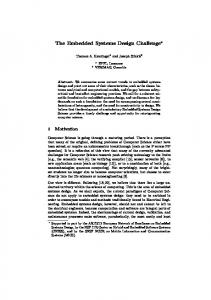
To objectively assess this relationship, we have performed a chi-square (x2) test. The x2 test revealed that there is a statistically significant relationship (x2 = 9.89 and sig. = 0.042 < 0.05). The aforementioned relationship between the expected lifetime of the project and the importance of maintainability is intuitive, since software engineers are not expected to put extra effort (representing the principal of technical debt [3]) on the development of applications that will not be maintained for long periods. This observation suggests that short-term projects are expected to be developed with more design-time compromises, and therefore with more accumulated technical debt. The technical debt management activities (TD repayment, prevention, etc.) are expected to be more relevant for projects for which long-term maintenance periods are anticipated. B. RQ2: Types of Technical Debt In order to detect the most frequently identified types of technical debt in embedded systems industries, we have analyzed the data on the types of TD reported by practitioners and we have performed descriptive statistical analysis. Figure 1 presents a bar chart on the frequency of types of technical debt on the investigated industrial components (as a percentage).
Fig. 1. Types of Debt Frequencies
As shown in Fig. 1, the most frequently identified TD types are test debt (e.g., limited number of unit tests, lack of test automation, etc.) which is identified in 90% of the components. It is followed by code debt (e.g., duplicate code, long methods, etc.) and architectural debt (e.g., anti-patterns, best practice violations, etc.), reported in 80% and 70% of the cases respec-
tively. Next, documentation (e.g., outdated documentation), design (e.g., grime, design principles violation) and infrastructure (e.g., old technology in use) debt are found in many cases (55-60%). Requirements (e.g., over-engineering), build (e.g., manual build process) and versioning (e.g., multi-version support) debt seem to be the least commonly identified types of technical debt. This fact suggest that the most “tangible” and easily detectable types of technical debt (e.g., duplicate code, test case, and design artifacts) are more easily understood and reported by practitioners. A more fine grained analysis of the most frequent types of technical debt is presented in Table IV. The terms presented in Table IV have been reused from the TD types reported by Li et al. [16]. In addition, from the results of Table IV, we can observe that two different subcategories of types of TD exist: (a) the types of debt that exist in the system (e.g., duplicate code) and therefore is more easily quantifiable and its potential impact can be estimated, and (b) the types of debt that refer to what is missing from the system (e.g., lack of test cases) for which only estimations can be performed.
quality attribute is considered more important if the most frequent answers are concentrated in ‘high’ and ‘very high’ scales. For example, functional suitability is considered of great importance since there was no component for which its importance was characterized as ‘neutral’, ‘low’, or ‘very low’. On the other hand, security and portability have been characterized as ‘low’ or ‘very low’ importance for approximately 5055% of the investigated components.
TABLE IV. FREQUENT TYPES OF TECHNICAL DEBT Type of Technical Debt Item
Frequency
Duplicate code
6
Limited number of unit tests
6
Complex code
3
Old technology in use
3
Lack of automated deployment
3
Violations of good architectural practices
2
Lack of test automation
2
The aforementioned results are in accordance to those of Alves et al. [1] who are reporting on the most frequently studied types of technical debt in the research community. In particular, according to Alves et al. design, architecture, and documentation debt are the most frequently studied types in the TD literature. The fact that our results are in accordance with those of Alves et al. suggests that until now the research directions are quite accurately focused on the industrial needs. The only possible exceptions are design debt, which does not seem to be as important for practitioners as it is for researchers, and test and code debt, which does not appear to be appealing to researchers. Apart from industrial relevance, an additional parameter that makes research on these topics popular is the existence of tools for testing, code, and design quality assurance. The most recurring types of technical debt in industry are test, architectural design, and source code debt. Architectural and design debt are among the most frequently studied by researchers, as well. On the other hand, some types of TD (e.g., test, code, and infrastructure), which are interesting for practitioners, are understudied by the research community. C. RQ3: Technical Debt and Quality Attributes To investigate the relationship between quality attributes (other than maintainability) and technical debt, we compare the importance that is assigned to them by practitioners. The importance of each quality attribute is presented in Figure 2. A
Fig. 2. Importance of Quality Attributes
We performed Wilcoxon Signed Rank tests to investigate the frequency with which each QA is given more / less priority than maintainability (which is considered as a proxy for technical debt). The results are presented in Table V. In particular, the first column of the table represents the QAs, the second and third column depict if the quality attribute under discussion is getting higher priority against maintainability or not, and the last column stands for the p-value for the test (values lower than 0.05 denote a statistically significant difference). The QAs
that receive higher importance/priority against maintainability (p