This article has been accepted for inclusion in a future issue of this journal. Content is final as presented, with the exception of pagination. IEEE TRANSACTIONS ON POWER SYSTEMS
1
The Probabilistic Collocation Method for Power-System Damping and Voltage Collapse Studies in the Presence of Uncertainties Robin. Preece, Student Member, IEEE, Nick C. Woolley, Student Member, IEEE, and Jovica V. Milanović, Fellow, IEEE
Abstract—This paper explores the feasibility of using the Probabilistic Collocation Method (PCM) in power-system studies in the presence of uncertainties. The application of the PCM is illustrated on small disturbance stability studies and voltage stability studies. First, the PCM is used to determine the effects of a supplementary power oscillation damping (POD) controller installed on a VSC-HVDC line in the presences of parameter and operational uncertainties. Second, it is used to calculate the probabilistic distance to voltage collapse in a distribution system based on measurement errors. The PCM is shown to produce accurate statistical results whilst drastically reducing the computational time of the studies in both cases. Additionally, a ranking process based on eigenvalue sensitivity is presented alongside the small disturbance analysis as an appropriate method for reduction of system complexity for extension to large power systems. This technique is validated through the application of the PCM on a large power-system model, yielding accurate probabilistic results. Index Terms—Electromechanical modes, Monte Carlo, power oscillation damping (POD), Probabilistic Collocation Method (PCM), uncertainty, voltage stability, VSC-HVDC.
I. INTRODUCTION
P
ROBABILISTIC studies in power systems have traditionally been limited to evaluation of system reliability [1]–[5]. Power-system stability studies that dealt with uncertainty focused mainly on uncertain system operating conditions [6]–[11] but typically did not model those probabilistically. These probabilistic studies become particularly relevant when considering future power networks as the increased stochastic and intermittent nature of distributed generation and loads will lead to a rise in generation and loading uncertainty. The Monte Carlo (MC) pseudorandom sampling method has been, and still is, frequently utilized to perform these studies. With increasing system complexity, however, there is increasing computational burden with every system simulation required. Applying the MC method, therefore, may prove to be prohibitively slow for
Manuscript received February 14, 2012; revised May 25, 2012, August 30, 2012; accepted November 06, 2012. This work was supported by the Engineering and Physical Sciences Research Council (EPSRC), National Grid plc, and the Power Networks Research Academy (PNRA). Paper no. TPWRS-00064-2012. The authors are with the School of Electrical and Electronic Engineering, The University of Manchester, Manchester, M60 1QD, U.K. (e-mail:
[email protected];
[email protected]). Color versions of one or more of the figures in this paper are available online at http://ieeexplore.ieee.org. Digital Object Identifier 10.1109/TPWRS.2012.2227837
some applications, particularly for online studies. Furthermore, to ensure confidence that the full variation in system parameters is captured, when applying the MC method, a large number of simulations is required. A method that significantly reduces the number of simulations required while accurately producing the probability distributions for system parameters is the Probabilistic Collocation Method (PCM). It approximates the system response as a polynomial function of the uncertain parameters and therefore replaces a computationally intensive study with a simple deterministic algorithm. The PCM polynomial function is created around a set of full simulations at specific operating points, determined by the modeled uncertainties. Alternative approaches in the past have investigated the use of techniques such as low sequence-based sampling discrepancy sequences (LDS) or to ensure the full search space is evenly sampled within fewer full simulations [12], [13]. Another recent study has made use of Latin hypercube sampling with Cholesky decomposition to improve the accuracy of reduced numbers of MC runs when completing probabilistic load flow [14]. Using a similar approach, the PCM model function is created from a small number of efficiently selected samples. However, these samples are not selected to evenly cover the search space as in [12]–[14]. The samples are chosen to ensure coverage of the most probable operating points to occur based upon the known probability distributions for the uncertain system parameters. The accuracy of the PCM estimation of the desired system outputs is therefore focused on the most probable values. Other methods for probabilistic system stability studies include purely analytical solutions such as Gram–Charlier expansion (or cumulant-based) methods as used in [15] and generalized tetrachoric series-based methods as presented in [16]. Such approaches have been shown to provide accurate solutions but require complicated mathematical analysis and often the inclusion of approximations in order to converge on a solution within an acceptable length of time. More similar to the PCM are techniques such as the two point estimate (TPE) method, used in [17] to assess probabilistic stability. Like the PCM, TPE uses a small number of simulations to estimate the distribution of the desired system parameter. Although TPE requires just uncertain parameters, it full simulations for a system with assumes a predetermined distribution for the measured output (typically Normal), which is not necessarily the case in practical nonlinear power systems, and is not a constraint on the PCM approach.
0885-8950/$31.00 © 2012 IEEE
This article has been accepted for inclusion in a future issue of this journal. Content is final as presented, with the exception of pagination. 2
IEEE TRANSACTIONS ON POWER SYSTEMS
PCM has been applied in numerous fields in the past [18], [19], but it was first introduced in power system studies in [20] and later in [21], [22]. There are two clear benefits of the PCM that make it particularly suitable for application in power system studies which incorporate uncertainty. First, the method is designed to provide a statistical distribution of the system output. This is of great value when considering measurement errors or statistical uncertainty in future operating points and when trying to calculate risk indices. Second, the method provides significant savings with respect to the number of full system studies that are required. This leads to a reduction in computational time and increases feasibility of incorporation of uncertainty into online studies. With the expected increase in proliferation of stochastic and intermittent distributed generation and load, online statistical uncertainty studies will become a key element in coping with increasingly variable network conditions. Previous work in this area investigated the effects of uncertain load model parameters [20], [21] and fault clearing times [20] on the transient response of a system and the effects of load model parameters on small disturbance stability of the system [22]. In these studies, however, only small numbers of uncertainties (no more than two) have been considered, so the applicability of the PCM to systems with greater numbers of uncertain parameters is still unexplored. The work presented in this paper demonstrates how the PCM can be applied to two different areas of power system studies while simultaneously considering a large number of uncertainties. The paper clearly establishes and demonstrates, on both small and large test networks, that the techniques for reduction in number of uncertain parameters are capable of preserving the required level of accuracy in order to use the PCM with large power system. The paper represents the first demonstration of the practical applicability of using the PCM to study the effects of multiple uncertainties within realistically sized power systems. The power system study areas chosen for demonstrating feasibility of PCM application in this paper are given here. 1) Small disturbance stability analysis of a small test transmission network incorporating a VSC-HVDC link with uncertain operating conditions, in order to comprehensively assess the effects of a supplementary power oscillation damping (POD) controller. This small test system is used to establish the methods of uncertain parameter reduction that must be utilized when applying PCM on bigger networks prior to the application of the PCM with a large test network. 2) Probabilistic assessment of distance to voltage collapse for a section of the U.K. distribution network, in the presence of uncertain measurement errors. In both applications, the PCM accurately produces probabilistic results whilst dramatically reducing the number of full system simulations (and therefore the total computational time) required. II. PCM—THEORETICAL BACKGROUND The PCM can be used to approximate a power system model’s behavior (with respect to changing parameters) from a much
smaller number of simulation runs than is required for more traditional sampling techniques. More fully explained in [19] and [20] and especially in [18], the approximated response is modeled as a polynomial function of the uncertain parameter set as (1) The key aspects of the PCM are: 1) the selection of the function and 2) specifying the points at which to run the full power system simulation to gather the data from which the PCM model is formed. These details are provided briefly but are covered in greater depth in [18]–[20]. A. PCM Model Function Orthogonal polynomials [23] of increasing order are derived for the known probability distributions of each uncertain parameter . The model function is formed as a sum of products of these polynomials (of varying order dependent upon the desired order of the final PCM model), weighted by a set of coefficients . Orthogonal polynomials can be created for any known probability density function (pdf). Normally distributed parameters are simply represented by the transformation (2) where and are the mean and standard deviations of the uncertain parameter and is the first-order orthogonal polynomial of the standard normal distribution . The orthogonal polynomials , where is the polynomial order, are given by the standard Hermite polynomials (shown here up to fifth order) (3) (4) (5) (6) (7) Orthogonal polynomials for other distributions can be found using recursive methods [24], for example with functions available from the orthpol set for MATLAB [25]. B. Selection of Full System Simulation Points As the order of the PCM model increases, so too does the number of possible combinations of the orthogonal polynomials. Therefore, an increased number of coefficients must be deduced. A number of simulations must be run in order to provide points around which to solve the set of coefficients and fit the model as (8) where is a vector of observed system output values and is a matrix with rows formed by the combinations of orthogonal polynomials for each uncertain parameter evaluated at the points resulting in the corresponding system output in . These collocation points are selected by taking inspiration from the Gaussian quadrature technique of estimating integrals
This article has been accepted for inclusion in a future issue of this journal. Content is final as presented, with the exception of pagination. PREECE et al.: PCM FOR POWER SYSTEM DAMPING AND VOLTAGE COLLAPSE STUDIES IN THE PRESENCE OF UNCERTAINTIES
3
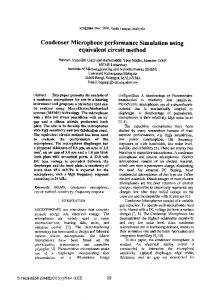
Fig. 2. PSS-based POD controller structure.
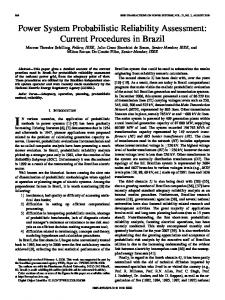
TABLE I NORMAL DISTRIBUTION DETAILS FOR UNCERTAIN PARAMETERS Fig. 1. Four-machine, two-area test system including parallel VSC-HVDC link. Signal for POD controller shown.
[24]. The roots of the next higher order polynomial are chosen as the points at which to perform full simulations and collocation points with the greatest probability of occurring are selected. By doing this, the accuracy of the PCM model is concentrated in the regions defined by the pdfs as most likely to occur. The collocation points required are independent of the system output to be modeled. Therefore only one set of system simulations are required to build the PCM functions for any system output. Different outputs will simply require the calculation of a new set of polynomial coefficients . Once the PCM function is known, it can be used as a computationally inexpensive substitute for running a full simulation of the power system during a standard MC based uncertainty study. It is also possible to extract the pdfs directly from the PCM model functions. However, this requires the inversion of the function, which is not trivial for nonmonotonic multidimensional functions and often the numerical methods would take so long as to negate all of the time benefits associated with using the PCM. III. SMALL-SIGNAL ANALYSIS OF POD CONTROLLER The first application presented in this paper is the use of the PCM to produce the pdf for the damping factor of the critical inter-area mode of a small test transmission network including a VSC-HVDC link. This is completed both with and without a supplementary power oscillation damping (POD) controller installed on the VSC-HVDC link. System analysis and simulations are all performed within the MATLAB/Simulink environment making use of modified MATPOWER [26] functions to perform initial load flows. All times quoted are based upon simulations performed on a PC with 2.66-GHz quad core CPU and 4-GB RAM. A. Test System The test system used is the four-machine, two-area network shown in Fig. 1. All generators are represented by fifth-order models and are controlled with AVRs and PSSs. Power-system loads are modeled as constant impedance, and all relevant details and network parameters are available in [27]. A VSC-HVDC link has been incorporated into the model between the system’s two areas. The VSC-HVDC model details can be found in [28], [29]. Small signal analysis on the system at nominal loading (with the VSC-HVDC link operating at 200 MW) reveals a poorly damped inter area mode with a frequency of 0.59 Hz and a damping factor of 4.2%. All local modes are adequately damped with %. The fast controllability of the
VSC-HVDC link can be exploited to help improve the damping of this critical mode through the use of a supplementary POD controller. 1) POD Controller Design: A simple power-system stabilizer (PSS) design is selected in this study though complex POD controllers have also been demonstrated as being effective with HVDC active power modulation for inter-area mode damping [30]–[33]. The controller takes the standard PSS form shown in Fig. 2 with the input signal selected as the active power flow through a parallel ac line (see Fig. 1). The controller output signal is sent to the VSC-HVDC inverter station controlling active power injection into the ac network. As all signals are assumed to be local, no signal delays are considered. The residue based method [34] is used for tuning of controller. With the PSS-based POD controller installed, the damping factor of the critical inter-area mode is improved to 31.1% with the local modes still adequately damped (with %). 2) Uncertain Network Parameters: In assessing the feasibility of applying the PCM with uncertainty studies on critical modal damping, system generation, loading and VSC-HVDC power transfer are considered to be uncertain values. This constitutes a set of six uncertain parameters given by (9) is the active power output from generator is where the active power demand at load , and is the active power flow through the VSC-HVDC link. Generators are considered as PV buses with constant voltage output and normally distributed active power output. Loads are considered to have constant (nominal) power factor with normally distributed active power demand. The normal distribution parameters are mean equal to nominal loading and standard deviation equal to 20% of mean at ; values are given in Table I. Generator G1 is the slack bus. Power flow through the VSC-HVDC link is considered as unidirectional (from left to right in Fig. 1) and modeled with a uniform probability distribution between 100 and 300 MW. Reactive power injection at both converter stations is regulated at zero. B. Application of the PCM for Damping Studies PCM models were created for the full set of uncertain parameters with the damping factor of the critical inter-area mode as the system output of interest.
This article has been accepted for inclusion in a future issue of this journal. Content is final as presented, with the exception of pagination. 4
IEEE TRANSACTIONS ON POWER SYSTEMS
TABLE II NUMBER OF COEFFICIENTS FOR PCM MODELS USING FULL SET
As discussed in Section II, the normally distributed parameters can utilize the standard Hermite polynomials (3)–(7) via the transformation (2). Monic orthogonal polynomials for the non-Gaussian uniform distribution for have been derived using the orthpol set of functions for MATLAB [25] to produce (10) (11) (12) (13) (14) The number of coefficients to find for the different PCM models produced is shown in Table II. As previously stated, the PCM process is designed to be most accurate for the regions of the parameter pdfs most likely to occur. In previous PCM power systems papers [20]–[22], only one or two uncertain parameters were modeled and the collocation points could be easily selected by hand. This is not practical with larger numbers of uncertain parameters. A fourth-order model with six uncertain parameters has a possible permutations of collocation points. In order to select the most probable sets of collocation points, all possible permutations were generated and then ranked by the joint probability density for the given set. Following this, the list of ordered sets was iterated through until the matrices to solve [see (8)] have sufficient rank to be invertible. 1) Error of the PCM Models: The standard measure of the relative sum-squared-root (RSSR) error can be used to assess the error of the different order PCM models and thus determine which should be selected for use in the uncertainty studies. The RSSR error is defined by
(15) is the predicted value produced by the PCM model, where is the extracted value from simulation for the same set of uncertain parameters, is the total number of points used for error checking, is the joint probability density value for a given set of parameters , and is the set of uncertain parameter mean values (i.e., nominal loading). Values of are calculated using the roots of the next higher order orthogonal polynomial again (i.e., for a fourthorder model, the sixth-order polynomials roots are used) [19].
Fig. 3.
error values for varying PCM model order.
Again, this leads to a vast number of possible collocation point sets, so the 100 most probable sets are used for error checking. values for various PCM models of differing order, with and without the POD controller installed, are shown in Fig. 3. These error values relate to the accuracy of the PCM method when estimating , and do not signify the effectiveness of the designed POD controller. It can be seen that the increase in complexity from third order to fourth order does not significantly improve the accuracy of the PCM model. With no POD controller in place, the value is actually higher for fourth order, however, this will be due to the slight differences in the error checking collocation points used. The fourth-order PCM models provide no significant gain in accuracy and require a greater number of full system simulations to produce. Therefore, third order models will be used for the future studies. It should also be noted from Fig. 3 that, as the system complexity increases (with the introduction of the POD controller), the PCM model error increases. This will be tested more thoroughly through further studies. 2) Demonstrating the PCM Model Accuracy: In order to demonstrate the accuracy of the produced PCM model functions, 10 000 MC simulations have been performed varying the full set of uncertain parameters according to their defined probability distributions. Fig. 4 shows the MC simulation-based results plotted against the results predicted by the third order PCM models for the same set of uncertain parameter values. Perfect accuracy would result in a straight line . Also shown in Fig. 4 are the boundaries for a 95% confidence range on the PCM model predicted value (i.e., 95% of the time, the PCM model is accurate to within ). These limits have been provided in terms of critical mode damping factor values (in %). It can be seen that these linear boundaries are much tighter for the system with no POD controller in place, as expected from the lower value previously determined. 3) Using the PCM Models: The produced models can be used to predict the critical mode damping factor at any distinct operating point. However, the true result at any single operating point could be found from a full system simulation and the PCM model would offer little computational saving. The benefits of using the PCM models are evident when a statistical distribution of the output value is desired, requiring hundreds or thousands of MC runs. In these situations, using the computationally inexpensive PCM function rather than a full power system simulation can provide vast time savings. The probability distributions for shown in Fig. 5 are the result of MC-based uncertainty studies, produced using a kernel
This article has been accepted for inclusion in a future issue of this journal. Content is final as presented, with the exception of pagination. PREECE et al.: PCM FOR POWER SYSTEM DAMPING AND VOLTAGE COLLAPSE STUDIES IN THE PRESENCE OF UNCERTAINTIES
Fig. 4. Plots of simulation-based values against third-order PCM model values with (a) no POD and (b) PSS POD controller in place. predicted
5
From the previously presented studies on errors and accuracy, it would be expected that the closest match between the PCM-based and simulation-based probability distributions for would occur with no POD controller in place. This is what is seen in Fig. 5(a), where the two pdfs almost exactly overlap. The probability of instability, % , can be easily assessed from cumulative probability functions. The PCM-based predicted value is 1.89%, whereas the true simulation-based value is 1.91%, i.e., the difference is just 0.02%. For such a low-probability event, this difference could easily be due to the MC process itself. With the PSS POD controller installed, the two pdfs clearly do not overlap to the same extent as with no POD but still show very good coherency. Interestingly, the regions of lowest damping for the critical mode are reproduced with least discrepancy. These would be the regions of most importance to a power systems engineer who would be far more concerned with knowing whether the damping factor was 1% or 10%, rather than knowing if it is 30% or 40%. The probability of instability % determined in this case was 0.49% with PCM while the true value was 0%. This inconsistency can be explained by examining Fig. 4(b), where it is evident that the PCM model underestimates the damping factor when the true value is low. Therefore, produced PCM model provides a conservative estimate of critical mode damping factor when the true value is low. The POD controller is directly influencing and may, therefore, introduce large nonlinearities with respect to the variation of this damping factor as the uncertain parameters change. It is important to assess the errors that this introduces (as in Fig. 4) in order to ensure full understanding of the results obtained by using the PCM.
Fig. 5. Probability distributions for derived using full simulation and 3rd order PCM models with (a) no POD and (b) PSS-based POD installed.
C. Reduction in Modeled Uncertainties TABLE III TIMES TAKEN TO COMPLETE MC UNCERTAINTY STUDIES
smoothing density estimate [35]. The studies have been performed twice: once utilizing a full power system simulation (including load flow, linearization, modal analysis, and identification of the critical mode and hence ), and once using the third-order PCM models previously developed. This has been completed for the system both without POD [Fig. 5(a)] and with the PSS-based POD controller [Fig. 5(b)]. The varying times taken to perform the different studies are presented in Table III. Not only are the PCM-based MC studies drastically faster, but it can be seen that the majority of the time is consumed whilst creating the model function. This is due to the number of coefficients that must be deduced and therefore the matrix rank that must be achieved during the process of iterating through possible collocation point sets. The PCM considerably reduces the total study time.
The simulation times presented in Table III demonstrate how the PCM can speed up the uncertainty studies and still provide accurate results (especially if the initial error is small). This time reduction would be even more pronounced in largesystem studies with many more system states (the test network in this example has 70 states) where the linearization and modal analysis would be a considerably greater computational burden. However, this would only be true if the PCM models can be produced using significantly fewer simulations than are required during the MC uncertainty study. As the system size, and therefore the number of uncertain system parameters, increases, so too does the number of coefficients. This number can increase rapidly as it is essentially based on the binomial coefficients [36]. The number of coefficients required to produce a PCM model of order for a system with uncertain parameters is given by (16) It is therefore beneficial to keep as small as possible. The method used to minimize the number of modeled uncertain parameters in this study is based on ranking uncertain parameters using eigenvalue sensitivity.
This article has been accepted for inclusion in a future issue of this journal. Content is final as presented, with the exception of pagination. 6
Fig. 6.
IEEE TRANSACTIONS ON POWER SYSTEMS
values for increasing numbers of modeled uncertain parameters.
1) Eigenvalue Sensitivity: The rank index for the sensitivity of mode to uncertain parameter , given by (17) is derived from that provided initially in [37] and suggested, though not implemented, in [20] for use alongside PCM. As the interest here is in the damping of the eigenvalue, the rank index is calculated using only the real part substituted for in (17). The value of the first term (the sensitivity measure) is selected as the maximum rate of change of with respect to across the full range of the uncertain parameter. The second term in (17) weights the sensitivity by the expected variation in the uncertain parameter. Evaluating this expression for each of the uncertain network parameters in the set provides the following ranked order (with highest importance first): . The ranked order is the same both with and without the POD controller, although the individual rank values differ. 2) Uncertain Parameter Reduction: The rank values themselves could be used to try to assess how many parameters should be included in the reduced set of uncertain parameters . However, due to the relatively short time involved in producing PCM models (especially when , and therefore , is small), a simple option is to build models with increasing numbers of modeled parameters until for is tolerably small. This has been completed for the study system using only third-order PCM models. The values with increasing numbers of parameters (both with and without POD) are shown in Fig. 6. Parameter selection is made according to the previously stated ranked order. Also shown in Fig. 6 are the values for the best possible selection of parameters based upon an exhaustive search of all possible combinations. This is included to demonstrate the validity of using the eigenvalue sensitivity rank as a selection tool for parameters. A selection based on rank is often the best possible set of parameters, or very close, in terms of error, and provides a good method of parameter reduction when an exhaustive search is not possible. With no POD controller, the error values consistently reduce until all parameters are modeled. Even with five parameters included, i.e., all but , is still roughly double its final value, suggesting that parameter reduction may not be possible in this case. With the PSS-based POD controller installed, however, the values of level off once four parameters have been included in the set . This implies that using just four parameters should provide similar accu-
Fig. 7. PDFs for
with the reduced and full sets of uncertain parameters.
racy to the full set . This has been assessed by rerunning the MC-based uncertainty study on the test system with the PSS POD controller installed. In this case, the PCM model function was third order but only took the four uncertain parameters, listed above, as inputs. Fig. 7 demonstrates how the reduced set can be used to provide results as accurate as achieved by modeling the full set of system parameters; the two pdfs shown overlap with a very high degree of accuracy. Simply by reducing the number of uncertain parameters modeled from six to four, the number of required coefficients is reduced from 84 to 35. The time reductions are even more striking; the total time taken to produce the PCM model and complete 10 000 MC runs using it is reduced to just 91.8 s compared with the previous 637.1 s. Reduction in the number of modeled parameters has been shown to be an effective method of further improving the time gains offered by using PCM with uncertainty studies. It also provides a means by which the method could be applied to larger power systems as modeling just 20 uncertain parameters with a third order model would result in 1771 coefficients to deduce, quickly negating the time benefits afforded. The small test system presented provides a valuable demonstration of the potential of the PCM method. However, the level of parameter reduction that is possible is much greater within larger power systems (as shown below). The small nature of this test network means that all of the uncertain parameters contribute to the value of (especially when no POD controller is installed). In large power systems, the behavior of particular modes of interest is expected to be dominated by a few key loads and generators within the network. D. Application on a Large Test System The PCM has been applied on a large test system in order to demonstrate the applicability of the techniques outlined above. A PCM model is designed to provide the distribution of the damping factor of the critical system mode in order to probabilistically assess the system stability and need for improved damping from supplementary controllers. 1) Test System Details: The test network used is a modified version of the 16-machine 68-bus reduced-order equivalent model of the New England Test System (NETS) and the New York Power System (NYPS) [38]. Two additional VSC-HVDC links have been installed in the network in order to support power transfer from external areas, as shown in Fig. 8. Full network details (including line details, nominal loading, and generator and controller parameters) can be found in [38], with further explanations of the modifications detailed in [39].
This article has been accepted for inclusion in a future issue of this journal. Content is final as presented, with the exception of pagination. PREECE et al.: PCM FOR POWER SYSTEM DAMPING AND VOLTAGE COLLAPSE STUDIES IN THE PRESENCE OF UNCERTAINTIES
7
Fig. 9. PDFs for with the PCM model using a reduced set of uncertain parameters and the full-simulation-based approach.
Fig. 8. Modified NETS and NYPS network including VSC-HVDC links.
and applicability of the PCM in large system studies with multiple uncertain parameters. IV. PROBABILISTIC DISTANCE TO VOLTAGE COLLAPSE
Key to the post-disturbance performance of this network is the damping of the critical system mode. In this large test system, the critical mode is the lowest frequency inter-area mode, with nominal frequency of 0.41 Hz and damping factor of 4.31%. 2) Uncertain Network Parameters: The system contains 51 uncertain parameters: 15 generators (excluding the slack), two VSC-HVDC links, and 34 loads. The number of simulations required to build first-, second-, third-, and fourth-order PCM models using the full set of uncertain parameters is 52, 1378, 24 804, and 341 055, respectively. It is clear that, unless a firstorder model is sufficient (and the previous work on the small test system suggests it will not be), a reduction in modeled parameters is required. Generators and loads are modeled with normally distributed parameters ( % at around the mean nominal values). VSC-HVDC links have uniformly distributed operating conditions (fully described in [39]). 3) Reduced System Uncertainties: Using eigenvalue sensitivity analysis through ranking using (17) as previously described, the number of modeled parameters was reduced to eight (six generators and two loads). These eight parameters were used to produce the PCM model. 4) Results and Discussion: It was found that a third order model was required in order accurately reproduce the probabilistic distribution of the damping factor of the system’s critical mode (requiring 165 full system simulations). The results obtained from 10 000 MC runs using the full simulation (7 h 36 min) and using the PCM model (8 min including producing the model) are shown in Fig. 9. The PCM model estimated % as zero, which is the same as the value obtained from full simulations. The studies carried out however, showed that % (using the PCM model). This consistently poor critical mode damping factor calls for the assistance of a supplementary POD in order to avoid lingering system oscillations. It is evident from the above case study that the PCM model can be applied to large power systems, using the reduction procedures described, in order to quickly and accurately produce statistical distributions for key system values (such as the damping of critical modes). This demonstrates the feasibility
The PCM was also applied to assess the probabilistic distance to voltage collapse for a section of the U.K. distribution network based on monitor measurement errors. Identifying potential voltage collapse within a network is vital to ensure satisfactory network operation. The voltage stability of a power system is assessed in this study by using homotopy continuation load flow analysis (HCLF) [40], [41]. HCLF analysis enables each of the buses within the test network to be assessed for their proximity to voltage collapse. This proximity is calculated as the increase in load that is permissible at any single bus (assuming that all other loading remains constant) until network voltages collapse [42]. The probabilistic load increase limit (often called but entitled here to avoid confusion) is calculated by including monitor measurement error statistics through state estimation [43]. The aim of this study is to determine the pdf for , i.e., probabilistic distance to collapse, based on measurement errors. This probabilistic distance to collapse is more relevant than purely deterministic values, which may give false information about the proximity to the critical loading point and leave a system vulnerable to voltage collapse. A. Test System The test network used comprises 14 33-kV buses and 10 11-kV buses. The 11-kV busbars are all loaded, and all of the 33-kV busbars are unloaded. Each 11-kV bus is connected to the 33-kV network via a –Y transformer. The network is shown in Fig. 10. Each of the lines in the network was assumed to be balanced and symmetric. Monitors recording active and reactive power demand were installed at each loaded bus within the network. The measurement error is normally distributed with zero mean and standard deviation of 0.2% [44] of the mean value of the measurement. A probabilistic value for for each bus is found by first running system state estimation based on the erroneous system monitor measurements and then performing HCLF based on the calculated system state. This process can be computationally intensive even for relatively small sections of a distribution network. It should be noted that many commercially available packages can provide the distance to voltage collapse. However in order
This article has been accepted for inclusion in a future issue of this journal. Content is final as presented, with the exception of pagination. 8
IEEE TRANSACTIONS ON POWER SYSTEMS
Fig. 11. Probability distributions for derived using MC runs with the full simulation and using the third-order PCM model.
Fig. 10. Network diagram for a section of the U.K. distribution network.
to obtain a statistical distribution for this distance, many simulation runs would be required using a traditional MC approach. The application of PCM offers significant computational time savings in this respect B. Application of the PCM With monitors recording both active and reactive power demand at each of the 10 loaded buses, there are a total of 20 uncertain system parameters due to measurement errors. Modeling the full set of uncertain parameters would require many initial simulations to build the model and so reduction in the number of modeled uncertainties is required. Due to the system loading, two buses (bus 15 and bus 23) have much greater power demands than the others, and thus the reduced set of parameters was simply selected as (18) and are the active and reactive power demand at where bus . A first-order (linear) PCM model function was seen to be suitable for this application, requiring just five full simulation runs. This model has been used to predict the pdf for the load increase limit of bus (the critical bus in the system closest to causing voltage collapse). The monitoring errors incorporated into the state-estimation case study are relatively small and, therefore, a linear model can adequately reproduce the statistical variation in the desired output ( in this study). A higher order model may be required to accurately model the variation in when larger uncertainties in real or reactive power demand are present (for example, when conducting probabilistic load flow), as the relationship between and will be nonlinear. In Section III, the PCM was demonstrated as capable of providing solutions for these higher order problems. C. PCM Model Performance The pdf for produced using the first-order model was compared with the pdf for produced using 1000 MC runs consisting of full state estimation and HCLF. The results in Fig. 11 show that the PCM approach provides a very good estimate of the true pdf, even with the large reduction in the number
of uncertain parameters modeled (from 20 to just four). The value of was calculated as 0.0055 (using the 1000 fullsimulation MC runs). A first-order PCM model is no different to a standard linear regression model, apart from the specification of the collocation points used for full simulations. To show the value in the PCM specification of these points, a number of linear models have been produced using a random selection of simulation points. The number of points used for the randomly selected linear models was kept as five. With a total of 100 new linear models produced, values ranged between 0.0064 and 1.6622, with a median value of 0.0149. The error values are higher in all cases compared with the error obtained with PCM, demonstrating that the collocation point selection technique provides a good basis around which to build the model function. The PCM function reproduces the pdf for with high accuracy. The statistical variation has been captured very accurately, not only for the most probable regions but also for the tails of the distribution. This probabilistic distribution is useful for power system operators as it could provide bounds to guide operational limits incorporating measurement uncertainty. The method provides significant time savings. As previously mentioned, the full process to determine the probabilistic distance to voltage collapse is computationally intensive. Completing just 1000 MC runs on the small section of distribution network with the full process required 23 min 20 s. This was cut to 7.2 s, using the PCM process (0.5% of the original time requirement). V. CONCLUSION The paper clearly demonstrated the potential of PCM to significantly reduce computational time in power system studies with multiple uncertain parameters while providing results that are as accurate as those from full MC simulation. Operational uncertainties have been incorporated in smallsignal analysis to determine the effects of a VSC-HVDC-based POD controller on the damping of a critical inter area oscillatory mode. A method based on eigenvalue sensitivity analysis was used to reduce the number of modeled uncertainties whilst maintaining the accuracy of the results. The effectiveness of this method is of particular importance for large power system studies where minimization of the number of parameters to be modeled is crucial in ensuring the exceptional computational time benefits are preserved. The method has been validated through the application of the PCM on a large power network model, where accurate results were obtained.
This article has been accepted for inclusion in a future issue of this journal. Content is final as presented, with the exception of pagination. PREECE et al.: PCM FOR POWER SYSTEM DAMPING AND VOLTAGE COLLAPSE STUDIES IN THE PRESENCE OF UNCERTAINTIES
The application of PCM to a state estimation based problem to determine the probabilistic distance to voltage collapse resulted in almost identical results, as those obtained with full MC simulation whilst the computational time taken was 200 times shorter. There are some shortcomings of the method as well. It is not possible to produce models based on conditional pdfs between various network parameters as the orthogonal polynomials for each parameter pdf, and therefore the collocation points cannot be initially defined. Also, the applicability of PCM in large power systems may be limited by the extent to which the parameter reduction is possible. This, however, did not prove problematic in the example presented in this paper. ACKNOWLEDGMENT The authors would like to thank B. Ferris, Western Power Distribution, and K, Grant and R. Stanley, E.ON New Build & Technology, for their help and guidance on this project. REFERENCES [1] “Bibliography on the application of probability methods in power system reliability evaluation: 1982–7,” IEEE Trans. Power Syst., vol. 3, no. 4, pp. 1555–1564, Nov. 1988. [2] R. N. Allan, R. Billinton, A. M. Breipohl, and C. H. Grigg, “Bibliography on the application of probability methods in power system reliability evaluation: 1987–1991,” IEEE Trans. Power Syst., vol. 9, no. 1, pp. 41–49, Feb. 1994. [3] R. N. Allan, R. Billinton, and S. H. Lee, “Bibliography on the application of probability methods in power system reliability evaluation 1977–1982,” IEEE Trans. Power App. Syst., vol. PAS-103, no. 12, pp. 275–282, Dec. 1984. [4] R. Billinton, “Bibliography on the application of probability methods in power system reliability evaluation,” IEEE Trans. Power App. Syst., vol. PAS-91, no. 2, pp. 649–660, Mar. 1972. [5] R. Billinton, M. Fotuhi-Firuzabad, and L. Bertling, “Bibliography on the application of probability methods in power system reliability evaluation 1996–1999,” IEEE Trans. Power Syst., vol. 16, no. 4, pp. 595–602, Nov. 2001. [6] R. Billinton and P. R. S. Kuruganty, “A probabilistic index for transient stability,” IEEE Trans. Power App. Syst., vol. PAS-99, no. 1, pp. 195–206, Jan. 1980. [7] P. M. Anderson and A. Bose, “A probabilistic approach to power system stability analysis,” IEEE Trans. Power App. Syst., vol. PAS-102, no. 8, pp. 2430–2439, Aug. 1983. [8] K. J. Timko, A. Bose, and P. M. Anderson, “Monte Carlo simulation of power system stability,” IEEE Trans. Power App. Syst., vol. PAS-102, no. 10, pp. 3453–3459, Oct. 1983. [9] J. L. Rueda, D. G. Colome, and I. Erlich, “Assessment and enhancement of small signal stability considering uncertainties,” IEEE Trans. Power Syst., vol. 24, no. 1, pp. 198–207, Feb. 2009. [10] G. Papaefthymiou and D. Kurowicka, “Using copulas for modeling stochastic dependence in power system uncertainty analysis,” IEEE Trans. Power Syst., vol. 24, no. 1, pp. 40–49, Feb. 2009. [11] Z. Xu, Z. Y. Dong, and P. Zhang, “Probabilistic small signal analysis using Monte Carlo simulation,” in Proc. IEEE Power Eng. Soc. General Meeting, 2005. [12] A. A. Alabduljabbar, J. V. Milanovic, and E. M. Al-Eid, “Low discrepancy sequences based optimization algorithm for tuning PSSs,” in Proc. 10th Int. Conf. Probabilistic Methods Appl. Power Syst., Rincon, Puerto Rico, May 25–29, 2008. [13] V. A. Maslennikov, J. V. Milanovic, and S. M. Ustinov, “Robust ranking of loads by using sensitivity factors and limited number of points from a hyperspace of uncertain parameters,” IEEE Trans. Power Syst., vol. 17, no. 3, pp. 565–570, Aug. 2002. [14] H. Yu, C. Y. Chung, K. P. Wong, H. W. Lee, and J. H. Zhang, “Probabilistic load flow evaluation with hybrid latin hypercube sampling and cholesky decomposition,” IEEE Trans. Power Syst., vol. 24, no. 4, pp. 661–667, Nov. 2009.
9
[15] K. W. Wang, C. Y. Chung, C. T. Tse, and K. M. Tsang, “Improved probabilistic method for power system dynamic stability studies,” Proc. Inst. Electr. Eng.—Gen., Transm. Distrib., vol. 147, pp. 37–43, 2000. [16] C. K. Pans, Z. Y. Dong, P. Zhang, and X. Yin, “Probabilistic analysis of power system small signal stability region,” in Proc. Int. Conf. Control Autom., 2005, pp. 503–509. [17] X. Xialing, L. Tao, and Z. Xiaoming, “Probabilistic analysis of small signal stability of microgrid using point estimate method,” in Proc. Int. Conf. Sustainable Power Gen. Supply, Nanjing, China, Apr. 6–7, 2009. [18] M. A. Tatang, “Direct incorporation of uncertainty in chemical and environmental systems,” Ph.D. dissertation, Dept. Chem. Eng., Mass. Inst. Technol., Cambridge, 1995. [19] M. D. Webster, M. A. Tatang, and G. J. McRae, “Application of probabilistic collocation method for uncertainty analysis of a simple ocean model,” Mass. Inst. Technol., MIT Joint Program on the Science & Policy of Global Change Report Series 4, 1996. [20] J. R. Hockenberry and B. C. Lesieutre, “Evaluation of uncertainty in dynamic simulations of power system models: The probabilistic collocation method,” IEEE Trans. Power Syst., vol. 19, no. 3, pp. 1483–1491, Aug. 2004. [21] D. Han and J. Ma, “Effect of uncertainties in parameters of load model on dynamic stability based on probabilistic collocation method,” in Proc. IEEE Power Tech Conf., Lausanne, Switzerland, 2007, pp. 1100–1104. [22] M. Li, J. Ma, and Z. Y. Dong, “Uncertainty analysis of load models in small signal stability,” in Proc. Int. Conf. Sustainable Power Gen. Supply, Nanjing, China, Apr. 6–7, 2009. [23] P. Beckmann, Orthogonal Polynomials for Engineeers and Physisists. Boulder, CO: Golem, 1973. [24] P. J. Davis and P. Rabinowitz, Methods of Numerical Integration. New York: Academic, 1975. [25] G. Gautschi, “Algorithm 726: ORTHPOL—A package of routines for generating orthogonal polynomials and Gauss-type quadrature rules,” ACM Trans. Math. Software, vol. 20, pp. 21–62, 1994. [26] R. D. Zimmerman, C. E. Murillo-Sanchez, and R. J. Thomas, “MATPOWER’s extensible optimal power flow architecture,” in Proc. IEEE Power & Energy Soc. General Meeting, Calgary, AB, Canada, Jul. 26–29, 2009. [27] P. Kundur, Power System Stability and Control. London, U.K.: McGraw-Hill, 1994. [28] R. Preece and J. V. Milanovic, “Comparison of dynamic performance of meshed networks with different types of HVDC lines,” in Proc. IET ACDC, London, U.K., Oct. 19–21, 2010. [29] R. Preece, A. M. Almutairi, O. Marjanovic, and J. V. Milanovic, “Damping of electromechnical oscillations by VSC-HVDC active power modulation with supplementary WAMS based modal LQG controller,” in Proc. IEEE PES General Meeting, Detroit, MI, Jul. 24–29, 2011. [30] M. R. Banaei and N. Taheri, “HVDC based damping controllers for power system stability,” in Proc. 31st Int. Telecommun. Energy Conf., 2009. [31] J. He, C. Lu, X. Wu, P. Li, and J. Wu, “Design and experiment of wide area HVDC supplementary damping controller considering time delay in China southern power grid,” IET Gen., Transm. & Distrib., vol. 3, pp. 17–25, 2009. [32] Y. Pipelzadeh, B. Chaudhuri, and T. C. Green, “Wide-area power oscillation damping control through HVDC: A case study on Australian equivalent system,” in Proc. IEEE PES General Meeting, Minneapolis, MN, Jul. 25–29, 2010. [33] R. Preece, A. M. Almutairi, O. Marjanovic, and J. V. Milanovic, “Damping of inter-area oscillations using WAMS based supplementary MLQG controller installed at VSC based HVDC line,” in Proc. IEEE PES PowerTech Conf., Trondheim, Norway, Jun. 19–23, 2011. [34] J. V. Milanovic and S. K. Yee, “Roadmap for tuning power system controllers,” in Proc. 3rd IASTED Conf. Power Energy Syst., Marbella, Spain, 2003, pp. 767–774. [35] A. W. Bowman and A. Azzalini, Applied Smoothing Techniques for Data Analysis. New York: Oxford Univ., 1997. [36] D. Fowler, “The binomial coefficient function,” Amer. Math. Monthly, vol. 103, pp. 1–17, 1996. [37] J. V. Milanovic, I. A. Hiskens, and V. A. Maslennikov, “Ranking loads in power systems-comparison of different approaches,” IEEE Trans. Power Syst., vol. 14, no. 2, pp. 614–619, May 1999. [38] G. Rogers, Power System Oscillations. Norwell, MA: Kluwer Academic, 2000.
This article has been accepted for inclusion in a future issue of this journal. Content is final as presented, with the exception of pagination. 10
IEEE TRANSACTIONS ON POWER SYSTEMS
[39] R. Preece, J. V. Milanovic, A. M. Almutairi, and O. Marjanovic, “Probabilistic evaluation of damping controller in networks with multiple VSC-HVDC lines,” IEEE Trans. Power Syst., vol. 99, 2012. [40] K. Iba, H. Suzuki, M. Egawa, and T. Watanabe, “Calculation of critical loading condition with nose curve using homotopy continuation method,” IEEE Trans. Power Syst., vol. 6, no. 2, pp. 584–593, May 1991. [41] V. Ajjarapu, Computational Techniques for Voltage Stability Assessment and Control. New York: Springer, 2006. [42] N. C. Woolley and J. V. Milanovic, “An immune system inspired clustering and classification method to detect critical areas in electrical power networks,” J. Natural Computing, vol. 10, pp. 305–333, 2010. [43] A. Abur and A. G. Exposito, Power System State Estimation. New York: Marcel Dekker, 2004. [44] Siemens, 9610 Power Quality Meter 2011. Robin Preece (S’10) received the B.Eng. degree in electrical and electronic engineering from the University of Manchester, Manchester, U.K., in 2009, where he is currently working towards the Ph.D. degree.
Nick C. Woolley (S’05) received the M.Eng. degree in engineering from the University of Oxford, Oxford, U.K., in 2005. He is currently working toward the Ph.D. degree at The University of Manchester, Manchester, U.K.
Jovica V. Milanović (M’95–SM’98–F’10) received the Dipl.Ing. and M.Sc. degrees from the University of Belgrade, Belgrade, Yugoslavia, the Ph.D. degree from the University of Newcastle, Newcastle, Australia, and the D.Sc. degree from The University of Manchester, Manchester, U.K., all in electrical engineering. Currently, he is a Professor of electrical power engineering and Director of External Affairs with the School of Electrical and Electronic Engineering, University of Manchester, Manchester, U.K., a Visiting Professor with the University of Novi Sad, Novi Sad, Serbia, and a Conjoint Professor with the University of Newcastle, Newcastle, Australia.