Journal of Economic Dynamics & Control 24 (2000) 389}450
The production recipes approach to modeling technological innovation: An application to learning by doing Philip Auerswald!, Stuart Kau!man", JoseH Lobo#, Karl Shell$,* !Department of Economics, Box 353330, University of Washington, Seattle, WA, 98195, USA "BIOS Group LP, 317 Paseo de Peralta, Santa Fe NM 87501, USA #Graduate Field of Regional Science, Cornell University, 108 West Sibley Hall, Ithaca NY 14853, USA $Department of Economics, Cornell University, 402 Uris Hall, Ithaca NY 14853-7601, USA
Abstract We do two things in this paper. First, we put forward some elements of a microeconomic theory of technological evolution. This involves adding nascent (essentially undiscovered) technologies to the existing technologies of neoclassical production theory, and, more importantly, expanding the notion of the production plan to include the recipe } the complete description of the underlying engineering process. Second, we use the recipes approach in constructing a simple microeconomic model of shop-#oor learning by doing. We simulate the dynamics of the model and report the e!ects of changes in the basic parameters on the resulting engineering experience curves. For correctly chosen values of these parameters, the predictions of the model match the observed experience curves. ( 2000 Elsevier Science B.V. All rights reserved. JEL classixcation: D20; D21; D24; D83; L23; O30 Keywords: Engineering experience curves; Learning by doing; Learning curves; Production recipes; Technological evolution
* Corresponding author. Tel.: #1 607 255 5277; fax: #1 607 255 8838; e-mail:
[email protected]. 0165-1889/00/$ - see front matter ( 2000 Elsevier Science B.V. All rights reserved. PII: S 0 1 6 5 - 1 8 8 9 ( 9 8 ) 0 0 0 9 1 - 8
390
P. Auerswald et al. / Journal of Economic Dynamics & Control 24 (2000) 389}450
1. Introduction According to neoclassical theory, a production plan is merely a point in input}output space. The neoclassical theory has been extended to accommodate intertemporal features such as the variability over time of factor supplies, uncertainty about the production process, and uncertainty about prices. The neoclassical theory of production is not, however, fully dynamic since it does not provide a microeconomic basis for explaining technological evolution due to (for example) learning by doing, education and training, research and development, or technology transfer. In this regard, macroeconomics is ahead of its microeconomic foundations. In his celebrated article on learning by doing, Arrow (1962) accounts for the observed fact that unit production costs can fall even in the absence of capital accumulation and R&D e!ort. Arrow attributes the increased productivity to learning by doing on the shop #oor by production workers and managers. Arrow models learning by doing as a positive macroeconomic production externality: increases in &manufacturing experience' } as measured (for example) by cumulative gross investment } lead to increased productivity. Several other macro models of technological progress are based on some production externality. See, for example, Shell (1967), Clemhout and Wan (1970), Stokey (1988), Romer (1990), and Lucas (1993). Another class of (not unrelated) macro models of technological evolution is based on non-conventional factors of production. Uzawa (1965) introduced in a simple growth model human capital, the stock of which can be increased by devoting resources to education. In the hands of Lucas (1988), Caballe and Santos (1993) and others, this human-capital model (with clearly modelled externalities) has become a staple for analyzing productivity growth. Shell (1966, 1967, 1973) and Romer (1986, 1990) introduced into growth theory the macro variable technological knowledge. The Shell}Romer theory combines technological knowledge (or the stock of patents) with production externalities and increasing returns to scale to analyze the role of industrial organization in growth, the dependence of growth on initial conditions, and other important macro problems.1 Macroeconomic models based on production externalities and/or nonconventional inputs have been useful in raising important issues about public policy toward technology and in explaining observed increases in aggregate output, but the inadequacy of the microeconomic foundations of these models is a serious problem for the theory of production. In the present paper, we put forward some key elements of a microeconomic theory of technological
1 See the books by Grossman and Helpman (1991), Ray (1998), Jones (1998), and Aghion and Howitt (1998). See also Solow's (1994) critical survey.
P. Auerswald et al. / Journal of Economic Dynamics & Control 24 (2000) 389}450
391
evolution. To the existing (or currently available) technologies of neoclassical production theory, we add nascent technologies, which include both undiscovered technologies and forgotten technologies.2 The reader might be skeptical about any modeling of undiscovered technologies. While existing technologies can be veri"ed by current engineering practice, undiscovered technologies cannot. On the other hand, practicing production engineers and business managers are not reluctant to base important business decisions on forecasts of technological progress in the "rm's manufacturing operations. In fact, one of the most reliable analytic tools in production management is the engineering experience curve (or learning curve), which projects existing unit production costs for a given product into its future unit production costs. Among production engineers, marketing managers, business executives, and even corporate directors, empirical learning curves are far better known and more frequently used than are empirical production functions or empirical cost functions. The most important new idea in the present paper is in our description of the production plan. To the usual input}output speci"cation, we add a description of the underlying engineering recipe employed. Describing how one recipe is related to another then should allow one to build models that suggest which types of technologies are likely to be uncovered in the course of ordinary shop #oor operations (learning by doing), which R&D programs are most likely to be successful, which types of technologies are ripe for transfer from one "rm (or economy) to another, and so forth. Inspiration for our production recipes approach can be found in Nelson and Phelps (1966) and Nelson and Winter (1982). Inspiration for the nascent technology approach can be found in the separate and distinct works of Shell (1973) and Kau!man (1988). We assume that a production recipe is described by a vector of basic production operations such as heating, mixing, stirring, shaping, boxing, internal factory transportation, and so forth. For given outputs, the input requirements for each of the operations depends on the instruction (or setting) given for that operation and the instructions given for some of the other operations. Hence we allow for production externalities within the "rm.3 These intraxrm production externalities4 are crucial to our analysis. As a speci"c application of our (more general) production recipes approach (along with our nascent technology approach), we construct a simple model of shop-#oor learning by doing. The modeled interrelationships among the recipes (and hence the technologies) are relatively sophisticated. Other aspects of the model are relatively simple. We assume that the "rm employs a single input to
2 Forgotten technologies do not play a role in our application to learning by doing. 3 This "ts with the theory of the "rm in Coase (1937). 4 These intra"rm externalities should not be confused with inter"rm external e!ects, which have been used in macroeconomic models to account for technological evolution.
392
P. Auerswald et al. / Journal of Economic Dynamics & Control 24 (2000) 389}450
produce a single output and that, for a given "xed recipe, this process entails constant returns to scale. We also assume that the "rm's output stream is predetermined. We allow for deviations from the currently reigning technology, but we assume that such production trials (or errors) are not directly controlled by the "rm. We assume that a newly discovered recipe is either accepted or rejected merely on the basis of current cost e$ciency relative to that of the reigning technology. These strong assumptions allow us to employ a variant of Kau!man's NK model5 to analyze the dynamics of manufacturing costs. The NK model was originally designed for analyzing asexual biological evolution. In the evolutionary biology interpretation, it is assumed that the &"tness' of a creature can be represented by a scalar. The corresponding assumptions for learning by doing are the single output, the single input, and constant returns to scale, which together allow the scalar &"tness' to be replaced by the scalar ¤t technological e$ciency' (the inverse of current unit production cost). In the "rst interpretation, it is assumed that genetic changes occur at random and that "tter creatures immediately replace less "t ones. In the present interpretation, the corresponding assumptions are that shop-#oor trials take place at random and that the reigning recipe is replaced by the new recipe if and only if the new recipe is more e$cient in the short run, i.e. recipe selection is myopic. In Section 2, we introduce nascent technologies and production recipes. In Section 3, we use the recipes model to construct a model of learning by doing. In Section 4, we review the existing empirical literature on engineering experience curves. In Section 5, we do the comparative dynamics for the model of learning by doing, and relate the predictions of this model to the observations. By correctly choosing the basic parameters of the model, we are able to match the basic statistics and important qualitative phenomena from observed experience curves } including the mean progress ratios (an inverse measure of the slope of the experience curve) and their standard deviations, plateauing (runs without improvements), curvature bias, and sensitivity to the length of the production run. In Section 6, we provide a summary and our conclusions.
2. Technology 2.1. Neoclassical production theory The neoclassical economic theory of production6 is a reduced-form model of existing technological possibilities. Each "rm is endowed with a technology set
5 See Kau!man and Levin (1987) and Kau!man (1993). 6 See Debreu (1959), Chapter 3, Arrow and Hahn (1971), Chapter 3, and the references to the literature therein.
P. Auerswald et al. / Journal of Economic Dynamics & Control 24 (2000) 389}450
393
Fig. 1. Neoclassical technology.
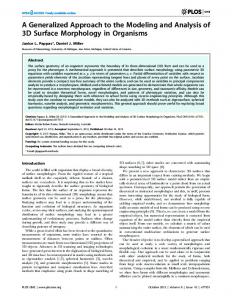
} a set of technologically feasible input}output combinations. These technology sets are assumed to be "xed parameters of the neoclassical economy. A simple example with one input and one output is described in Fig. 1. A neoclassical production plan is a point (x, y) where x50 is the quantity of the input and where y50 is the quantity of the output. The (shaded) set ¹ is the set of all feasible neoclassical production plans. The northwest boundary of ¹ is the production possibility frontier (or PPF). Points on the PPF represent the &e$cient' production plans according to neoclassical theory, since no other plan can be found that gives either more output for the same input or less input for the same output. In this example, the PPF is linear, i.e. production exhibits constant returns to scale. The production function is y"hx, where the positive scalar h is the slope of the PPF. Look at Fig. 1 from the viewpoint of neoclassical production theory. Production plan A is &e$cient'. Production plan B is &ine$cient'. In fact, A strictly &dominates' B: pair A yields more output with less input than pair B. A and B are nearby (or similar) production plans. C is distant from A and B.
394
P. Auerswald et al. / Journal of Economic Dynamics & Control 24 (2000) 389}450
Now look at Fig. 1 from the engineering point of view. Suppose that the engineers tell us that there are only two known processes (Recipes 1 and 2) for producing this output. Recipe 1 supports all pairs (x, y)50 that satisfy y4hx, where h is a positive scalar. Recipe 2 supports all pairs (x, y)50 that satisfy y4h@x, where h@(h is a positive scalar. The production pairs A and C lie on the ray y"hx, while pair B lies on the ray y"h@x (indicated in Fig. 1 by the dashed line). Suppose Recipe 1 is from an engineering viewpoint very di!erent from Recipe 2, even though pair A is close to pair B. Would it ever be rational to produce at B? The answer is yes. Suppose that Recipe 2 is relatively untried. Using Recipe 2 might lead to the discovery of recipes close to 2, but with lower production costs than Recipe 1 (and Recipe 2). A rational case could be made in some circumstances for using only Recipe 2 and in other circumstances for using both Recipe 1 and Recipe 2 simultaneously. According to neoclassical theory, production pairs A and B are close (or similar), while the production pairs A and C are far apart (or dissimilar). But as measured by their recipes, A and B are by assumption far apart (or dissimilar) if Recipe 2 is used for B, while plans A and C must be based on precisely the same recipe, Recipe 1. Furthermore, neoclassical theory does not accurately represent the opportunities facing the production manager. He must jointly choose the recipe and the production plan. Having chosen Recipe 1, only a production pair from the PPF should be chosen. Having chosen Recipe 2, only production pairs from the dashed ray in Fig. 1 should be chosen. All other pairs in ¹ (i.e. those not satisfying y"hx or y"h@x) result from waste of some output or some input when using one or both of the two basic engineering processes. The example above is of single-input, single-output production with constant returns to scale. The case for adopting the recipes approach is even stronger in the presence of multiple inputs, multiple outputs, and/or nonconstant returns to scale. We elaborate on this in Section 6. 2.2. Recipes and technologies: A simple, familiar example A production recipe u is a complete list of engineering instructions for producing given outputs from given inputs. In what follows, we assume that the "rm uses a single input to produce a single output. We also assume that, given the recipe choice, there is no waste in production. We assume that in production run t, the "rm produces y 50 units7 of output by employing g 50 units of t t input (hereafter &labor') based on the recipe u . We assume in this subsection that t there is no uncertainty about the production process. Let l "g /y be unit labor t t t 7 Production engineers often use a precise (but di!erent for each output class) unit of measurement called the &batch'.
P. Auerswald et al. / Journal of Economic Dynamics & Control 24 (2000) 389}450
395
cost. Then we have l "l(y ; u ), where, for "xed u , l is the average cost t t t t function. If l "rst falls and then rises as y is increased, then the average cost t t curve is U-shaped. If l is independent of y , then we have constant returns to t t scale. Our approach to representing technologies is a generalization of the approach taken in several models of technological innovation (and/or imitation) in which there are two types of technologies, advanced and backward (and two types of "rms, also advanced and backward).8 Advanced "rms have access to both the advanced and backward technologies, but backward "rms are restricted to the backward technology. Let u be the advanced recipe and u be ! " the backward recipe. In this literature, the strong non-crossing9 assumption is made, so we have 0(l(y; u )(l(y; u )(#R for each y'0. ! " For the advanced "rm, the set of recipes X is given by ! X "Mu , u N. ! ! " For the backward "rm, the set of recipes, X , is given by " X "Mu N. " " In what follows, we generalize the very simple model of this subsection to allow the "rm to choose not merely from (at most) two recipes, but instead from a (large) general set of recipes, X. We restrict the formal model in what follows to constant returns to scale, so that the unit labor requirement depends only on the recipe employed. Typically, the labor requirement for a given recipe is not known with certainty. Instead there is associated with each recipe u a probability measure over the set of labor requirements. We will also assume } but this is not critical } that there is a (relatively small) subset of recipes, the currently available recipes X LX and that the respective labor requirements for each of t these recipes is known with certainty. 2.3. Engineering operations Production is assumed to involve n distinct engineering operations. The recipe u can then be represented by u"(u1,2, ui,2, un), where ui represents the instructions for operation i for i"1,2, n. We assume that for each operation the set of possible instructions is discrete. These choices
8 See e.g. Shell (1973) and Grossman and Helpman (1991). 9 In the absence of non-crossing, there might not be a most advanced (or a most backward) recipe.
396
P. Auerswald et al. / Journal of Economic Dynamics & Control 24 (2000) 389}450
may be qualitative (e.g., whether to use a conveyor belt or a fork-lift truck for internal transport) or they may be quantitative (e.g., the setting of the temperature knob). In the latter case, the variable being adjusted is approximated by discrete settings (think of the knob clicking from one setting to another). In particular, we assume that ui satis"es ui3M1,2, sN for i"1,2, n, where s is a positive integer. Hence the number of recipes is "nite and given by dX"sn. The "niteness of the set X has serious consequences. A model based on a "nite space of recipes does not permit long-run productivity growth. The model with a "nite set of recipes is, however, quite appropriate for modeling the intermediate term productivity improvements observed in the manufacture of speci"c goods (such as a particular model of the Pentium II processor) over their relatively short product lives (measured in months, years or } at the very most } decades). We assume that the unit labor cost of operation i, /i(u), is a random variable whose distribution function is de"ned on R . Consider two distinct recipes, ` u and u@. The random variables /i(u) and /i(u@) are not necessarily independent. In fact, /i depends on the instructions, ui, for operation i and possibly on (some of) the instructions for the other operations, u~i. (With minor abuse of notation, one could then have denoted the unit labor costs of operation i by /i (ui; u~i), or more simply, /i(u).) We assume that the labor requirements are additive; hence we have n /(u)" + /i(u), i/1 where /(u) is the unit cost of production employing recipe u. For u "xed, /(u) is a random variable. If u is allowed to vary over X, then /(u) is a random xeld. A random "eld is a slight generalization of a stochastic process to allow the argument (in this case u) to be a vector (as opposed to being a scalar such as &time'). For the special case in which n"1, /(u) is then an ordinary stochastic process. We denote by li(u) the realization of the random variable /i(u). The realization of the random variable /(u) is l(u)"+n li(u). If u varies over X, i/1 the family of realizations l(u) is called the landscape (of the random "eld /(u)). A landscape is thus a generalization to the case with n'1 of a &history' (of a stochastic process).10 10 See Durrett (1991), especially Chapter 2. The relationship between random "eld models and models based on realizations of random "elds (i.e. landscape models) is discussed in Stadler and Happel (1995). For previous applications of random "elds and landscape models to economics, see e.g. FoK llmer (1974), Kau!man (1988), and Durlauf (1993).
P. Auerswald et al. / Journal of Economic Dynamics & Control 24 (2000) 389}450
397
2.4. Technological distance and the input requirement xeld We saw in Section 2.1 how the neoclassical notion of technological distance can be misleading. We need a measure of distance that captures the similarity or dissimilarities of the inherent production processes rather than the relative e$ciencies of production pairs or their relative scales. &Distance' between recipes will, of course, depend on the application. If we take a shop-#oor perspective } as we will do in our learning-by-doing application } then u is near u@ if these recipes are the same except for, say, one temperature setting. If moving from u to u@ represents the substitution of #uorine for chlorine where #uorine was not formerly in use, then we would probably think of u and u@ as very far apart in the shop-#oor metric. But for an R&D problem, the appropriate metric might be altogether di!erent. In the chemistry research lab, for example, the distance would in this case be small, since every chemist is aware that the elements chlorine and #uorine are likely to react similarly because they are from the same column of the Periodic Table of the Elements. We assume that the set X can be described so that distances are meaningful from the appropriate technological perspective. Our formal de"nition follows. Dexnition (Distance). The distance d(u, u@) between the recipes u and u@ is the minimum number of operations that must be changed in order to convert u to u@. Since changing operations is symmetric, we have d(u, u@)"d(u@, u). Example. Assume that u and u@ di!er only in the ith component. Then d(u, u@)"1 when we have ui"1 and (ui)@"2 or when we have ui"1 and (ui)@"37. This de"nition of distance makes the most sense when the instructions are merely qualitative. If instead the instructions can be represented by ordinal settings (such as temperature), then the distance notion should be di!erent. If the instructions for operation i in the above example had been temperature settings, then the recipe with its ith entry equal to 2 would be closer to u than the recipe with its ith entry equal to 37. In particular, 23C is closer to 13C than is 373C. If settings are ordered, then a wise strategy for the "rm, might be (if possible) to change the setting in the same direction that led to the most recent improvement. If 23C is an improvement over 13C, perhaps } if possible } the next trial should be 33C. Introduction of ordinal settings and more complicated distance measures could very well make the model more interesting. We leave this for future research. Dexnition (Neighbors). Let N (u) be the set of d-neighbors of recipe u, d N (u)"Mu@3X D d(u , u@)"dN, d
398
P. Auerswald et al. / Journal of Economic Dynamics & Control 24 (2000) 389}450
where d is a positive integer. Then N I (u), de"ned by d
G
H
N I (u)" u@3X D u@3 Z N (u) , i d i/1,2,d is the set of recipes at least distance 1 from u but not more than distance d3M1,2, nN from u. With our de"nition of distance between recipes, it is straightforward to construct the technological graph C. The nodes (or vertices) of C are the recipes. The edges of C connect a given recipe to recipes distance 1 away, i.e. to the elements of N (u). 1 We next de"ne the input requirement "eld, which is a full description of all the basic technological possibilities facing the "rm. Dexnition (IRF). The input requirement xeld (IRF) is the random "eld /(u) (de"ned over the vertices of the technological graph C.) In order to derive concrete results, we must further specify the IRF. In the next subsection, we specify the relationship between the random variables /(u) and /(u@), which in general are not independent. After that, we specify the functional forms for the /i(u). This speci"es11 the IRF, but it does not &close the model'. To do that, we will need a complete theory of which recipes are chosen for production and what is learned by the "rm from its experience. 2.5. Intraxrm externalities Typically, there will be some external economies and diseconomies among the operations. Indeed, a central role of the "rm is to internalize these externalities.12 In the current paper, we do not analyze inter-"rm external economies. For this reason it has been suggested13 that what we are analyzing here should be called intranalities rather than externalities. There is no obvious, direct connection with the externalities in the present paper and those that underlie several of the basic macro models14 of technological evolution.15
11 Except for some of the underlying stochastic structure, which is speci"ed in Section 5. 12 See Coase (1937) and Williamson (1985). 13 In a remark from Tim Sorenson. 14 E.g., Arrow (1962), Shell (1973), Lucas (1988), and Romer (1990). 15 In conversations with us, Henry Wan has also stressed the importance of not confusing the reader with these very di!erent uses of the term &externality'.
P. Auerswald et al. / Journal of Economic Dynamics & Control 24 (2000) 389}450
399
We assume that the costs of a given operation depend on the chosen instructions for that operation and possibly on the instructions for some (but not necessarily all) of the other operations. De"ne the connectivity indicator ei by j 1 if the choice of setting for operation i affects ei " the labor requirement for operation j, j 0 otherwise
G
for i, j"1,2, n. Since the choice of the setting for the ith operation always a!ects the costs for the ith operation, we have ei"1 i for i"1,2, n. The number ei of operations with costs a!ected by operation i is given by n ei" + ei j j/1 for i"1,2, n, while the number e of operations that a!ect the costs of i operation i is given by n e " + ej i i j/1 for i"1,2, n. De"ne E , the set of operations cost-relevant to operation i, by i E "M j3M1,2, nN D ej"1N i i for i"1,2, n. We make the simplifying assumption that each operation is cost-a!ected by (e!1) other operations, so that we have dE "e "e i i for i"1,2, n, where e3M1,2, nN.16 Under this assumption, the labor requirement of any given operation is a!ected by the instructions for that operation and the instructions for exactly (e!1) other operations. Therefore, there are exactly se permutations of the instructions that a!ect the costs of operation i. We refer to one of these as a subrecipe cost-relevant to operation i. Let Mi ,2, i N denote the elements in the set E "M j D ej"1N for i"1,2, n. i 1 e i Then denote by (ui1,2, uie) a subrecipe cost-relevant to operation i (where for convenience we de"ne i to be equal to i) for i"1,2, n. The set of 1 16 In the application of this model to learning by doing, the parameter n is directly analogous to N, and the parameter e is directly analogous to K#1 of the NK model. See Kau!man (1993), Chapters 2 and 3).
400
P. Auerswald et al. / Journal of Economic Dynamics & Control 24 (2000) 389}450
subrecipes cost-relevant to operation i is a projection of the sn recipes into se subrecipes. There are nse such subrecipes in all. The stochastic unit labor requirement for operation i based on the subrecipe (ui1,2, uie)"uie can be written as /i(ui1,2, uie) or /i(uie) for i"1,2, n, with only slight abuse of notation. The parameter e } while not necessary in a general recipes model } plays a crucial role in our present analysis. If e"1, there are no (intra"rm) external e!ects among the operations. Each of the operations could also have taken place in separate "rms, since in this case there can be no gains from coordination. With e"1, we would also expect the two random variables /(u) and /(u@) to be highly correlated if u@ is close to u, since by de"nition u@ and u would have many instructions in common and hence /i(u)"/i(u@) for most i. The larger the parameter e, the less correlation one would be expect between /(u@) and /(u) even for u@ close to u. This is because the change in the instructions for one operation a!ects the costs of several other operations. Hence e is an inverse measure of the correlation between /(u@) and /(u) for u@ close to u. The corresponding landscape l(u) (a realization of the IRF) is typically &correlated', or &smooth', for small values of e, while l(u) is typically &uncorrelated', or &rugged', for large values of e. We now turn to our concrete application.
3. Learning-by-doing 3.1. Introduction Our goal is to use our recipes approach to provide a microeconomic foundation for observed learning by doing in production. In particular, we specify our complete model of production (the IRF) (which includes inputs, outputs, and recipes; and current technologies and nascent technologies) and then &close' it in an attempt to model shop-#oor productivity improvements and hence to explain the observed empirical features of the "rm's experience curve. We have three reasons for doing this: f The learning-by-doing model is important in its own right for economic theory and economic policy. It would be worthwhile to understand the micro sources of the productivity increases and what promotes them, rather than merely representing this process as a "xed macroeconomic externality. f Empirical experience-curve analysis is central to management science and management practice. It would be desirable if these experience curves could be explained in terms of basic microeconomics.
P. Auerswald et al. / Journal of Economic Dynamics & Control 24 (2000) 389}450
401
f Our theory of production recipes (and nascent technologies) is meant to be quite general, with possible applications for modeling R&D, basic research, and technology transfer. Before going forward, such a general theory should be tested by at least one concrete application. There are three reasons why learning by doing is a good candidate for this application: f C Empirical studies of engineering experience curves are abundant. f C Learning-by-doing permits us to be relatively less sophisticated in modeling the purposiveness of the economic agents, so that we can focus } for now } on our relatively sophisticated model of technology. f C The one input/one output learning-by-doing model allows us to use } with only minor modi"cations } a tested computer simulation program.17 3.2. &Trials' in the production process We assume that shop-#oor workers follow the recipe (or blueprint) provided by management, but from time to time, they make small modi"cations in the current recipe. We refer to these modi"cations as trials. Depending on the context or the interpretation, the trials may also be thought of as errors or informal experiments. A trial occurs when (1) at least one operation in the production recipe is modi"ed and (2) that modi"cation is observed and it is evaluated by the "rm (perhaps by the quality-control engineers). We assume that modi"cations occur during the production of a batch, and that observation and evaluation occur when the production of the batch is completed. We further assume that there is only one trial per quality-control batch. This assumption is not restrictive: since the quality-control batch size, B, may or may not equal the measured batch size, BK , used in data gathering. We introduce the batch deyator, q, de"ned by q"BK /B, where B is de"ned so that exactly one trial is made during the production of the quality-control batch. If q is a positive integer, then it is interpreted as the number of trials per measured batch. In general, q3R is interpreted as `` the average number of trials per measured batch. We have ql1 as BK mB. One would expect q to depend on the particular type of manufactured good. The trials parameter q is likely to be larger for airframes than for steel bars, because the production of an airframe is more complex than the production of
17 See Section 5.1 for a detailed description of the software and the hardware we employ.
402
P. Auerswald et al. / Journal of Economic Dynamics & Control 24 (2000) 389}450
a batch of steel bars. The trials parameter, q, also depends on management practices, corporate culture, and worker psychology. In a tight production environment, there would be fewer defects, but fewer trials. In a looser production environment, there would be more defects, but also more trials. Hence management is likely to be keen to attempt to control q if possible to achieve an optimal balance between &sloppiness' and &inventiveness'. A trial can be interpreted in at least three (non-exclusive) ways. The "rst interpretation is that the trial is a small-scale experiment in production to which the "rm does not fully commit. This would be a model of R&D in which the only cost of the R&D activity is the missed opportunity for investigating alternative recipes during the period in question. A natural alternative is to assume that the "rm must commit to the new production recipe in order to sample it: If recipe u is chosen during the t production run t, then the labor requirement for run t will be the realization of /(u ). In this case, unit costs may actually increase from one period to the next, t i.e. cost retrogressions could occur. A third interpretation is possible. We can think of the "rm operating a large number of distinct production sub-units in parallel. Each sub-unit begins a production run at time t with an assumed labor requirement l(u ), the unit t~1 cost for run t!1. During the course of production run t, a trial in one production sub-unit leads to production by its sub-unit using recipe u@. The associated labor requirement for this production sub-unit is then l(u@), the realization of /(u@). However, because there are many production subunits, the average per-batch cost of production is close to l(u ), the unit t~1 cost of the (pre-trial) reigning recipe. Consequently, in this scenario, we can think of "rms trying new recipes, without substantial sacri"ces in current labor requirements. We choose this third interpretation, over the second, because it allows our simulations to be based on our existing, tested computer program.18 Next we will further specify the trial dynamics for the "rm. 3.3. Trial dynamics Production trials occur on the shop #oor level at the rate of 1 per quality control batch B (or q per measured batch BK ). We assume that the trial recipe is at distance of at least one but no greater than d3M1, 2,2, nN from the currently adopted recipe u. We assume that the probability of a trial is uniform over the
18 Actually, the simulation program was adapted to permit retrogressions, but we did not experiment su$ciently with this feature to report on it here. It seems to us that the analysis of retrogressions is well worth doing } both for learning by doing and for evolutionary biology.
P. Auerswald et al. / Journal of Economic Dynamics & Control 24 (2000) 389}450
403
neighborhood N I (u).19 That is, the extent of modi"cation of existing recipes is d limited to recipes that di!er from the currently prevailing recipe by no more than qd operations } the number of trials per production run multiplied by the number of operations of the recipe that can be altered in a single trial. The recipe adoption process is very simple. The "rm is myopic: if u is the t~1 prevailing recipe and u@ is the trial recipe, then the prevailing technology for t~1 period t, u , will be given by t u if l(u )4l(u@ ), t~1 t~1 u " t~1 t if l(u )'l(u@ ), u@ t~1 t~1 t~1 where (1)
G
G
1/dN I (u ) d t~1 ProbMu@ "uN" t~1 0
for u3N I (u ), d t~1 for u N N I (u ) d t~1
for t"1, 2,2. System 1 de"nes the cost-reduction dynamics. (This is a process in which the "rm moves from vertex to vertex of the technological graph C that underlies the IRF. If d"1, then the "rm moves along the edges of the graph C to the next vertex.) 3.4. Current and nascent recipes For the nascent subrecipes, we assume that the random variables /i(uie) are i.i.d. and uniform on [0, 1/n]. Hence if all the relevant subrecipes of u are nascent, then the support of /(u) is [0, 1]. If n'1, the density function of /(u) is then W-shaped and symmetric about 1, the modal labor requirement.20 If uie is 2 currently available, then /i(uie) is a degenerate random value, in which all of the probability is massed on a scalar li(u)3[0, 1/n]. If u is currently available, then /(u) is a degenerate random variable, in which all of the probability is massed on a scalar l(u)3[0, 1]. If m of the subrecipes of the recipe u are nascent (while the remaining n!m subrecipes are currently available), then the support of /(u) is [l, l#(m/n)], where l is a scalar in [0, (n!m)/n]. On the interval [l, l#(m/n)], the p.d.f. is W-shaped and symmetric if m'1.21
19 The probability distribution of trials could be di!erent. For example, a scheme that loads more probability on the recipes closer to u might be more realistic. It would not be di$cult to alter our t~1 computer program to accomodate this. We conjecture that the quantitative e!ect of this change would be to reduce the big-step e!ect for any given d, but that the qualitative e!ects would not be altered. 20 If n"2, then the p.d.f. is a tent with an altitude of 2. 21 If m"2, then the p.d.f. is a tent on [l, l#(m/n)].
404
P. Auerswald et al. / Journal of Economic Dynamics & Control 24 (2000) 389}450
The assumption that the support of /(u) is contained in [0,1] is not innocuous. The fact that a zero labor requirement is possible could in principle be disturbing, but we do assume that the probability of such a free lunch is zero. The assumed boundedness of unit cost is more serious. In actuality, many untried recipes turn out to be totally useless, i.e. with the realization l(u)"#R. The assumption of boundedness from above of unit labor requirements is an unrealistically optimistic assumption about prior beliefs about untried recipes. Before reporting the results of our computations, we turn to a review of the existing literature on engineering experience curves.
4. Engineering experience curves 4.1. Introduction In this section, we formally describe experience curves and review the (largely empirical) literature on them. This goes beyond mere motivation: we use the statistical outputs of the existing studies as inputs for our work. We don't redo the existing experience curve analyses (even though this might have been worthwhile); we use instead the calculated regression coe$cients and their standard errors as our observations. Few empirical phenomena in production economics or management science are as well documented as the experience curve. It depicts the decline in the "rm's per-unit labor requirement (or cost) with the cumulative production of a given manufactured good. Following Wright's (1936) study of the airframe industry, this pattern has been investigated for many di!erent goods and industries. The usual parametric form of the experience curve is the power curve, l "a>~b , t~1 t
(2)
where l is the unit labor requirement for production run t,> "+t~1 y , is t t~1 s/1 s the cumulative output up to (but not including) run t,22 b'0 is the learning coezcient, and a'0 is the labor needed to produce the "rst batch of the good. The learning coe$cient represents the rate at which productivity increases as the "rm acquires &experience'.
22 In the case of airframes, one airframe is equal to one measured batch. In this case, > is the serial t number of the last airframe in production run t.
P. Auerswald et al. / Journal of Economic Dynamics & Control 24 (2000) 389}450
405
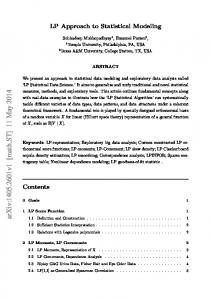
Fig. 2. A histogram of estimated "rm progress ratios from Dutton and Thomas (1984).
4.2. Progress ratios A commonly used measure of productivity improvement is the progress ratio. The progress ratio p is related to the learning coe$cient b by p"2~b or b"!log p. 2 The percentage cost reduction when cumulative output is doubled is (1!p). If b"1 (&Wright's Law'), then we have p"79%. If b"0.30, then we have 3 p"81% (see the mode in Fig. 2). Somewhat perversely, a small progress ratio is an indicator of rapid cost improvement, while a higher progress ratio indicates less cost improvement. A p value of 79% means that per-unit cost falls by 21% when cumulative output is doubled. A p value of 81% means per-unit cost falls by 19% when cumulative output is doubled. A p value of 100% means that per-unit cost is constant. A p value greater than 100% means that unit cost is increasing. The power law given in Eq. (2) yields the straight line in log/log space log l "log a!b log > , t t~1
406
P. Auerswald et al. / Journal of Economic Dynamics & Control 24 (2000) 389}450
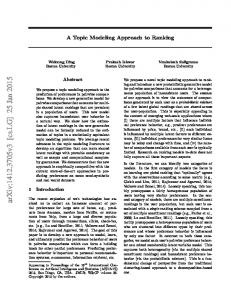
where l is the average unit labor requirement (or cost) of producing the goods t with serial numbers greater than > but less than or equal to > . t~1 t 4.3. Summary of empirical xndings In Table 1, we display some observed estimates of the learning coe$cients and the progress ratios from "rm-level experience curves (by industry). From this and the review articles by Conley (1970), Yelle (1979), Dutton and Thomas (1984), Muth (1986), and Argote and Epple (1990), we conclude that the salient characteristics of experience curves are: f The distribution of progress ratios ranges from 55% (rapid progress) to 105% (slow } indeed negative! } progress) and ¢ers' on about 81}82%. See Table 1 and Fig. 2. f Distinct production processes and goods are associated with their own ranges of values for the estimated progress ratio p( . See Table 1. f There is variation in progress ratios not only among "rms in the same industry, but also among di!erent plants operated by a single "rm. See Alchian (1963), Dutton and Thomas (1984), (pp.236}239), and Epple et al. (1991). f The speci"cation of the OLS least-squares statistical model, l "a>~b e with t~1 t t log e &N(0,p), is imperfect in (at least) two ways: t f C There are &plateau ewects' in the observed data:23 (1) Improvements occur after relatively long stretches of constant labor requirements, and (2) improvements in labor productivity cease beyond some (su$ciently large) cumulative output.24 The (hypothetical) empirical experience curve of Fig. 3 illustrates both types of plateauing: the labor requirement l is falling from t"0 to t"10, but not strictly monotonically. There is an interior plateau at batches 3}5. Productivity improvements cease after batch 7, providing a terminal plateau. f C There is curvature misspecixcation.25 Instead of a straight line in log/log space, the data suggest that an S-shaped curve would often (but not always) "t better: often the data suggest concavity of the function over the early batches, but convexity of the function over the later batches. We call this the SFS phenomenon } cost improvement is "rst Slower, then Faster, and "nally Slower than suggested by the straight-line log/log "t. See Fig. 4. (In many observed production runs and many of our experiments, the
23 See Abernathy and Wayne (1974). 24 See Conway and Schultz (1959) and Balo! (1971). 25 See Levhari and Sheshinski (1973) and Epple et al. (1991), (pp. 65}69).
P. Auerswald et al. / Journal of Economic Dynamics & Control 24 (2000) 389}450
407
right-hand tail of the productivity plot is truncated before the suggested convex range of the function can be observed.) f Industry experience curves (in which the data on cost as a function of cumulative output is averaged over several "rms) are smoother than the corresponding single-"rm experience curves, which in turn are smoother than single-plant experience curves: there are fewer plateaus and the lengths of the interior plateaus are shorter for the averaged data. See the survey by Dutton and Thomas (1984).
Table 1 Estimated progress ratios p( (and the corresponding learning coe$cients bK ) for a variety of industries Industry
p( (%)
bK
d obs
Method
Cost measure
Source
Aircraft production!
71
0.50
112
2SLS
Labor hours"
Apparel!
78#
0.41#
33(3)
OLS
Labor hours$
Automobile assembly% Chemical processing& Musical instruments! Semiconductors&
84#
0.26#
17(3)
OLS
Labor hours"
77
0.38
300
ML
Price'
83#
0.29#
82(6)
OLS
Labor hours"
76#
0.41#
127(9)
OLS
Semiconductors&
80#
0.32#
257
OLS
Average revenue) Price'
Truck Assembly!
90
0.15
99
OLS
Labor hours"
Benkard (1998), Table 1 Balo! (1971), Table 2 Balo! (1971), Table 3 Lieberman (1987), Table 6 Balo! (1971), Table 7 Webbink (1977), Table III-2 Irwin and Klenow (1994), Table 1 Epple et al. (1991), Table 1
The entry in the dobs column is the number of di!erent production observations in the learning curve. Where averaged coe$cients are reported, it is the total number of observations in the study (and the number of parallel equations estimated is given in parentheses). All estimated coe$cients are reported in the sources as signi"cant (better than 5% con"dence). !Single plant, single product learning curve. "Direct labor hours per unit of output. #Average of more than one estimated coe$cient value. $Direct labor burden per unit. See Balo! (1971), p. 334 for description. %Single "rm, multiple plant, multiple product learning curve. &Industry aggregate learning curve, single product type. 'Price per unit of output. )Average revenue per unit output.
408
P. Auerswald et al. / Journal of Economic Dynamics & Control 24 (2000) 389}450
Fig. 3. Hypothetical illustration of the phenomenon of `plateauinga.
In the following section, we analyze the comparative dynamics of our model of shop-#oor learning by doing. In particular, we report the e!ects of varying the following basic parameters of the model: f f f f f f
n, the number of operations s, the number of instructions per operation e, the externality parameter d, the maximum number of steps per trial q, the number of trials per measured batch ¹, the length of the production run
on the two basic predictions of the model: f p6 , the sample mean of the estimated progress ratios f s , the sample standard deviation of the estimated progress ratios 1
P. Auerswald et al. / Journal of Economic Dynamics & Control 24 (2000) 389}450
409
Fig. 4. Hypothetical illustration of the SFS (Slow Fast Slow) misspeci"cation.
and on two measures of model misspecixcation: f plateauing (or its inverse, the improvement percentage z) f curvature (or SFS) in log/log space. The basic parameters of the model are summarized in Table 2. The third column gives the range over which each parameter is de"ned. Noninteger values of q would have been possible. The interpretation of (say) q"1 is 3 that a trial occurs once in every three production runs. Our computations involving the fractional q and other noninteger values of q were not comprehensive, so we are not reporting these experiments. This deserves further study.
410
P. Auerswald et al. / Journal of Economic Dynamics & Control 24 (2000) 389}450 Table 2 Summary of parameters Parameter
Description
Range
n
Number of operations per recipe Number of instructions per operation Number of intra"rm externalities per operation (Quality-control) batch size Number of trials per measured batch BK Number of operations altered per trial Length of the production run
Positive integers
s e B q d ¹
Positive integers M1,2, nN 1 Positive integers M1,2, nN Positive integers
5. Computation 5.1. Hardware, software, and strategy We performed our computations26 on a Dell Dimension XPS Pro 200 PC with a Pentium Pro 200 MHz processor running Windows 95 (ver.4.00.950 B). The core program used in our simulations was written by Bennett Levitan, building on work by William Macready and Terry Jones. We performed our regressions, computed the summary statistics, and generated the plots with SPSS Windows ver. 7.5 and Matlab Windows ver. 4.0. Additional routines used to compute and generate the simulations from the random parameter set (described in Section 5.8) were written by Auerswald. Both Levitan's and Auerswald's programs incorporate a random number generator written by Terry Jones, based on the algorithm of Knuth (1981), pp. 171}172. The programs of Levitan, Jones, and Auerswald are written in C; they are available to interested researchers. Our most fundamental unit of analysis is a single realization of the production run, examples of which are displayed in Figs. 5}8. Each production run is then a &walk' (i.e. an instance of the dynamics described in Section 3.3) on a landscape (i.e. a realization l(u) of the IRF /(u) described in Section 2). In Figs. 5}8, the
26 See the survey by Bona and Santos (1997) for standards in reporting the results of computational experiments.
P. Auerswald et al. / Journal of Economic Dynamics & Control 24 (2000) 389}450
411
log of time } or, equivalently, the log of the cumulated number of batches to date } is on the horizontal axis, while the normalized log of the unit labor requirement for the currently prevailing technology is on the vertical axis. Each &point' in one of these "gures is a &step' in the &walk'. The line in one of these "gures is the OLS linear "t to the points in that "gure. Computation of a single production run took between 5 seconds and 5 minutes. Computational time was increasing in n, s, and ¹. For every chosen parameter vector, we computed a set of 20 experience curves. This required between a minute and 2 hours for each chosen parameter vector. Because of the large number of production runs, we do not report here the random seeds, but they are available to interested researchers. 5.2. Detailed description of the model and computation We have yet to completely de"ne the externality connections from one operation in a given recipe to other operations in that recipe. If we had some engineering information about these connections we might want to use this prior information. In the absence of engineering priors, we draw for each production run the (e!1) connections to operation i uniformly (without replacement) from the set of all operations other than i. We now have completely de"ned the landscape l(u) and the method of &walking' on this landscape. All that remains to be speci"ed is the starting point (on the landscape) for the walk. For some applications, the starting point might be given by information about the production experience of competitors or suggestions from the "rm's R&D department. In the absence of such prior information, we merely pick randomly one recipe (with uniform probabilities over the sn recipes) to be the starting point. We re-normalize the log27 of the labor requirement so that the adjusted log of the initial unit labor requirement is 1.0. Here the relationship between the labor requirement l and the adjusted log labor requirement is given by adjusted log labor requirement"1#log l. The adjusted log labor requirement is negative for l(0.36787. Negative values of this convenient measure should cause no problems (though it would be economic nonsense if unadjusted l were to be negative). It is typically impractical or infeasible to compute the entire landscape of sn realized labor requirements (even if we use the fact that there are only nse subrecipes). A better approach is to compute &on the #y' the realized labor requirements for a given walk on the landscape. Our program calculates realized
27 Unless otherwise indicated, &log' denotes &the natural logarithm of '.
412
P. Auerswald et al. / Journal of Economic Dynamics & Control 24 (2000) 389}450
values on the #y after "rst calculating some random number generator seeds28 and then calling the random-number generator at each step in the walk to compute the realized labor requirement for the trial recipe, u@ . t~1 5.3. Summary data from a single production run For each realization of a single production run, the estimated progress ratio p( is given by p( "2~bK , where bK is the OLS estimate of the learning parameter b, i.e. bK is the absolute value of the slope of the regression line. If q"1, then the labor requirement at t, l , and cumulative output upto t,> , correspond to t t~1 what is used for estimating bK and p( in the existing studies on experience curves. If qO1, then > will not be equal to the cumulative number of trials that de"ne time in our model. The relationship between t (cumulative number of trials), > (cumulative output), and q (number of trials per measured batch) is29 q"t/>. In computational terms, if ¹ is "xed, then increasing q decreases the number of simulated points. Trials take place and labor requirements are modi"ed at each date t, but not all modi"cations are recorded. For example, with q"20 (and B"1 as assumed), calculation of the per-unit labor requirement would not occur until after the 20th unit was produced, and not again until the 40th unit, and so on. Under the assumption of ¹"1000 and q"1, we observed 1000 data points in a given simulated experience curve, but with q"20 we would observe only 50 data points. Another quantity that can be used in measuring cumulative increases in productivity is l , the labor requirement after ¹ trials (or the xnal labor T requirement, for short). Our focus is on the path of productivity increases, not on the initial labor requirement, so we normalize the initial labor requirement l by 0 l "1. The "nal labor requirement l is usually (but not always!) inversely 0 T related to bK : usually, the lower the "nal labor requirement the steeper is the experience curve. If there were no speci"cation error of the experience curve, this would always be the case and l would be an uninteresting statistic. However, if T there were huge productivity increases in the "rst few periods after which the labor requirements asymptote, for ¹ large bK would then be small because OLS would heavily weight the asymptote. In this case, the fact that l is small T 28 Before each walk, the program draws two vectors of seeds for the random number generator, one of length n and the other of length e. These two vectors of seeds, combined with the local characteristics of a subrecipe, are su$cient to de"ne unique and consistent values for all subrecipes in the landscape. In this manner, we trade o! some computational speed for e$ciency in storage. Further information is available in the &comments' within the computer code (which is available to interested researchers upon request). 29 In general, > is the appropriate measure of &economic time' for a given production run. If q"1, &calendar time' t and &economic time' > are the same. Otherwise, t must be adjusted to measure economic time.
P. Auerswald et al. / Journal of Economic Dynamics & Control 24 (2000) 389}450
413
indicates that the estimated learning coe$cient bK (and hence the estimated progress ratio p( ) might be misleading. In order to capture the extent of plateauing, we compute an (inverse) statistic z, the improvements percentage per measured batch, de"ned by q]number of observed improvements z" . ¹ We prefer z to direct measures of plateauing (e.g. average plateau length) because it is less sensitive to the distortions caused by the presence of a long "nal plateau. For experience curve analysis, the transient is of greater interest than the steady state, since in most real-world cases, the rate of product replacement (due to, say, a new, superior product) is rapid relative to the exhaustion of productivity improvements for the original product. We weight the total number improvements observed by q/¹ so that the measure will re#ect, not the absolute number of improvements found, but rather the likelihood that a new observation will be a productivity improvement. Finally, in order to measure the extent of curvature misspeci"cation in the experience curve data, we estimate a second quadratic speci"cation of the learning model: log l "a #b log > #c log >2 #e , t~1 t t 2 2 t~1 2 where l is the labor requirement after cumulative production of > units. The t t~1 magnitude, sign and level of signi"cance for c( , the estimate of c , gives one 2 2 indication of the extent of curvature misspeci"cation in the standard log}log model. A negative and signi"cant c( would suggest that the log}log form 2 overstates the rate of early relative to later productivity improvements. This is not a test of the full SFS e!ect. A negative value of c( suggests the observed run 2 exhibits SF ("rst slow and then fast). Often the second S of SFS is outside the observed or calculated production run. 5.4. Single experience curves: A look at the xgures Fig. 5 represents a single experience curve for the base parameter vector: n"100, s"10, e"5, q"1, d"1, ¹"1000. These parameters were chosen to be reasonable for the current exercise. Our experience in choosing these parameters came from comparisons and contrasts with the literature on evolutionary biology, introspection about typical production processes, and mostly comparisons of the results of some preliminary experiments with the existing empirical literature. Our priors about the validity of these parameters were not very strong. Hence we sampled widely in the space of parameters, but in many of our experiments (173 experiments out of 423) we sampled the parameter space
414
P. Auerswald et al. / Journal of Economic Dynamics & Control 24 (2000) 389}450
Fig. 5. Base parameter experience curve.
by moving only one parameter at a time while holding the others at one of its base values. This is a particular type of sensitivity analysis. In Fig. 5, the landscape is not perfectly smooth since we have e"5'1. Plateauing is also evident throughout the production run. This is con"rmed by the small value of z: only 6.2% of the trials lead to improvements in productivity. Overall productivity increase is moderate; this is con"rmed by the estimated progress ratio of 87.5%. There also seems to be a positive SFS (curvature) e!ect, but it is not strong. In Fig. 6, two changes have been made in the parameters to set e"1 and n"1000, so that the landscape is now as smooth as possible (because e"1) and because single-step improvement is likely to be small (because n is large and e"1). With the smooth landscape, plateauing (except for terminal plateauing) is so reduced that it cannot be detected in eyeballing the "gure. This is con"rmed by the value of z: 42.3% of the trials result in
P. Auerswald et al. / Journal of Economic Dynamics & Control 24 (2000) 389}450
415
Fig. 6. Walk on a smooth landscape.
productivity improvements. The estimated progress ratio of 94.6% indicates a relatively slow rate of productivity improvement, but p( is upward biased because of the SFS e!ect, which seems to be more pronounced. (One must be careful, however, not to visually overweight the sparse plot in log units for the early periods (relative to the later periods) in evaluating the SFS e!ect; the later data points are more crowded together than the early data points.) If the quadratic model were "tted to the plot in Fig. 6, we would expect c( to be 2 signi"cantly negative, since the plot suggests a concave function. (Note that the plot displays clearly the SF of SFS, but that the "nal S is not displayed in the plot, because of the truncation at log batch number "7.) In Fig. 7, the externality parameter e has been increased to its maximum relative to n (e"n"100). The landscape is very rugged because of the very large e. Consequently, plateauing is very strong (only 1% of the trials lead to improvements) and overall progress is very small (p( "97.8).
416
P. Auerswald et al. / Journal of Economic Dynamics & Control 24 (2000) 389}450
Fig. 7. Walk on a rugged landscape.
In Fig. 8, we have e"1 so there are no externalities to cause a rough landscape. But n is reduced to 10 while s is increased to 100. The number of operations is few, so that a change in any operation can be expected to have a large impact on the labor requirement. This is re#ected by very rapid overall productivity improvement, which is con"rmed by the value of the estimated progress ratio of 60.2%. Plateauing is evident (z is only 4.4%). The SFS e!ect is evident, although the caution against overweighting the sparse early realizations also applies here. In Figs. 5}8, we reported only one production run. Each of Figs. 9}13 presents averaged data of multiple production runs based on a given vector of parameters. Fig. 9 is the same as Fig. 5 except in Fig. 9 the data is averaged over 20 separate production runs. The vertical axis in Fig. 9 measures the adjusted log labor requirement of the industry average over 20 "rms or, alternatively the
P. Auerswald et al. / Journal of Economic Dynamics & Control 24 (2000) 389}450
417
Fig. 8. Small n, small e, large s.
adjusted log labor requirement of the "rm average over 20 plants. The most important di!erence between the outputs in Fig. 9 and Fig. 5 is the degree of plateauing. The curve in Fig. 9 is far smoother than the curve in Fig. 5. Plateauing is evident in Fig. 5, while it is barely discernible in Fig. 9. This is con"rmed by the z statistics: in the single-run case only 6.2% of the trials result in improvement, while in the 20-run average, 65% of the trials result in improvement. The estimated progress ratio (87.5%) for the single-"rm walk is very close to the estimated progress ratio (86.5%) for the average walk of the 20 "rms. The small, but positive curvature e!ect seems to be the same for Figs. 5 and 9. Fig. 6 is based on a correlated landscape (e"1) and hence the single run is quite smooth, but some plateauing is discernible. The average walk shown in Fig. 10 is even smoother. For the single run depicted in Fig. 6, p( "94.6% and
418
P. Auerswald et al. / Journal of Economic Dynamics & Control 24 (2000) 389}450
Fig. 9. Base parameter vector, industry average of 20 "rms (compare with Fig. 5).
z"42.3%. For the averaged run depicted in Fig. 10, p( "94.6% and z"99.9%. The strong positive curvature e!ects in the two "gures are nearly identical. The landscape behind Fig. 7 is very rugged (e"100). Plateauing is dominant. Only 1% of the trials result in improvements. Fig. 7 is the 20-"rm average run using Fig. 7 parameters. Plateauing is reduced; 7.8% of the trials result in improvement. Fig. 12 is the 50-"rm average run based on the same rugged landscape data. Plateauing is further reduced; 15.7% of the trials result in improvements. The estimated progress ratio for each of the 3 cases (Figs. 7, 11 and 12), is about 98%. It is di$cult to judge the SFS e!ect when there is so much plateauing, but it is positive and one could argue that the e!ect is constant across Figs. 7, 11, and 12. Fig. 13 is the 20-"rm average related to the single-"rm walk in Fig. 8. The averaging reduces plateauing (increases z), has no e!ect on the progress ratio or
P. Auerswald et al. / Journal of Economic Dynamics & Control 24 (2000) 389}450
419
Fig. 10. Smooth landscape, industry average of 20 "rms (compare with Fig. 6).
the terminal labor requirement, and seems to reduce the SFS e!ect but only slightly. From these experiments, we make the following tentative conclusions:30 f Averaging profoundly reduces plateauing (and increases z). f Averaging does not substantially a!ect the estimated progress ratio. f Averaging does not seem to have a strong e!ect on curvature or SFS. These are consistent with actual observations of the "rm and industry experience curves.31
30 The "rst and possibly the second conclusions would seem to be susceptible to analytic proof. 31 See the survey by Dutton and Thomas (1984).
420
P. Auerswald et al. / Journal of Economic Dynamics & Control 24 (2000) 389}450
Fig. 11. Rugged landscape, industry average of 20 "rms (compare with Fig. 7).
5.5. Multiple realizations from the same vector of parameters Many of the qualitative features of experience curves } ranges of values of p( , presence of plateaus, di!erent learning rates for the same or similar goods } can be discerned by examining single realizations of learning curves. However, to study the full e!ects of changes in the values of the underlying parameters on the predictions of the model, we need to compute more than one realization per set of parameter values.32 Consequently, for each chosen parameter vector in our experiment, we computed 20 independent realizations.
32 In particular, we are interested in sample standard deviations as well as sample means for our predictions. This is mainly to match observations. Sample standard deviations also play a central role in industrial organization studies.
P. Auerswald et al. / Journal of Economic Dynamics & Control 24 (2000) 389}450
421
Fig. 12. Rugged landscape, industry average of 50 "rms (compare with Figs. 7 and 11).
In our simulations, computing 20 di!erent realizations means running the simulation program using the same parameter set, but with 20 di!erent random seeds. A new random seed yields a new realization of the externality connection among the operations, a new realization of the landscape l(u), a new starting point on the landscape and hence a new experience curve. Hence we have chosen in this class of models the &maximum degree of randomness' between di!erent realizations of the experience curve. (Even if the sets of connections E i (i"1,2, n), the realization of the landscape, l(u), and the starting recipe, u , 0 were all to be held constant, di!erent realizations of the experience curve would still be possible (indeed almost certain) due to di!erent sequences of recipe sampling.) The sample standard deviations that we compute are therefore likely to be biased upward.
422
P. Auerswald et al. / Journal of Economic Dynamics & Control 24 (2000) 389}450
Fig. 13. Small n, small e, large s, industry average of 20 "rms (compare with Fig. 8).
The set of potentially interesting parameters is large. We restricted out computations to the following grid-like parameter space: f n"1, 10, 20, 50, 100, 500, 1000; f s"2, 10, 25, 50, 75, 100; f e"1, 2, 3, 5, 6, 7, 8, 9, 10, 25, 50, 75, 100 (but with the constraint that e4n); f d"1, 2, 4, 10, 25, 50, 75, 100 (but with the constraint that d4n); f q"1, 10, 50, 100, 250 (but with the constraint that q4¹); f ¹" 100, 500, 1000, 5000.
P. Auerswald et al. / Journal of Economic Dynamics & Control 24 (2000) 389}450
423
5.6. Parameter sets and scoring procedures We worked with two subsets of parameters. The "rst subset, the focused set of parameter values, re#ects our priors informed by our review of the empirical literature, introspection about production processes, and comparisons with the modelling in evolutionary biology. To achieve the rapid productivity increases that have been observed, we focused on rather small values of e and d (in particular: e"1, 5 and d"1) relative to n and relatively low values of s (in particular: s"2, 10).33 The length of the run was frequently set at ¹"1000. This was chosen to reduce or eliminate the e!ects of the terminal plateau. See the center panel in Fig. 20, which con"rms our strategy. For s"10, n"100, e"5, the mean progress ratio is smallest for ¹"1000. For ¹'1000 the e!ect of the terminal plateau is to increase the progress ratio. For many runs, we adopted n"100 for the number of operations. For many of our runs we adopted q"1. Our base cases for the focused runs are then: f f f f
(n"100, (n"100, (n"100, (n"100,
s"2, e"1, d"1, q"1, ¹"1000), s"10, e"1, d"1, q"1, ¹"1000), s"2, e"5, d"1, q"1, ¹"1000), s"10, e"5, d"1, q"1, ¹"1000).
The focused parameter set was constructed from the above four base-case vectors by varying the six parameters one at a time. Summary statistics for the focused parameter set are given in Table 3. There are 173 parameter vectors in the focused set. For each vector there are 20 runs, so the total number of runs is 3460. If the parameter space were only of dimension 2 and there were only a single base case, our method of choosing parameters would be that described in Fig. 14. Say the base parameter vector is given as row 3, column 5 of the simple 10]10 matrix recipe set in Fig. 14. Then the set of focused parameters is the union of the set of recipes having a row-3 component with the set of recipes having a column-5 component. The focused parameter set is in the shaded &cross'. The advantage of the focused parameter method is that we begin with a set of reasonable base parameters and then we test the sensitivity of the predictions to each of these parameters varied one at a time from each of the base vectors. The parameters are often set at &extreme' values to test parameter sensitivity. On the other hand, as can be seen from Fig. 14, this selection of parameter points is clearly &statistically ine$cient' and our results could be sensitive to our choice of base parameter vectors. As a counter to these potential
33 Actually, 5 is not a small value for the parameter e when n"100 or n"1000. In fact, (e!1) gives the number of externalities per operation. So the number of externalties per recipe would be n(e!1).
424
P. Auerswald et al. / Journal of Economic Dynamics & Control 24 (2000) 389}450
Table 3 Summary statistics: the focused parameter set (173 parameter vectors; 20 runs per parameter vector) Minimum Parameters n (dops.) s (inst./op.) e (ext. par.) d (max. trial dist.) ¹ (length of run) Results p6 (mean prog.) s (st. dev. prog.) p z6 (mean imp. percent) c6 (mean curv.) 2 s 2 (st. dev. curv.) c
1.0000 2.0000 1.0000 1.0000 10.0000 60.8610 0.0000 0.0000 !0.1315 0.0000
Maximum
Mean
Std. deviation
100.00 100.00 100.00 100.00 1000.00
179.855 15.8150 9.653179 11.9653 704.740
308.577 24.3057 21.5503 27.0370 371.619
100.00 23.0056 98.4000 0.1634 0.4245
89.8573 2.407138 24.1670 0.0040 0.025
10.7914 3.221978 27.7214 0.042 0.047
Fig. 14. Construction of the focused set of parameters in a simpli"ed set of recipes.
P. Auerswald et al. / Journal of Economic Dynamics & Control 24 (2000) 389}450
425
Table 4 Summary statistics: the random parameter set (250 parameter vectors; 20 runs per parameter vector)
Parameters n (dops.) s (inst./op.) e (ext. par.) d (max. trial dist.) ¹ (length of run) Results p6 (mean prog.) s (st. dev. prog.) p z6 (mean percent imp.) s (st. dev. percent imp.) z c6 (mean quad. coef.) 2 s 2 (std. dev. quad. coef.) c lM (mean init. labor req.) 0 sN l0 (std. dev. init. labor. req.) lM (mean "nal labor req.) T slT (std. dev. "nal labor req.)
Minimum
Maximum
Mean
Std. Deviation
2.0000 2.0000 1.0000 1.0000 1000.00
999.00 99.00 10.00 10.00 1000.00
499.3160 50.8000 5.4000 5.4880 1000.00
288.9405 28.4154 2.8725 2.8653 0.0000
74.36 0.30 0.66 0.13 !0.07 0.00 0.35 0.01 0.05 !0.07
95.72 9.81 36.24 1.79 0.09 0.07 0.52 0.16 0.76 0.09
91.6939 8.9121 8.9121 0.5825 !0.017 0.00613 0.4965 0.0172 0.6052 0.017
3.4291 5.5263 5.5263 0.2580 0.0128 0.00750 0.0126 0.0158 0.1190 0.0128
biases, we also simulated experience curves based on a random set of parameter values. The random parameter vectors were chosen as follows: f f f f f f
n drawn uniformly from M1,2, 1000N, s drawn uniformly from M1,2, 100N, e drawn uniformly from M1,2, min(10, n/2)N, d drawn uniformly from M1,2, min(10, n/2)N, q drawn uniformly from M1,2, 10N, ¹"1000.
The number of parameter vectors in the set of random parameters is 250. There are 20 runs per vector. Hence there are 5000 runs in all for the random parameter set. Summary statistics for the random parameter set are given in Table 4. The parameters selected for the focused set su!er from &Fig. 14 bias'; the parameters selected for the random set do not. These are not the only di!erences between the two parameter sets. See Tables 3 and 4. For the parameters n and s, the ranges and the means are greater in the random set than in the focused set, but this is reversed for e and d. In the focused set, ¹ was varied between 10 and 1000, but in the &random' set ¹ was "xed at 1000. The means of the p( 's are similar, but the range and the standard deviations of the pL 's are much larger for the focused set. The mean of the z's, their range, and their standard deviations are larger for the focused set. Curvature predictions and terminal labor requirements were not assembled for the focused set.
426
P. Auerswald et al. / Journal of Economic Dynamics & Control 24 (2000) 389}450
We compiled summary statistics similar to those shown in Tables 3 and 4 for the pooled parameter set constructed by combining the focused and the random sets, and did some (but not complete) OLS scoring for the pooled parameter set, but the results are not presented in this paper. We evaluated the e!ects of varying the parameters of the model using two scoring methods. For the focused parameter set, we used our judgement from studying all the relevant simulations. This is called here the eyeball method of scoring34 parameter e!ects. We believe that the eyeball method is very illuminating, but it does require judgement from the authors. As a guard against human bias, we also used simple OLS regression scoring for the focused parameters (173 experiments) and the random parameters (250 experiments). The basic disadvantage35 to OLS scoring } at least as we do it } is that the results are global: extreme parameter values are probably overweighted. Furthermore, subtle nonmonotonic interrelationships are obscured by the simple functional forms we used for OLS scoring. 5.7. Comparative dynamics: Eyeball scoring The e!ect of varying a particular parameter on one of the predictions (or results) of the model typically depends on the interplay of two e!ects: (1) the e!ect of the parameter change on the size of the recipe space and (2) the e!ect of the change on the trial (or, recipe sampling) mechanics. Typically, these e!ects are too complicated to permit an analytic solution, especially since our focus is on the short term and the medium term. Computation is called for. 5.7.1. The estimated progress ratio The ewect of n on pN and s : The "rst e!ect of increasing n is to increase the p number of recipes, sn. This e!ect (especially for large ¹) should tend to increase long-term productivity improvement. On the other hand, increasing n decreases (especially when e is small) the expected cost reduction of one-step or few-step changes in the recipe on unit labor costs, because } given our assumption of additive unit costs } with more operations each operation contributes less to the overall cost. This suggests that increasing n might decrease the rate of short-term (and medium-term) productivity improvement.
34 Eye-conometrics. 35 For an econometrician, the fundamental objection to OLS scoring is, of course, the absence of a statistical model for mapping parameters into predictions.
P. Auerswald et al. / Journal of Economic Dynamics & Control 24 (2000) 389}450
427
Fig. 15. Comparative dynamics, e!ects of n on pN and s . p
In Fig. 15, the sample means, p6 (over 20 runs), and the sample standard deviations, s , are plotted. We observe that for small n the e!ect of increasing n is to p decrease p6 (i.e. to increase the mean rate of productivity improvement), but for larger n, the e!ect on pN of increasing n is positive. As n becomes even larger, the e!ect on p6 of increasing n attenuates. The standard deviation, s , is decreasing in n. p
428
P. Auerswald et al. / Journal of Economic Dynamics & Control 24 (2000) 389}450
Fig. 16. Comparative dynamics, e!ects of s on p6 and s . p
The ewects of s on pN and s : The sole e!ect of increasing the parameter s on the p rate of productivity improvement is through increasing the size of the recipe space and hence through increasing long-run productivity improvement. From Fig. 16, we see that this is con"rmed. Increasing s substantially decreases p6 while slightly increasing s , but each e!ect eventually attenuates as s becomes p
P. Auerswald et al. / Journal of Economic Dynamics & Control 24 (2000) 389}450
429
large. In particular, for s larger than 50 the e!ect on p6 of increasing s is negligible.36 The ewects of e on pN and s : The most obvious e!ect of increasing e is increasing p the ruggedness of the landscape, thereby reducing the e!ectiveness of the myopic recipe sampling procedure. As e increases the number of local optima in the landscape increases, thus increasing the probability of being &trapped'. This reasoning suggests that p6 would tend to be increasing in e. On the other hand, increasing the parameter e increases the number of cost-relevant subrecipes (equal to nse) and thus reduces the expected value of the global minimum labor requirement. Furthermore, increasing e has the e!ect of speeding the rate of experimentation, since each trial modi"es the contribution to the labor requirement of not one, but e di!erent operations within the production recipe. For these last two (related) reasons, we might expect p6 to tend to be decreasing in e. Results for e are given in Figs. 17 and 18. If the recipe space is relatively small (s(6, n"100), then increasing e seems to decrease p6 for small e, although the standard errors suggest that we should be cautious in making this conclusion. The smallest p6 (and the lowest "nal labor requirements) seems to occur at values of eK5. If the recipe space is larger (s'6, n"100), then p6 and l are clearly T monotonically increasing in e. For large s, the transitory e!ects of e depend on how much progress has already been made. If l(u ) is above the expected value t of /(u) over all of X, then increasing e (for small values of e) increases the expected rate of short-run productivity improvement. On the other hand, if l(u ) t is below the expected value of /(u), then increasing e (for small values of e), decreases the expected rate of productivity improvement.37 This is because the ruggedness is helpful in &bad' (high-l) neighborhoods, but hurtful in good (low-l) neighborhoods. This phenomenon is seen in the simulations.38 The ewects of d on pN and s : Taking bigger steps on a given landscape is p somewhat like walking with smaller steps on a more rugged landscape. Hence, increasing d should be analogous to increasing e. Like increasing e, increasing d increases p6 except for some cases with d small; see Fig. 19. There are suggestions in the data that for small d and appropriately chosen values of the other parameters, p6 is decreasing in d. Indeed, the parameters e and d are close cousins. Fig. 19 does not suggest any clear e!ect of d on s . p
36 This suggests that merely adding an in"nity of possible instructions for each operation will not substantially increase the rate of productivity increase in the model. (This is reinforced by analytic results in some unpublished work by Gaetano Antinol" and Todd Keister.) Contrast this with the approaches of Romer (1996) and Weitzman (1996). 37 See Auerswald (1999), Chapter 3. 38 This argument also suggests that increasing e tends to increase the curvature misspeci"cation. This e!ect is also present in the simulations.
430
P. Auerswald et al. / Journal of Economic Dynamics & Control 24 (2000) 389}450
Fig. 17. Comparative dynamics, e!ects of e on p6 and s (case with s"2). p
Ewect of ¹ on pN and s : The length of the production run would not a!ect p6 if p the model were perfectly speci"ed, in particular, if a power law "tted the data well. Varying ¹ provides a method for analyzing the curvature misspeci"cation of the experience curve. See Fig. 20. For the case with a relatively small recipe space (s"10, n"100) and a relatively rugged landscape (e"5), the SFS e!ect is pronounced. The progress ratio falls from ¹"1 to about ¹"1000 and then
P. Auerswald et al. / Journal of Economic Dynamics & Control 24 (2000) 389}450
431
Fig. 18. Comparative dynamics, e!ects of e on p6 and s (case with s"10). p
gradually rises out to ¹"5000. This pattern is also suggested for the case: s"100, n"10, e"5, but the standard errors are too large for con"dence. For the case: s"10, n"1000, e"1, the recipe space is very large and the landscape is smooth. The estimated mean progress ratio is monotonically decreasing (with small standard errors) over ¹"1 to ¹"5000 (Fig. 21). The recipe space
432
P. Auerswald et al. / Journal of Economic Dynamics & Control 24 (2000) 389}450
Fig. 19. Comparative dynamics, e!ects of d on p6 and s . p
is so large in this case that the e!ects of the second Slow response do not kick in su$ciently to increase pN even at ¹"5000. 5.7.2. Plateauing The statistic z (percent of trials that result in improved productivity) is an inverse measure of plateauing. Increasing the number of recipes by increasing n,
P. Auerswald et al. / Journal of Economic Dynamics & Control 24 (2000) 389}450
433
Fig. 20. Comparative dynamics, e!ects of ¹ on p6 and s . p
decreases plateauing with no discernible e!ect on the standard deviation s (see z Fig. 22). Increasing the number of recipes by increasing s decreases plateauing but increases (except for large values of s) the standard deviation s . Increasing e, z in general, increases plateauing (see Fig. 23). Increasing d, in general, increases plateauing, but for small e, s, and d, it appears that increasing d reduces plateauing (see Fig. 24).
434
P. Auerswald et al. / Journal of Economic Dynamics & Control 24 (2000) 389}450
Fig. 21. Plateauing, e!ects of n on z6 and s . z
5.7.3. The curvature misspecixcation and the SFS ewect The positive curvature e!ect is pronounced in Figs. 6 and 11 (smooth landscape cases with n"1000, s"10, e"1, d"1, q"1, and ¹"1000). Linear OLS in log/log space at "rst overstates the actual rate of productivity improvement and then understates it. Ultimately (because of the terminal plateau), linear OLS in log/log space can be expected to overstate the rate of
P. Auerswald et al. / Journal of Economic Dynamics & Control 24 (2000) 389}450
435
Fig. 22. Plateauing, e!ects of s on z6 , s , lM , and slT. z T
productivity improvement. This is not surprising for smooth, many-recipe landscapes with large n and small d. Because n is large, for each improvement the expected reduction in the labor requirement is small. Because the landscape is smooth, the probability of "nding an improvement on any given trial is relatively high. The large recipe set implies that the stock of potential improvements is being exhausted at a very slow rate. Hence the resulting productivity plot is likely to be nearly linear in natural units. Therefore it will be strongly concave to the origin in log/log space. This is in agreement with the results of our model and
436
P. Auerswald et al. / Journal of Economic Dynamics & Control 24 (2000) 389}450
Fig. 23. Plateauing, e!ects of e on z6 and s . z
with observed experience curves. The data behind experience curves frequently show curvature bias, usually positive (indicating a concave function), but sometimes negative (indicating a convex function). In the subsection above on the e!ects of ¹ on p6 and s , we also provide separate simulation evidence on p curvature and SFS.
P. Auerswald et al. / Journal of Economic Dynamics & Control 24 (2000) 389}450
437
Fig. 24. Plateauing, e!ects of d on z6 and s . z
5.8. Comparative dynamics: OLS scoring For the two parameter sets (focused and random),39 we regressed each of the predictions of the model on the parameters of the model. We employed various
39 Clearly more e$cient grids and pooling of data are possible. See Judd (1998), especially Chapter 9 on acceleration techniques for Monte Carlo experiments.
438
P. Auerswald et al. / Journal of Economic Dynamics & Control 24 (2000) 389}450
Table 5 Prediction of p6 by OLS scoring from the focused parameter set Summary R
R2
0.836
Adjusted R2 0.698
0.689
Std. error of the estimate 6.015016
Analysis of Variance
Regression Residual Total
Sum of squares
df
13988.2 6042.130 20030.3
5 167 172
Coe$cient
Std. error
Mean square
F
2797.635 36.180
Sig. 22.325
0.000
Coezcients
Constant log n log s log e log d log q
101.537 !1.22 !7.115 3.132 0.0343 !0.064
1.798 0.276 0.469 0.361 0.353 0.250
Std. coe$cient
!0.021 !0.756 0.397 0.049 !0.011
t
Sig.
56.476 !0.443 !15.157 8.672 0.970 !0.256
0.000 0.000 0.000 0.000 0.333 0.798
functional forms. The results are not very sensitive to the functional form. We report here the regression results for cases in which the prediction in natural units is regressed on log values of the parameters.40 Predicting p6 : In Tables 5 and 6, we summarize the results of OLS scoring for prediction of p6 . The R2's are not very high. This is probably because the functional form we are using is highly misspeci"ed. We saw by eyeball scoring that the interaction e!ects of the parameters can be quite subtle and that the e!ects of varying even a single parameter are not monotone. Nonetheless, the t tests yield high levels of signi"cance for most of the parameters. The R2's and the t tests are more favorable for the random set. This is probably because the random set does not su!er from &Fig. 14 bias', i.e. (1) the data are more dispersed for the random set and (2) the focused set conditions more on the interesting small values for which the results tend to be non-monotone in the parameters.
40 Our (unreported) experiments also include: natural predictions regressed on natural parameters, and log predictions regressed on log parameters. We also experimented with interaction terms for the parameters.
P. Auerswald et al. / Journal of Economic Dynamics & Control 24 (2000) 389}450
439
Table 6 Prediction of p6 by OLS scoring from the random parameter set Summary R 0.917
R2
Adjusted R2 0.840
0.837
Std. error of the estimate 1.3847
Analysis of Variance
Regression Residual Total
Sum of squares
df
Mean square
2460.072 467.843 2927.914
5 244 249
492.014 1.917
Coe$cient
Std. error
Std. coe$cient
74.119 2.118 !0.128 2.341 1.493 !0.127
0.699 0.090 0.103 0.125 0.129 0.123
F
Sig.
256.606
0.000
Coezcients
Constant log n log s log e log d log q
0.620 !0.033 0.484 0.305 !0.027
t 106.037 23.586 !1.246 18.750 11.563 !1.037
Sig. 0.000 0.000 0.214 0.000 0.000 0.301
Both OLS scorings predict that increasing either of the two cousin parameters } e and d } will increase pN . From the focused parameter set, the prediction is that increasing s decreases pN . The prediction from the random parameter set is the same but at a lower level of signi"cance. From the random set, there is a weak prediction that increasing q increases pN ; from the focused set, the coe$cient is not signi"cant. This weak e!ect of q on pN is probably because of misspeci"cation of the experience curve: as q is increased initial productivity improvements can be so rapid that the terminal plateau is reached quickly. The estimated progress ratio then gives a downward biased estimate of the &actual rate of productivity improvement.' Another reason that the q e!ects might appear to be weaker than expected is that our model of reporting and implementation of quality control trials might not be the best one. For the focused parameter set, increasing the parameter n decreases the prediction pN . For the random parameter set, increasing n strongly increases pN . This can be explained by the fact that the random parameter set contains bigger n's than does the focused parameter set; see Tables 3 and 4. Eyeball scoring strongly suggests that pN is not monotone in n. For smaller n, pN is decreasing in n. For larger n, pN is increasing in n.
440
P. Auerswald et al. / Journal of Economic Dynamics & Control 24 (2000) 389}450
Table 7 Prediction of s by OLS scoring from the focused parameter set p Summary R 0.740
R2
Adjusted R2 0.547
0.536
Std. error of the estimate 2.193557
Analysis of variance
Regression Residual Total
Sum of squares
df
Mean square
977.192 808.364 1785.557
4 168 172
244.298 4.812
Coe$cient
Std. error
Std. coe$cient
2.656 !0.740 1.403 !0.345 0.219
0.637 0.100 0.171 0.132 0.128
F
Sig. 50.772
0.000
Coezcients
Constant log n log s log e log d
!0.417 0.499 !0.146 0.104
t 4.168 !7.366 8.201 !2.624 1.709
Sig. 0.000 0.000 0.000 0.009 0.089
Predicting s : In Tables 7 and 8, we report the prediction of the standard p deviation s . Increasing n reduces the predicted s . Increasing s increases the p p s predicted from focused parameters. Increasing e decreases the predictions of p s . The predicted e!ects of varying d di!er between the two parameter sets. p Increasing q decreases the prediction of s . p Predicting zN : See Table 9. Increasing n increases the predicted mean improvement percentage, zN , while increasing e or d decreases zN . Predicting c6 : If c6 is negative, then the estimated quadratic experience curve is 2 2 a concave function in log/log space. See Table 10. Increasing n, s, or q decreases predicted c6 and hence increases the curvature e!ect. Increasing e or d increases 2 the predicted c6 and hence decreases the curvature e!ect. 2 5.9. Matching observations Our model is su$ciently rich to match the reported progress ratios from estimated experience curves. One can do more. If one has data or priors on the values of p6 , s6 , z6 , s , c6 , s 2, or any of the other predictions for a particular plant, p z 2 c "rm or industry producing a speci"c good, then one can search for parameters
P. Auerswald et al. / Journal of Economic Dynamics & Control 24 (2000) 389}450
441
Table 8 Prediction of s by OLS scoring from the random parameter set p Summary R 0.831
R2
Adjusted R2 0.691
0.685
Std. error of the estimate 0.5226
Analysis of variance Sum of squares Regression Residual Total
149.101 66.640 215.741
df 5 244 249
Mean square 29.820 0.273
F
Sig. 109.186
0.000
Coezcients
Constant log n log s log e log d log q
Coe$cient
Std. error
5.704 !0.722 !0.023 !0.137 !0.121 !0.103
0.264 0.034 0.039 0.047 0.049 0.046
Std. coe$cient
!0.779 !0.022 !0.105 !0.091 !0.080
t 21.620 !21.313 !0.601 !2.915 !2.485 !2.215
Sig. 0.000 0.000 0.549 0.004 0.014 0.028
n, s, e, d and q that predict the data. One might also have priors on some of the parameters based on engineering considerations or (especially in the case of ¹) market considerations. From this, one could come up with a best explanation of the observed data. How well the model "ts observations and priors would measure the usefulness of our theory of learning by doing. The observed values of p6 (from actual "rms and industries) are likely to be biased downward, since estimates of the progress ratio also pick up the e!ects of increasing returns to scale in production and of the development (the D of R&D) activity devoted to improvements in production e$ciencies. We have not done anything in our experiments to account for this bias. It should be straightforward to test the predictions of model in the following way: (1) Take some learning curves for a particular industry. (2) Adjust the reported statistics (such as p6 and s ) for the numbers of observations in each run. p (3) Then "nd in our set of predictions the parameter sets, for which the predictions are near the observed statistics. This program is included in our research agenda.
442
P. Auerswald et al. / Journal of Economic Dynamics & Control 24 (2000) 389}450
Table 9 Prediction of z6 by OLS scoring from the random parameter set Summary R
R2
0.772
Adjusted R2 0.596
0.595
Std. error of the estimate 3.5315
Analysis of variance Sum of squares Regression Residual Total
91718.6 62294.3 154013
df
Mean square
F
4 4995 4999
22929.7 12.471
1838.589
Sig. 0.000
Coezcients Coe$cient Constant log n log s log e log d
!1.786 3.240 0.213 !3.954 !2.221
Std. error 0.396 0.050 0.059 0.071 0.074
Std. coe$cient t
0.585 0.033 !0.504 !0.280
!4.511 64.163 3.630 !55.604 !30.163
Sig. 0.000 0.000 0.549 0.004 0.000
5.10. Averaging runs Averaging over production runs based on the same vector of parameters tends to &clean the data' of (non-terminal) plateauing, without (as far as we can tell) seriously a!ecting predictions like p6 and c6 . This is a useful &pre"lter' to be 2 used before eyeballing the data: the irregular realization of improvements sometimes makes it di$cult to see the forest (slope and curvature of the plot) for the trees (the particular realizations of plateauing).
6. Summary and conclusions To account for the e!ects of technological evolution, macroeconomists rely on models with inter"rm production externalities and non-conventional factors of production (such as human capital and technological knowledge). In this regard, macro has gone beyond its micro foundations. Our primary goal for this paper is to suggest a general micro approach for modeling technological evolution, viz. to provide an explicit description of the engineering recipe and
P. Auerswald et al. / Journal of Economic Dynamics & Control 24 (2000) 389}450
443
Table 10 Prediction of c6 by OLS scoring from the random parameter set 2 Summary R 0.602
R2
Adjusted R2 0.362
0.361
Std. error of the estimate 0.0127
Analysis of variance Sum of squares Regression Residual Total
0.457 0.806 1.262
df 5 4994 4999
Mean square
F
0.0914 0.000161
Sig. 566.462
0.000
Coezcients
Constant log n log s log e log d log q
Coe$cient
Std. error
!0.0071 !0.0050 !0.00072 0.0105 !0.00592 !0.0016
0.001 0.000 0.000 0.000 0.000 0.000
Std. coe$cient
!0.314 !0.040 0.466 0.260 !0.072
t !4.919 !27.020 !3.422 40.872 22.345 !6.281
Sig. 0.000 0.000 0.001 0.000 0.000 0.000
then to model both the relationship of one recipe to another and the corresponding input}output relationships. Doing this would allow one to build micro models of research and development, technology transfer, learning by doing, and so forth. Empirical justi"cation for this point of view can be found in the widespread business use of engineering experience curves. It might be useful to indicate three things that our approach is not: (1) The recipes model is not a simple disaggregation of some macro model. Economists "nd it useful to disaggregate, for example, &labor' into &skilled labor' and &unskilled labor' for some particular problems. Disaggregation is an important art, but in itself it does not require the introduction of recipes. (2) Our recipes model goes beyond the work of Chenery (1949), Smith (1961), and others on engineering production functions41 (and engineering cost functions). Chenery and Smith use engineering information about currently existing blueprints to
41 Foley (1998) describes one non-production-function approach to modeling long-run technical change.
444
P. Auerswald et al. / Journal of Economic Dynamics & Control 24 (2000) 389}450
place restrictions on production functions before estimating their parameters. In the recipes approach, blueprints for one production process are related to those for other processes (including those for undiscovered processes). The Chenery and Smith works sharpen our understanding of existing technology, but they do not provide a su$cient basis for modeling technological evolution. (3) Stokey (1988) and Boldrin and Levine (1997) analyze the introduction of new goods in economies for which there are many available (i.e. known with certainty) neoclassical production techniques. The problem for Stokey and Boldrin/Levine is "nding the proper sequence in which these techniques are to be exploited. The discovery of improved techniques from uncertain recipes is not treated in these papers. To make our recipes approach concrete, we apply it to modeling shop-#oor learning by doing. Our guide for this has been the ideas to be found in the words (the equations are pure macro) of Ken Arrow's (1962) seminal paper and the words and some of the equations of Bob Solow's (1997) provocative Arrow Lectures. There is an impressive amount of empirical work on the engineering experience curve. Wright's law is that unit cost l is related to > , cumulated output, t t~1 by the power function l "a(> )~1@3, so that the progress ratio p is given by t t~1 p"2~1@3"79%. If we allow for a more general power law, we have l "a(> )~b, t t~1 where b'0 and p"2~b. The progress ratio p is a decreasing function of the exponent b, the learning coe$cient. Post-Wright empirical studies suggest that observed progress ratios live in the range of about 60}95% with a mode of about 81}82%. The existing empirical literature reports not only mean progress ratios but also their standard deviations. When confronting observed data, the simple power law su!ers from two serious types of speci"cation error: (1) plateauing and (2) curvature or SFS bias. Plateauing is reduced by averaging (over "rms in an industry or plants in a "rm), but the curvature and SFS are more persistent. In our recipes model of learning by doing, we assume that production is of a single output from a single input with constant returns to scale. We also assume that the recipe space is "nite. This allows us to adapt the ("nite, combinatorial) NK model for our purposes. There are six basic parameters in our model of shop-#oor learning by doing: (1) n, the number of production operations, (2) s, the number of possible instructions or settings for each operation, (3) e, the externality parameter that gives the number of operations whose settings a!ect the costs of one operation, (4) d, the maximum step size per trial, (5) q, the number of trials made on the shop #oor per measured batch, and (6) ¹, the length of the production run. In Section 5, we provide the comparative dynamics for the learning-by-doing model. The analytics are di$cult } especially since our major interest is in the
P. Auerswald et al. / Journal of Economic Dynamics & Control 24 (2000) 389}450
445
short term and the medium term } so computation is called for. The simplest parameter to analyze is s. The e!ects of s are purely through its e!ect on the number of recipes, sn. Increasing s increases the rate of productivity increase and hence decreases p6 , the sample mean of the progress ratio, while slightly decreasing s , the standard deviation42 of the progress ratio. p Increasing n has two basic consequences. It increases the number of recipes, ns, but it also decreases the e!ect of small-scale improvements on the overall productivity. The "rst e!ect tends to decrease p6 , while the second tends to increase p6 . In fact, for small n the e!ect of increasing n is to decrease p6 , while for larger n the e!ect is to increase p6 . The standard deviation, s , is decreasing in n. Increasing p n decreases plateauing, the phenomenon of runs without improvements. If e"1, we know that for ¹ very large, the global least-cost recipe will eventually be chosen. We are, however, more interested in shorter term e!ects. Increasing e, the externality parameter, increases the number of cost-relevant recipes, nse. Increasing e increases the rate of experimentation. This e!ect is similar to the e!ect of increasing s. Increasing e also makes the landscape more rugged. The "rst two considerations tend to decrease p6 , while the third e!ect tends to increase p6 . If the recipe space is small, then increasing e seems to decrease p6 for small e. Otherwise, increasing e increases p6 . Increasing e decreases the curvature misspeci"cation. The average step size is an increasing function of d. Increasing d, because taking bigger steps is like walking on a more rugged landscape, turns out to have similar e!ects to increasing e } even though increasing d does not expand the set of cost-relevant subrecipes. Increasing q increases the number of trials per measured batch. Thus q measures the speed of economic time relative to calendar time. This parameter was included for two reasons. The "rst goal was to make the error process more realistic: not every product is likely to have the same number of trials per measured batch. The second was to allow us to easily generate runs with very low p6 . In this second goal, we were only partly successful. Overall, increasing q does tend to decrease p6 but the e!ect is not strong. In retrospect, we did not study q carefully enough. More experiments are needed. More importantly, modi"cations of the modeling of auditing/production timing are called for. The parameter ¹, the length of the production run, is very important. It helps us to measure the curvature bias. Because of the functional form misspeci"cation, it is predicted that p6 will be very dependent on ¹. This is observed in the actual experience curve data43 and our simulations.
42 An innovation of our study is the prediction of observed standard deviations. This gives us more predictions to match with the observed data. It is also in line with the interests of industrial organization economists and others. 43 See Conway and Schultz (1959) and Balo! (1971).
446
P. Auerswald et al. / Journal of Economic Dynamics & Control 24 (2000) 389}450
Our model is su$ciently rich to give predictions for p6 in the range (60}95%) suggested by Fig. 2, while also matching observations for the s 's. To do this, we p select parameters with relatively large n, and relatively large s, but with relatively small e and relatively small d. If data were available on z, s , c , and s 2, we could z 2 c further test our model. Prior information on the parameters could also sharpen these tests. If we merely look at the distribution of predictions over either of the parameter sets (see Tables 3 and 4), we do not come close to matching the distribution of observed results (see Fig. 2). For example, the mean p6 from Table 3 is 90%, and the mean p6 from Table 4 is 92%. These are very slow compared to the mode in Fig. 2 (81}82%) or to Wright's Law (79%). This should be no surprise. The two parameter sets were meant to be inclusive, but not typical. Many extreme values of the parameters are included in these sets for purposes of sensitivity analysis. How does our model compare to other models of learning by doing? Most of the successors to Arrow work with models that rely heavily on some macroeconomic production externality.44 Two papers, Muth (1986) and Jovanovic and Nyarko (1995), contain microeconomic theories of technological evolution.45 The Jovanovic and Nyarko paper is a classic. Their "rm follows a purposive economic strategy. Production decisions and learning decisions are fully rational. In their general formulation, Jovanovic and Nyarko allow for the possibility of interactions between the current learning choice and the current production choice, but in the worked-out model independence is assumed. Hence one could say that the Jovanovic and Nyarko model is about learning and doing rather than learning by doing. We think that our work is more in the spirit of Arrow's (1962) original verbal discussion } that is, in the spirit of John Dewey46 and the Gestalt philosophers, for whom learning involves doing (in our case producing). (See also Solow (1997) on Arrow.) The &cost of learning' for this School could be represented in our model by the lack of short-run discipline in production. It would have been easy for us to incorporate production retrogressions in our analysis to make our model "t even better to this Dewey insight. We are not wedded to myopic recipe selection. It would certainly be interesting to extend our model of learning by doing to allow for both foresight in selection of the reigning recipe(s) and some control by the "rm of the rate and direction of experimentation. For the latter, there must be costs of
44 See, e.g., Clemhout and Wan (1970), Boldrin and Scheinkman (1988) and Young (1993). 45 See also Jovanovic (1982), Jovanovic and Rob (1990), Jovanovic and MacDonald (1994) and Jovanovic and Nyarko (1996). 46 See, e.g., Dewey (1997).
P. Auerswald et al. / Journal of Economic Dynamics & Control 24 (2000) 389}450
447
experimenting. These might include the output losses from pilot-project retrogressions,47 the opportunity costs of sampling other recipes, and perhaps additional resource costs of experimenting with distant recipes. Our model of learning by doing would become much more complicated (but more realistic) if production were more general. More than one input, more than one output, or non-constant returns to scale raise more urgently questions about the economic purposiveness of "rms. Decisions of what technology to adopt would then depend not only on the interconnections among the recipes and among their associated technologies, but they would also depend on expectations of future output prices, future factor prices, and future scales of production. Adding more foresight would then be necessary. To analyze the more general cases, we would have to go beyond this relatively simple combinatorial model. Our current model works for one input, one output, constant returns cases for which the focus is either the short term or the intermediate term. We believe that something like our recipes approach will also be essential to all models of technological evolution, but the modeling of recipes will have to be expanded to apply to more generalized production and market conditions. For the analysis of long-run aggregate productivity, the model must be expanded beyond the "nite recipe space to allow for the possibility of continuing productivity improvements. 7. For further reading Bahk and Gort, 1993 Acknowledgements We dedicate this paper to Ken Arrow and Bob Solow. We gratefully acknowledge the research support of the Santa Fe Institute and the following at Cornell University: National Science Foundation Grant SES-9012780, the Thorne Fund, the Center for Analytic Economics, and the Center for Applied Mathematics. We have bene"tted from the good advice and thoughtful comments of many colleagues including: Ken Arrow, Yves Balasko, Will Baumol, Larry Blume, Michael Cohen, Guido Cozzi, Avinash Dixit, Rick Durrett, Christian Duttweiler, David Easley, Theo Eicher, Charles Engel, Huberto Ennis, Duncan Foley, Rod Garratt, Christian Ghiglino, Aditya Goenka, Ralph Gomory, John Guckenheimer, Tom Holmes, Wim Hordijk, Boyan Jovanovic, Ken Judd, Alan Kirman, Jenny Li, Matt Mitchell, Dick Nelson, Yaw Nyarko, Salvador Ortigueira, Jim Peck, Bob Pollak, Luis Rivas-Anduray, Manuel Santos, JoseH Scheinkman, Bob Solow, Tim Volgelsang, and Henry Wan. We thank Gaetano 47 The parameter q could be thought of as the &Dewey parameter'. Increasing q } if possible } would lead to more retrogressions (the cost) but would also lead to more experimentation (the gain).
448
P. Auerswald et al. / Journal of Economic Dynamics & Control 24 (2000) 389}450
Antinol" and Todd Keister, who gave detailed and timely comments, and Melvyn Teo, who was an excellent research assistant. We are indebted to Bennett Levitan, the author of the basic program we used for our simulations, for allowing us to use his code and helping us to modify it.
References Abernathy, W.J., Wayne, K., 1974. Limits of the learning curve. Harvard Business Review, September}October, 109}119. Aghion, P., Howitt, P., 1998. Endogenous Growth Theory, MIT Press, Cambridge. Alchian, A., 1963. Reliability of progress curves in airframe production. Econometrica 31, 679}693. Argote, L., Epple, D., 1990. Learning curves in manufacturing. Science 247, 920}924. Arrow, K.J., 1962. The economic implications of learning by doing. Review of Economic Studies 29, 155}173. Arrow, K.J., Hahn, F., 1971. General Competitive Analysis. Holden-Day, San Francisco, CA. Auerswald, P., 1999. Organizational learning, intra"rm externalities and industry evolution. Ph.D. Thesis, University of Washington. Bahk, B.H., Gort, M., 1993. Decomposing learning by doing in new plants. Journal of Political Economy 101 (4), 561}583. Balo!, N., 1971. Extension of the learning curve } some empirical results. Operational Research Quarterly 22, 329}340. Benkard, C.L., 1998. Learning and forgetting: the dynamics of aircraft production, mimeo., Yale University. Boldrin, M., Levine, D.K., 1997. Competitive equilibrium growth. Mimeo. Boldrin, M., Scheinkman, J., 1988. Learning-by-doing, International trade and growth: a note. In: Anderson, P.W., Arrow, K.J., Pines, D. (Eds.), The Economy as an Evolving Complex System. Addison-Wesley, Reading, MA, 285}300. Bona, J.L., Santos, M.S., 1997. On the role of computation in economic theory. Journal of Economic Theory 72, 241}281. Caballe, J., Santos, M., 1993. On endogenous growth with physical and human capital. Journal of Political Economy 101 (6), 1042}1067. Chenery, H.B., 1949. Engineering production functions. Quarterly Journal of Economics 63, 507}531. Clemhout, S., Wan Jr., H., 1970. Learning-by-doing and infant industry protection. Review of Economic Studies 37(1), 33}56. Coase, R., 1937. The nature of the "rm. Economica 4, 386}405. Conley, P., 1970. Experience curves as a planning tool. IEEE Spectrum 7, 63}68. Conway, R.W., Schultz Jr., A., 1959. The manufacturing progress function. Journal of Industrial Engineering 10, 39}54. Debreu, G., 1959. Theory of Value: An Axiomatic Analysis of Economic Equilibrium, Wiley, New York. Dewey, J., 1997. How We Think. Dover Press, New York (Original 1910). Durlauf, S., 1993. Nonergodic economic growth. Review of Economic Studies 60, 349}366. Durrett, R., 1991. Probability: Theory and Examples. Duxbury Press. Dutton, J.M., Thomas, A., 1984. Treating progress functions as a managerial opportunity. Academy of Management Review 9 (2), 235}247. Epple, D., Argote, L., Devadas, R., 1991. Organizational learning curves: a method for investigating intra-plant transfer of knowledge acquired through learning by doing. Organization Science 2, 58}70.
P. Auerswald et al. / Journal of Economic Dynamics & Control 24 (2000) 389}450
449
Foley, D.K., 1998. Simulating long-run technical change, Mimeo. FoK llmer, H., 1974. Random economies with many interacting agents. Journal of Mathematical Economics 1, 51}64. Grossman, G.M., Helpman, E., 1991. Innovation and Growth in the Global Economy, MIT Press, Cambridge. Irwin, D., Klenow, P., 1994. Learning-by-doing spillovers in the semiconductor industry. Journal of Political Economy 102, 1200}1227. Jones, C.I., 1998. Introduction to Economic Growth. Norton. Jovanovic, B., 1982. Selection and the evolution of an industry. Econometrica 50, 659}670. Jovanovic, B., MacDonald, G., 1994. Competitive di!usion. Journal of Political Economy 102 (1), 24}52. Jovanovic, B., Nyarko, Y., 1995. A Bayesian learning model "tted to a variety of empirical learning curves. Brookings Papers on Economic Activity Micro issue, no.1, Brookings Institution, 247}305. Jovanovic, B., Nyarko, Y., 1996. Learning by doing and the choice of technology. Econometrica 64 (6), 1299}1310. Jovanovic, B., Rob, R., 1990. Long waves and short waves: growth through intensive and extensive search. Econometrica 58, 1391}1409. Judd, K., 1998. Numerical Methods in Economics and Finance. MIT Press, Cambridge. Kau!man, S., 1988. The Evolution of economic webs. In: Anderson, P.W., Arrow, K.J., Pines, D. (Ed.), The Economy as an Evolving Complex System. Addison-Wesley, Reading, MA, 125}146. Kau!man, S., 1993. Origins of Order: Self-Organization and Selection in Evolution. Oxford University Press, Oxford. Kau!man, S., Levin, S., 1987. Toward a general theory of adaptive walks on rugged landscapes. Journal of Theoretical Biology 128, 11}45. Knuth, D.E., 1981. The Art of Computer Programming. vol. 2: Seminumerical Algorithms. Addison-Wesley, Reading, MA. Lieberman, M.B., 1987. Patents, learning by doing, and market structure in the chemical processing industries. International Journal of Industrial Organization 5, 257}276. Lucas Jr., R.E., 1988. On the mechanics of economic development. Journal of Monetary Economics 22, 3}42. Lucas Jr., R.E., 1993. Making a miracle. Econometrica 61, (2). Muth, J., 1986. Search theory and the manufacturing progress function. Management Science 32, 948}962. Nelson, R.R., Phelps, E.S., 1966. Investment in humans, technological di!usion, and economic growth. American Economic Review 56, 69}82. Nelson, R.R., Winter, S., 1982. An Evolutionary Theory of Economic Change. Belknap, Harvard University Press, Cambridge, MA. Ray, D., 1998. Development Economics. Princeton University Press, Princeton, NJ. Romer, P.M., 1986. Increasing returns and long-run growth. Journal of Political Economy 94, 1002}1037. Romer, P.M., 1990. Endogenous technological change. Journal of Political Economy 98 (5), S71}S102. Romer, P.M., 1996. Why, indeed, in America? Theory, history and the origins of modern economic growth. American Economic Review 86 (2), 202}206. Shell, K., 1966. Toward a theory of inventive activity and capital accumulation. American Economic Review 56 (2), 62}68. Shell, K., 1967. A model of inventive activity and capital accumulation. In: Shell, K., (Ed.), Essays on the Theory of Optimal Economic Growth. MIT Press, Cambridge, pp. 67}85. Shell, K., 1973. Inventive activity, industrial organisation and economic growth. In: Mirrlees, J.A., Stern, N.H., (Eds.), Models of Economic Growth. Wiley, New York, pp. 77}100.
450
P. Auerswald et al. / Journal of Economic Dynamics & Control 24 (2000) 389}450
Smith, V.L., 1961. Investment and Production: A Study in the Theory of the Capital-Using Enterprise. Harvard University Press, Cambridge. Solow, R.M., 1994. Perspectives on growth theory. Journal of Economic Perspectives 8 (1), 45}54. Solow, R.M., 1997. Learning from &Learning by Doing': Lessons for Economic Growth. Stanford University Press. Stadler, P., Happel, R., 1995. Random "eld models for "tness landscapes. Working Paper 95-07-069, Santa Fe Institute. Stokey, N.L., 1988. Learning by doing and the introduction of new goods. Journal of Political Economy 96 (4), 701}719. Uzawa, H., 1965. Optimum technical change in an aggregative model of economic growth. International Economic Review 6 (1), 18}31. Webbink, D.W., 1977. The semiconductor industry: a survey of structure, conduct, and performance. Sta! Report, Bureau of Economics, Federal Trade Commission. Weitzman, M.L., 1996. Hybridizing growth theory. American Economic Review 86 (2), 207}212. Williamson, O., 1985. The Economic Institution of Capitalism: Firms, Markets and Relational Contracting. Free Press, New York. Wright, T.P., 1936. Factors a!ecting the cost of airplanes. Journal of the Aeronautical Sciences 2, 122}128. Yelle, L.E., 1979. The learning curve: historical review and comprehensive survey. Decision Sciences 10, 302}328. Young, A., 1993. Invention and bounded learning by doing. Journal of Political Economy 101 (3), 443}472.