Lalor et al.
Vol. 26, No. 11 / November 2009 / J. Opt. Soc. Am. A
B25
The relationship between optimal and biologically plausible decoding of stimulus velocity in the retina Edmund C. Lalor,1,* Yashar Ahmadian,2 and Liam Paninski2 1
Trinity Centre for Bioengineering and Institute of Neuroscience, Trinity College Dublin, College Green, Dublin 2, Ireland 2 Department of Statistics, Columbia University, 1255 Amsterdam Avenue, New York, New York 10027, USA *Corresponding author:
[email protected] Received January 30, 2009; revised June 14, 2009; accepted July 23, 2009; posted August 7, 2009 (Doc. ID 106996); published September 11, 2009 A major open problem in systems neuroscience is to understand the relationship between behavior and the detailed spiking properties of neural populations. We assess how faithfully velocity information can be decoded from a population of spiking model retinal neurons whose spatiotemporal receptive fields and ensemble spike train dynamics are closely matched to real data. We describe how to compute the optimal Bayesian estimate of image velocity given the population spike train response and show that, in the case of global translation of an image with known intensity profile, on average the spike train ensemble signals speed with a fractional standard deviation of about 2% across a specific set of stimulus conditions. We further show how to compute the Bayesian velocity estimate in the case where we only have some a priori information about the (naturalistic) spatial correlation structure of the image but do not know the image explicitly. As expected, the performance of the Bayesian decoder is shown to be less accurate with decreasing prior image information. There turns out to be a close mathematical connection between a biologically plausible “motion energy” method for decoding the velocity and the Bayesian decoder in the case that the image is not known. Simulations using the motion energy method and the Bayesian decoder with unknown image reveal that they result in fractional standard deviations of 10% and 6%, respectively, across the same set of stimulus conditions. Estimation performance is rather insensitive to the details of the precise receptive field location, correlated activity between cells, and spike timing. © 2009 Optical Society of America OCIS codes: 330.4060, 330.4150.
1. INTRODUCTION The question of how different attributes of a visual stimulus are represented by populations of cells in the retina has been addressed in a number of recent studies [1–8]. This field has received a major boost with the advent of methods for obtaining large-scale simultaneous recordings from multiple retinal ganglion neurons that almost completely tile a substantial region of the visual field [9,10]. The utility of this new method for understanding the encoding of behaviorally relevant signals was exemplified by [4], where the authors examined the question of how reliably visual motion was encoded in the spiking activity of a population of macaque parasol cells. These authors used a simple moving stimulus and attempted to estimate the velocity of that stimulus from the resulting spike train ensemble; this analysis pointed to some important constraints on the visual system’s ability to decode image velocity given noisy spike train responses. We will explore these issues in more depth in this paper. In parallel to these advances in retinal recording technology, significant recent advances have also been made in our ability to model the statistical properties of populations of spiking neurons. For example, a statistical model of a complete population of primate parasol retinal ganglion cells (RGCs) was recently described [7]. This model was fit using data acquired by the array recording techniques mentioned above and includes spike-history 1084-7529/09/110B25-18/$15.00
effects and cross-coupling between cells of the same kind and of different kinds (i.e., ON and OFF cells). The authors demonstrated that the model accurately captures the stimulus dependence and spatiotemporal correlation structure of RGC population responses, and allows several insights to be made into the retinal neural code. One such insight concerns the role of correlated activity in preserving sensory information. Using pseudorandom binary stimuli and Bayesian inference, they reported that stimulus decoding based on the spiking output of the model preserved 20% more information when knowledge of the correlation structure was used than when the responses were considered independently [7]. At the psychophysical level, Bayesian inference has been established as an effective framework for understanding visual perception [11]; some recent notable applications to understanding visual velocity processing include [12–17]. In particular, [14] argued that a number of visual illusions actually arise naturally in a system that attempts to estimate local image velocity via Bayesian methods (though see also [18,19]). Links between retinal coding and psychophysical behavior have also been recently examined using Bayesian methods; [20,21], for example, examine the contribution of turtle RGC responses to velocity and acceleration encoding. This study reported that the instantaneous firing rates of individual turtle RGCs contain information about © 2009 Optical Society of America
B26
J. Opt. Soc. Am. A / Vol. 26, No. 11 / November 2009
Lalor et al.
speed, direction, and acceleration of moving patterns. The firing-rate-based Bayesian stimulus reconstruction carried out in that study involved a couple of key approximations. These included the assumptions that RGCs generate spikes according to Poisson statistics and that they do so independently of each other. The work of [7] emphasizes that these assumptions are unrealistic, but the impact of detailed spike timing and correlation information on velocity decoding remains uncertain. The primary goal of this paper is to investigate the fidelity with which the velocity of a visual stimulus may be estimated, given the detailed spiking responses of the primate RGC population model of [7], using Bayesian decoders, with and without full prior knowledge of the image. We begin by describing the mathematical construction of the Bayesian decoders, and then compare these estimates to those based on a biologically plausible “net motion signal” derived directly from the spike trains without any prior image information [4]. We derive a mathematical connection between these decoders and investigate the decoders’ performance through a series of simulations.
2. METHODS A. Model The generalized linear model (GLM) [22,23] for the spiking responses of the sensory network used in this study was described in detail in [7]. It consists of an array of ON and OFF retinal ganglion cells (RGC) with specific baseline firing rates. Given the spatiotemporal image movie sequence, the model generates a mean firing rate for each cell, taking into account the temporal dynamics and the center-surround spatial stimulus filtering properties of the cells. Then, incorporating spike history effects and cross-coupling between cells of the same type and of the opposite type, it generates spikes for each cell as a stochastic point process. In response to the visual stimulus I, the ith cell in the observed population emits a spike train, which we represent by a response function ri共t兲 =
兺␣ ␦共t − t ␣兲,
冉
兺 h 共t − t 兲冊 , ij
Ji共t兲 =
冕冕
ki共t − ,n兲I共,n兲d2nd ,
共3兲
where ki共t , n兲 is the spatiotemporal receptive field of the cell i. The parameters for each cell were fit using 7 min of spiking data recorded during the presentation of a nonrepeating stimulus, with the baseline log firing rate being a constant and the various filter parameters being fit using a basis of raised cosine “bumps” [7]. Given Eq. (2), we can write down the point process log-likelihood in the standard way [27] log p共r兩I兲 ⬅
兺␣
log 共ti,␣兲 −
i,
兺冕 i
T
i共t兲dt.
共4兲
0
For movies arising from images rigidly moving with constant velocity v we have I共t,n兲 = x共n − vt兲,
共5兲
where x共n兲 is the luminance profile of a fixed image. Substituting Eq. (5) into Eq. (3) and shifting the integration variable n by v, we obtain Ji共t兲 =
冕
Ki,v共t;n兲x共n兲d2n,
共6兲
冕
共7兲
where we defined Ki,v共t;n兲 ⬅
ki共t − ,n + v兲d .
In the following we replace p共r 兩 I兲 with its equivalent p共r 兩 x , v兲 [since, via Eq. (5), I is given in terms of x and v] and use the short-hand matrix notation Ji = Ki,v · x for Eq. (6). An important point is that in the case of a convex and log-concave GLM nonlinearity, f共 · 兲 [conditions that are true for our choice, f共 · 兲 = exp共 · 兲], the GLM log-likelihood, Eq. (4), is a concave function of x共n兲.
共1兲
i,
where each spike is represented by a delta function, and ti,␣ is the time of the ␣th spike of the ith neuron. We use the shorthand notation ri and r for the response function of one neuron and the collective spike train responses of all neurons, respectively. The stimulus I represents the spatiotemporal luminance profile I共n , t兲 of a movie as a function of the pixel position n and time t. In the GLM framework, the intensity functions (instantaneous firing rate) of the responses ri are given by [7,24–26] i共t兲 ⬅ f bi + Ji共t兲 +
Ji共t兲 is obtained from I by linearly filtering the spatiotemporal luminance,
j,
共2兲
j,
where f共 · 兲 is a positive, strictly increasing rectifying function. As in [7], we adopt the choice f共 · 兲 = exp共 · 兲. The bi represents the log of the baseline firing rate of the cell, the coupling terms hij model the within- and between-neuron spike history effects noted above, and the stimulus input
B. Decoding In order to estimate the speed of the moving bar given the simulated output spike trains r of our RGC population, we employed three distinct methods. The first method involved a Bayesian decoder with full image information, the second method utilized a Bayesian decoder with less than full image information, while the third method involved an “energy-based” algorithm introduced by [4] that used no explicit prior knowledge of the image. For reasons that will become clear, these decoders will be hereafter known as the optimal decoder, the marginal decoder, and the energy method, respectively. Given a simulated output spike train ensemble, we use each of these methods to estimate the speed of the stimulus that evoked the ensemble by maximizing some function across a range of possible or “putative” speeds. 1. Bayesian Velocity Estimation To compute the optimal Bayesian velocity decoder we need to evaluate the posterior probability for the velocity
Lalor et al.
Vol. 26, No. 11 / November 2009 / J. Opt. Soc. Am. A
p共v 兩 r兲 conditional on the observed spike trains r. Given a prior distribution pv共v兲, from Bayes’ rule we obtain p共v兩r兲 =
p共r兩v兲pv共v兲
兺 ⬘ p共r兩v⬘兲p 共v⬘兲
共8兲
.
v
v
If the image x (e.g., a narrow bar with a luminance distinct from the background) is known to the decoder, then we can replace p共r 兩 v兲 with the likelihood function p共r 兩 x , v兲, obtaining p共v兩r,x兲 =
p共r兩x,v兲pv共v兲
兺 ⬘ p共r兩x,v⬘兲p 共v⬘兲
.
共9兲
v
v
p共r 兩 x , v兲 is provided by the forward model Eq. (4), and therefore computation of the posterior probability is straightforward in this case. Alternatively, if the image is not fully known, we represent the decoder’s uncertain a priori knowledge regarding x with an image prior distribution px共x兲. In this case, p共r 兩 v兲 is obtained by marginalization over x: p共r兩v兲 =
冕
p共r,x兩v兲dx =
冕
L共x,r,v兲 ⬅ log px共x兲 + log p共r兩x,v兲 +
共10兲
1 2
log共2兲d兩Cx兩, 共11兲
where d represents the number of pixels in our simulated image, and rewrite Eq. (10) as 1
冑共2兲d兩Cx兩
−
冕
冋 册
兺 兺␣ log 共t ␣ ;x,r兲 i
i
i,
i共t;x,r兲dt ,
共13兲
where i are given by Eqs. (2), (6), and (7), and we made their dependence on x and r manifest. Since both terms in Eq. (13) are concave (see the closing remarks in Subsection 2.A), the log-posterior L共x , r , v兲 is concave in x. To obtain the Laplace approximation, for fixed r, we first find the value of x that maximizes L (i.e., the image MAP, xMAP). When the integrand is sharply concentrated around its maximum, we can Taylor expand L around xMAP to the first nonvanishing order beyond the zerothorder (i.e., its maximum value) and neglect the rest of the expansion. Since at the maximum the gradient of L and hence the first-order term vanish, we obtain 1
L共x,r兲 ⬇ L共xMAP,r,v兲 − 2 共x − xMAP兲TH共r,v兲共x − xMAP兲, 共14兲 where the negative Hessian matrix
p共r兩x,v兲px共x兲dx.
Hence, we will refer to p共r 兩 v兲 as the marginal likelihood. Given the marginal likelihood, Eq. (8) allows us to calculate Bayesian estimates for general velocity priors. The prior distribution px共x兲 which describes the statistics of the image ensemble, can be chosen to have a naturalistic correlation structure. In our simulations in Section 3 we use a Gaussian image ensemble with power spectrum matched to observations in natural images [28,29]. In general, the calculation of the high-dimensional integral over x in Eq. (10) is a difficult task. However, when the integrand p共r , x 兩 v兲 is sharply peaked around its maximum [which is the maximum a posteriori (MAP) estimate for x—as the integrand is proportional to the posterior image distribution p共x 兩 r , v兲 by Bayes’ rule] the socalled “Laplace” approximation (also known as the “saddle-point” approximation) provides an accurate estimate for this integral [for applications of this approximation in the Bayesian setting, see e.g., [30]]. The Laplace approximation in the context of neural decoding is further discussed in, e.g., [31–35]. We briefly review this approximation here. Following [29], we consider Gaussian image priors with zero mean and covariance Cx chosen to match the power spectrum of natural images [28]. Let us define the function
p共r兩v兲 =
1
L共x,r,v兲 = − 2 xTC−1 x x+
B27
冕
eL共x,r,v兲dx.
H共r,v兲 ⬅ 兩 − ⵜxⵜxL共x,r,v兲兩x=xMAP ,
is positive semidefinite due to the maximum condition. Exponentiating this yields the Gaussian approximation (up to normalization) eL共x,r,v兲 ⬀ p共x兩r,v兲 ⬇ N共xMAP共r,v兲,Cx共r,v兲兲,
Using Eq. (4) and px共x兲 = N共0 , Cx兲, we obtain the expression
共16兲
where N共 , C兲 denotes a Gaussian density with mean and covariance C for the integrand of Eq. (12). [An important technical point here is that this Gaussian approximation is partially justified by the fact that the logposterior (13) is a concave function of x [24,26,34] and therefore has a single global optimum, like the Gaussian (16).] Here, the posterior image covariance Cx共r , v兲 is given by the inverse of the negative Hessian matrix H共r , v兲. (Note the dependence on both the observed responses r and the putative velocity v.) The elementary Gaussian integration in Eq. (12) then yields p共r兩v兲 ⬇
e−L共xMAP共r,v兲,r,v兲
冑兩CxH共r,v兲兩
共17兲
for the marginal likelihood, or its logarithm log p共r兩v兲 ⬇ − L共xMAP共r,v兲,r,v兲 −
1 2
log兩CxH共r,v兲兩. 共18兲
The MAP itself is found from the condition ⵜxL = 0, which in the case of exponential GLM nonlinearity f共 · 兲 = exp共 · 兲 yields the equation xMAP共n;r,v兲 =
冕
d2n⬘Cx共n,n⬘兲
兺 i
− i共t;xMAP,r兲兴dt. 共12兲
共15兲
冕
Ki,v共t;n⬘兲关ri共t兲 共19兲
Note that this equation is nonlinear due to the appearance of xMAP inside the GLM nonlinearity on the righthand side. As mentioned above, the objective function Eq. (11) is concave and can be efficiently optimized using
J. Opt. Soc. Am. A / Vol. 26, No. 11 / November 2009
Lalor et al.
˜ri共t兲 = w쐓ri =
兺␣ e
−共t − ti,␣兲2/22
.
共20兲
Then, the “energy” function for the entire population of cells is determined by the sum of the overlaps of the
E共v,r兲 =
兺 i,j
=
冕冉 冊冉 冊 ˜ri t +
ni v
˜rj t +
冕 冋 兺 冉 冊册 ˜ri t +
i
ni v
nj v
dt
2
共21兲
dt.
In order to cancel the effect of spontaneous activity of the cells, in [4] a “net motion signal” N共v , r兲 is obtained by subtracting energy of the left-shifted spike trains from that of the right-shifted responses: N共v,r兲 ⬅ E共v,r兲 − E共− v,r兲.
共22兲
Finally, N共v , r兲 is calculated for v across a range of putative velocities, and the value that maximizes the net motion signal is taken as the velocity estimate. Figure 1 illustrates the basic idea of this method for ON cells, although it should be noted that OFF cells are also included in our analysis. 3. Connection between the Bayesian and Energy-Based Methods An interesting connection can be drawn between Bayesian velocity decoding and the method of Subsection 2.B.2 based on the energy function Eq. (21). For simplicity, 1 11 2
(A)
(B)
Raw responses at 14.4°/s, ON cells
Cell #
1
100 Time (sec) 0 1 (C) Putative speed 7.2°/s, ON cells 1 Cell #
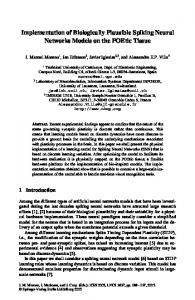
2. Velocity Estimation Using the Energy Method In order to assess the precision of our Bayesian estimates of velocity, we compared our estimates to those obtained using the correlation-based algorithm described in [4]. This algorithm closely resembles the spatiotemporal energy models for motion processing introduced by [36]. In order to understand the rationale behind this method, assume, hypothetically, that all the cells have exactly the same receptive fields up to the positioning of their centers and that they respond reliably and without noise to the stimulus. Then the RGCs’ spike trains ri in response to moving images would clearly be identical up to time translations. In other words, ri共t + ni / v兲 would be equal for all i, where ni is the center position of the ith cell’s receptive field along the axis of motion, and v is the magnitude of v. Thus even in the realistic, noisy situation, we expect the ri for different i to have a large overlap if they are shifted in time as described, and in principle, we should be able to recover the true velocity by maximizing a smoothed version of this overlap. Inspired by this observation, an energy function is constructed as follows. First, the spike trains are convolved with a Gaussian filter w共t兲 ⬀ exp共−t2 / 22兲 (we chose to be 10 ms; see below and [4]). Let us define
shifted and smoothed responses of all cells [37],
100 Time (sec) 0 1 (D) Putative speed 14.4°/s, ON cells 1 Cell #
gradient-based optimization algorithms, such as the Newton–Raphson method. In particular, by exploiting the quasi-locality of the GLM likelihood we can implement the Newton–Raphson method such that, in cases where the image x共n兲 depends only on one component of n, the MAP can be found in a computational time scaling only linearly with the spatial size of the image (see Appendix B for further elaboration on this point). Once xMAP is found, the Hessian at MAP and Eq. (17) can be calculated easily, and using Eq. (17), the approximate computation of p共r 兩 v兲 is complete. To recapitulate, in the case of an a priori uncertain image, given the observed spike trains r, we numerically find xMAP共r , v兲 for a range of putative velocities v and using Eq. (17), we compute p共r 兩 v兲, from which we may obtain p共v 兩 r兲 via Eq. (8). We then take the value of velocity v쐓 that maximizes p共v 兩 r兲 as the estimate; i.e., we use the MAP estimate for the velocity. As discussed in Section 1, our goal here was to critically examine the role of the detailed spiking structure of the GLM in constraining our estimates of the velocity. Since the spiking network model structure enters here only via the likelihood term p共r 兩 v兲, we did not systematically examine the effect of strong a priori beliefs p共v兲 on the resulting estimator (as discussed at further length, e.g., in [14]). Instead we used a simple uniform prior on velocity, which renders the MAP velocity estimate equivalent to the maximum (marginal) likelihood estimate, i.e., the value of v that maximizes p共r 兩 v兲 given by the approximation Eq. (17) [or equivalently, its logarithm Eq. (18)]. Similarly, in the case of a priori known image x we chose the velocity v that maximizes the likelihood p共r 兩 x , v兲.
100 0 (E)
Time (sec) 1 Putative speed 28.8°/s, ON cells
1 Cell #
B28
100 0
Time (sec)
1
Fig. 1. Ensemble motion signals. (A) Moving bar stimulus and cell layout. Cells in the left most column are numbered 1–10 from top to bottom, cells in the second column are numbered 11–20 from top to bottom, etc. (B) Raw responses from the ON cells for a moving bar with speed 14.4° / s. Each tick represents one spike and each row represents the response of a different cell. (C)–(E) Same spike trains circularly shifted by an amount equal to the time required for a stimulus with the indicated putative speed to move from an arbitrary reference location to the receptive field center. Responses from OFF cells were also included in this procedure.
Lalor et al.
Vol. 26, No. 11 / November 2009 / J. Opt. Soc. Am. A
imagine that spike trains are generated not by the GLM, but rather by a simpler linear-Gaussian (LG) model. In this case, it turns out that the marginal likelihood method is closely related to the energy function method described above. Specifically, we model the output spike trains as ri = bi + Ki,v · x + ⑀i ,
共23兲
where the noise term is Gaussian ⑀i ⬃ N共0 , ⌺兲. In the case that the noise terms for different cells are independent, we have pLG共r 兩 x , v兲 = 兿iN共bi + Ki,v · x , ⌺兲, though the generalization to correlated outputs is straightforward. We show in Appendix A that in a certain regime the logarithm of the LG marginal likelihood is given by [see Eqs. (A7) and (A8) and Eq. (A18)] log pLG共r兩v兲 =
1
2兺 i,j
冕 冉 冊冉 冊 Ri t +
ni v
Rj t +
nj v
dt + A共v兲, 共24兲
where A共v兲 has no dependence on the observed spike trains and only a weak dependence on v. We find empirically that the term A共v兲 in Eq. (24) grows with velocity, and therefore its inclusion shifts value of the maximum likelihood estimate toward higher velocities. Conversely, its absence in the energy function Eq. (21) causes the energy method estimate to have a negative bias. See Fig. 5 for an illustration of this effect. The resemblance of the remaining term to Eq. (21) above is clear. Here, Ri are smoothed versions of the spike trains ri (with the baseline log firing rate subtracted out) and are given, as in Eq. (20), by Ri = wLG ⴱ 共ri − bi兲,
共25兲
where here the optimal smoothing filter wLG is determined by the receptive fields ki, the prior image correlation statistics, and the velocity [its explicit form is given in Eq. (A21) in Appendix A], as we discuss in more depth below. Thus maximizing the marginal likelihood Eq. (24) is, to a good approximation, equivalent to maximizing the energy Eq. (21). The major difference between Eq. (21) and Eq. (24) is in the filter we apply to the spike trains: ˜ri has been replaced by Ri. The key point is that Ri depends on the stimulus filters ki, the velocity v, and the image prior in an optimal manner, unlike the smoothing in Eq. (20). (Note that, while changes in optimal filters at differing light levels have been discussed in terms of motion estimation in fly vision [38], no account of varying light levels was taken here.) The dependence of this optimal filter as a function of v can be explained fairly intuitively, as we discuss at more length in Appendix A following Eq. (A21). We find that w, the time scale of the smoothing filter wLG, is dictated by three major time scales, some of which depend on the velocity v: k, the width of the time window in which each RGC integrates its input; lk / v, where lk is the spatial width of the receptive field; and lcorr / v where lcorr is the correlation length of natural images. At low velocities, lk / v and lcorr / v are large, and the smoothing time scale w is also large, since in this case we gain more information about the underlying firing rates by averaging over a longer time window. At high velocities, on the other
B29
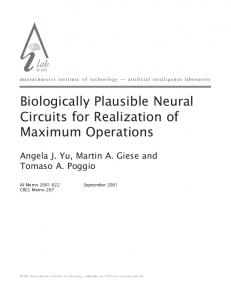
hand, k dominates lk / v and lcorr / v, and w ⬃ k. This setting of w makes sense because although the image movie I can vary quite quickly here, the filtered input Ji共t兲 induces a firing rate correlation time of order k, and examining the responses at a temporal resolution finer than k only decreases the effective signal-to-noise. Figure 2 illustrates these effects by plotting the optimal smoothing filters wLG for several different values of the velocity v. Interestingly, in the high-velocity limit, the analytically derived optimal temporal filter width w is of the order of 10 ms, which was the value chosen empirically for the optimal Gaussian filter used in [4]. We recomputed the optimal empirical filter for our simulated data here by plotting the standard deviation of the velocity estimates obtained using the net motion signal [defined in Eq. (22)] against the filter width (Fig. 3). For this velocity 共28.8° / s兲 the optimal filter is of the order of 10 ms; thus, we used a filter of width 10 ms when comparing the energy method to the Bayesian decoder. To summarize, maximizing the likelihood marginalized over the unknown image is very closely related to maximizing the energy function introduced by [4], if we replace the GLM with the simpler linear Gaussian model. Since the actual spike train generation is much better modeled by the GLM than by the Gaussian model, we expect Bayesian velocity estimation (even with uncertain prior knowledge of the image) based on the correct GLM to be more accurate. This expectation is borne out by our simulations, though it is worth noting that the improvement is significantly smaller than when the Bayesian decoder has access to the exact image. C. Simulations We simulated the presentation of a bar moving across the gray background of a CRT monitor refreshing at 120 Hz.
Fig. 2. Optimal linear spike train filter wLG for a range of velocities from 0.2° / s to 28.8° / s (bottom) in exponential steps. The y axes are scaled in dimensionless units for clarity here. As discussed in Subsection 2.B.3, there are three time scales that determine the time scale of our filter wLG. At low velocities, shown in the upper panels, the width of w共t兲 is determined by the two scales xk / v and xcorr / v and is thus quite large (since the denominator v is small). At the higher velocities shown in the lower panels, the optimal filter width is dominated by the time scale of the receptive field k, and is of the order of k, which is ⬃10– 20 ms. For even higher velocities the shape of this filter remains essentially the same as in the bottom panel.
J. Opt. Soc. Am. A / Vol. 26, No. 11 / November 2009
Standard deviation
B30
0.2
0.1
0.001
0.01
0.1
Filter width (s)
Fig. 3. Effect of filter width w on the standard deviation of velocity estimates [obtained using the signal defined in Eq. (22)] across 100 presentations of a black bar moving at a speed of 28.8° / s across a gray background. Note that a filter width of w ⬇ 10 ms is optimal, in agreement with the findings of [4] and with the width of the optimal filter shown in Fig. 2.
The spatial profile of the bar in the direction of motion was a Gaussian function with a standard deviation (SD) of 96 m. The visual field was represented by a grid of 100⫻ 100 pixels covering the receptive fields of two layers of cells each arranged in a uniform 10⫻ 10 grid. One layer consisted of ON cells, while the other represented OFF cells. The pixel resolution used was 10 times that used in [7] resulting in a pixel size of 12 m. The bar moved across the visual field in discrete steps of v pixels/refresh, although v was not restricted to integer values. On each trial, the bar traversed the entire visual field once at a constant velocity. (Therefore, low-velocity trials lasted longer than high-velocity trials; this will affect some of our analyses below.) Stimulus dimensions and speeds were converted to degrees/second using the approximation 200 m / ° [39] with a pixel size of 12⫻ 12 m. This meant that, with a refresh rate of 120 Hz, a speed of 1 pixel/refresh corresponded to a speed of 7.2° / s. Then, to investigate the fidelity with which speed was encoded by our model, we ran simulations using a variety of stimulus parameter settings. Specifically, we conducted 100 trials at each of 48 stimulus conditions. These 48 conditions were made up of eight speeds (10.8, 14.4, 21.6, 28.8, 36.0, 43.2, 50.4 and 57.6° / s) by six luminance levels (0, 0.125, 0.25, 0.75, 0.875 and 1 on a grayscale level where 0 is black and 1 is white, and the background level was set at 0.5). We also refer to the six different luminance levels in terms of the contrast of the bar with respect to the background. More precisely we define the contrast as 共Ibar − Ibackground兲 / Ibackground, where Ibar and Ibackground denote the bar and the background luminance, respectively. These six luminance levels thus become contrast levels −1, −0.75, −0.5, 0.5, 0.75, and 1. For each of these trials, we obtained a set of spike trains r. From these spike trains, it was possible to estimate the speed of the stimulus used as being one of a number of putative speeds. The putative speeds tested in our simulations ranged from 7.2 to 108° / s in steps of 0.36° / s. Thus, we could compare speed estimates across stimulus conditions by examining the SD of estimates across the 100 trials performed for each condition. As in [4], we focused on the fractional SD (SD of velocity esti-
Lalor et al.
mate divided by the true stimulus speed) of estimates to assess the fidelity of retinal speed signals, as any systematic bias in speed estimate can in principle be compensated for by downstream processing. However, we will also present the dependence of the estimate bias on stimulus condition. As will be seen, the fractional bias and the fractional SD are roughly of the same order and thus both contribute to the total root-mean-square fractional error of the velocity estimate. The latter is given by the square root of the sum of the squared fractional bias and squared fractional SD. It should be noted that other contrast levels between −0.5 and 0.5 were also tested but are not presented, as for some combinations of decoder and speed, the velocity estimation performance at these low contrasts was not significantly above chance. As outlined above, we used three different decoding methods to estimate the stimulus velocity from the simulated spike train ensembles; we compared Bayesian velocity decoding with (optimal decoder) and without (marginal decoder) complete prior information about the image with velocity estimation using the energy method. In particular, in Subsection 3.A.4 we discuss the effect of prior image uncertainty on the performance of the Bayesian decoder in more detail. In order to parametrically vary the prior information available to the decoder, in the simulations used in that section, the image was flashed a number of times to the cells while it was held fixed, and the image prior p共I兲 was updated according to the observed spike train data elicited by the flashes (no preview flashes were used in the simulations discussed in other sections). See Fig. 6(b) below for an illustration of this procedure. Short flashes were used instead of a continuous uninterrupted presentation, because in the latter case, the cells rapidly filter out the fixed image contrast, and thus after a brief interval 共 ⬃ 20– 30 ms兲, the spike trains cease to carry extra information about the image. The more times the image is flashed, the smaller the decoder’s uncertainty Cx when the image starts moving. This allows the decoder to better estimate the velocity when it finally sees the same image in motion.
3. RESULTS A. Comparison of the Different Velocity Decoders In this section we compare the performance of the energy model with the optimal and marginal decoders, as described in Section 2. Figure 4(a) plots the velocity posterior p共v 兩 r , x兲 for the case of an a priori known image (the moving bar described above) given a specific observed population spike train r in response to the moving bar stimulus as a function of putative stimulus speed v. Here, the true stimulus speed was 36.0° / s. Figure 4(b) shows the log of the marginal likelihood in the case where the image is not completely known, and Fig. 4(c) shows the value of the net motion signal N again as a function of putative speed and for the same stimulus. All three decoders successfully estimated the speed in the trial shown; however, it is clear from the figure that the net motion signal is much less sharply peaked around the stimulus speed than for the Bayesian decoders. The consequences of these findings are reflected in the lower panels of Fig. 4, which show that the distribution of speed estimates
Lalor et al.
Vol. 26, No. 11 / November 2009 / J. Opt. Soc. Am. A (B)
(C)
28.8
32.4
36
39.6
43.2
46.8
28.8
Speed (°/s)
32.4
36
39.6
43.2
46.8
28.8
Speed (°/s) (E)
(F)
25
15
15
15
5 0
Trials
20
10 5
29 32 35 38 41 44
Speed estimate (°/s)
0
36
39.6
43.2
46.8
25
20
10
32.4
Speed (°/s)
20
Trials
Trials
(D) 25
Net motion signal
Marginal Likelihood
Marginal Likelihood
(A)
B31
10 5
29 32 35 38 41 44
Speed estimate (°/s)
0
29 32 35 38 41 44
Speed estimate (°/s)
Fig. 4. Optimal decoder leads to the most precise velocity estimates, while the marginal decoder outperforms the energy-based “net motion signal” method, in terms of precision. (A) Posterior for the optimal decoder. (B) Log marginal likelihood for the marginal decoder. (C) Net motion signal N as a function of putative stimulus speed v for spike trains generated using a stimulus with speed 36.0° / s and contrast −0.5 for a trial where all methods successfully estimate the stimulus speed. It can be seen that the nonmarginal likelihood (A) is more sharply peaked around the stimulus speed than the marginal likelihood (B) and the net motion signal (C). Distribution of speed estimates across 100 presentations of a bar moving at a speed of 36.0° / s using (D) the optimal posterior probability, (E) the marginal likelihood, and (F) the net motion signal. Also plotted are Gaussian fits to the distributions with mean± SD of 35.76± 0.81 for the optimal decoder, 37.1± 3.05 for the marginal decoder, and 36± 6.09 for the net motion signal.
across 100 presentations of a bar of contrast −0.5 moving at a speed of 36.0° / s is most precise using the optimal decoder [Fig. 4(d)], rather than either the marginal decoder (E) or the energy method (F). Also plotted are Gaussian fits to the distributions with a mean ±SD of 35.76± 0.81° / s for the optimal decoder, 37.1± 3.05° / s for the marginal decoder and 36± 6.09° / s for the net motion signal. The fractional SD averaged across all conditions simulated in this study was 1.6% of the stimulus speed for the optimal decoder, 6.4% for the marginal decoder, and 10% of the stimulus speed for the energy method. Since the estimators are not unbiased, their root-meansquare error is larger than their SD, as the error receives a contribution from the bias as well. The root-meansquare fractional errors averaged across all stimulus conditions were 2%, 6.9%, and 11%, for the optimal decoder, marginal decoder and the energy method, respectively. Because the velocity estimation based on the energy method does not make use of the image profile at any stage, these results are as expected with the performance of the marginal decoder being intermediate between that of the optimal decoder and the energy method. 1. Accuracy as a Function of Stimulus Speed Because in our simulations the moving bar stimulus makes only one pass over the visual field, more time is spent traversing the field and more spike train information is obtained for slower moving stimuli. Figure 5(a) illustrates the fractional SD of 100 speed estimates for both of the Bayesian methods and the energy method, at each
of the eight stimulus speeds, averaged across the six contrast levels. As expected, performance declines with increasing speed for all three methods. The Bayesian decoders provide more precise estimates than the energy method at all speeds. Again, the advantage of the Bayesian decoder over the energy method is partly lost when its prior information about the image is uncertain. 2. Accuracy as a Function of Stimulus Contrast Lowering the contrast of the moving bar causes a reduction in the number of stimulus-related spikes generated by the GLM model, according to Eqs. (2) and (3). As with increasing stimulus speed, this obviously results in a reduction in stimulus-related information with which to estimate the stimulus speed. (Note that the model of [7] lacks explicit luminance-or contrast-gain control effects; thus, these results should be interpreted in terms of local modifications around a fixed luminance pedestal that are sufficiently small to avoid engaging classical luminance gain-control mechanisms.) To examine this relationship, we averaged the SD of the 100 speed estimates at each of the six contrast levels across the eight stimulus speeds. The results are shown in Fig. 5(b) and illustrate the expected increase in performance with increasing stimulus contrast. Again, the Bayesian decoders clearly outperform the energy method at all levels. 3. Effect of Contrast and Speed on Mean Speed Estimate While we were primarily concerned with the precision of speed estimates in the current study, a number of well-
B32
J. Opt. Soc. Am. A / Vol. 26, No. 11 / November 2009
Lalor et al.
(A)
(B) 0.35 Bayesian: Known Image Bayesian: Uncertain Image Energy Method
0.3 0.25 0.2 0.15 0.1 0.05 0
14.4
28.8
43.2
Fractional SD of speed estimate
Fractional SD of speed estimate
0.35
0.25 0.2 0.15 0.1 0.05 0
57.6
Bayesian: Known Image Bayesian: Uncertain Image Energy Method
0.3
−1
Stimulus Speed (°/s)
0.6
1
Stimulus Contrast
(C)
(D) Bayesian: Known Image Bayesian: Uncertain Image Energy Method
0.15 0.1 0.05
0.1 0.05 0
*
0
Bayesian: Known Image Bayesian: Uncertain Image Energy Method
0.15
(〈v 〉−v)/v
(〈v*〉−v)/v
−0.6
−0.05
−0.05
−0.1
−0.1
−0.15
−0.15 14.4
28.8
43.2
57.6
Stimulus Speed (°/s)
−1
−0.6
0.6
1
Stimulus Contrast
Fig. 5. Fractional standard deviation of speed estimates versus (A) stimulus speed and (B) stimulus contrast for the Bayesian decoder with full image information (optimal decoder), the Bayesian decoder with incomplete image information (marginal decoder), and the energy method. (C), (D) plot the difference between the mean estimated speed 具v쐓典 and the true stimulus speed v normalized by v against the true stimulus speed and stimulus contrast, respectively. Note that the Bayesian decoder provides more precise estimates than the energy method at all levels, with performance improving with prior image information. Furthermore, it should be noted that for contrasts lower than ±0.5, particularly at high speeds, the dearth of information in the spike train ensemble resulted in the estimate from an inordinate number of trials being either the highest or lowest input putative speed. Accordingly, performance for s in this range were not calculated and not plotted.
researched visual phenomena concerning the relationship between the mean visual speed perceived, i.e., the bias, and the properties of the visual stimulus prompted us to investigate this in our simulations. The first phenomenon of interest was that in which humans tend to choose the slowest motion that explains the incoming information [40], i.e., we have a bias toward slower speeds. As can be seen in Fig. 5(c), the energy method is biased toward lower velocity estimates at higher stimulus speeds. The optimal decoder shows a very slight tendency in this direction also. On the other hand, the marginal decoder has a positive bias toward higher velocities. The second phenomenon of interest was that in which stimuli with low contrast are typically perceived as moving slower than those with high contrast [41,42]. Figure 5(d) plots the fractional bias of the speed estimate, i.e., the difference between the true stimulus speed v and the mean estimated speed 具v쐓典 normalized by v, versus the stimulus contrast for both the Bayesian decoder and the energy method against the stimulus contrast, averaged across all speeds tested in our simulations. There appears to be a slight trend toward greater bias at low contrast, although it should be noted that this is due to a strong bias at low
negative contrast, while at low positive contrast, the bias is close to zero. The fact that the fractional SD of the speed estimate at this low negative contrast value is so large makes it difficult to say anything definitive about a relationship between stimulus contrast and speed estimate bias. It is important to remember that a uniform prior on velocity was used in this study when considering the lack of any clear effect.
4. Effect of Prior Image Information Here we discuss the effect of preview flashes of the fixed image on the velocity decoding performance of the marginal decoder. As mentioned above, the more times the image is flashed or “shown” to the cells, the less will be the decoder’s uncertainty about it and the better the velocity estimate made by the decoder when it finally sees the same image in motion. This effect is shown in Fig. 6 where panel (A) shows the decrease in the relative error of the velocity estimate as the number of flashes increases. For a large number of flashes the error asymptotically reaches the level for the fully known image
Lalor et al.
Vol. 26, No. 11 / November 2009 / J. Opt. Soc. Am. A
B33
Fig. 6. Effect of decreasing image uncertainty on accuracy of Bayesian velocity estimation. See Subsection 2.C for a detailed description of this simulation. (A) The solid curve with error bars shows the drop in the fractional rms error of the velocity estimate for an a priori unknown image as the number of preview flashes increases. The dashed curve is the fractional error for the case of an a priori known image. The true velocity was 28.8° / sec and the bar contrast 0.6. (B) The plots show the maximum a posteriori estimate of the image luminance profile (solid curve) in four trials with different numbers of preview flashes (indicated below each plot). The gray areas indicate the marginal uncertainty of the estimated luminance, and the dashed curve shows the actual image profile.
(shown by dashed curves). Panel (B) shows the convergence of the estimated luminance profile xMAP to that of the actual bar image as the number of preview flashes increases. Figure 6 shows this effect for a particular stimulus velocity and contrast, but we note that the effect is qualitatively the same for all other values of these stimulus parameters; as the number of flashes increases beyond a few, the accuracy of the marginal decoder’s estimate approaches that of the optimal decoder’s. As seen here and above, the efficiency of the GLMbased Bayesian decoder can be significantly deteriorated when the prior information about the image is too incomplete. As we showed in Subsection 2.B.3, Bayesian decoding with uncertain prior image information is, except for the replacement of the GLM with the LG model, closely related to the energy model. Indeed, in our simulations, the disparity between the performances of the energy model and those of the GLM-based Bayesian decoder was largely lost when the latter decoder’s prior knowledge of the image became too uncertain.
B. Effects of Manipulating Model Parameters 1. Importance of Correlation Between Cells In order to investigate the importance of correlated activity between cells, we wished to remove the interaction between neighboring spike trains without reducing the overall spiking rate. We used a straightforward trialshuffling approach: we generated 200 individual spike trains, one for each cell, using 200 distinct presentations of the stimulus to the full model. We then constructed a single trial surrogate population spike train by serially assigning each independent spike train recorded on simulated trial i as the observed spike train in cell i. We repeated this 100 times to obtain spike ensembles repre-
senting 100 trials for each of the 48 conditions mentioned above (i.e., eight different speeds and six different contrast levels). This allowed us to determine the fractional standard deviation of the speed estimate for each of the 48 different stimulus conditions. It should be noted that this (somewhat involved) procedure was carried out in preference to simply removing the coupling between cells, as that would have resulted in a different average number of population wide spikes compared with the output from the full model, which would have had a confounding effect on the results. The results are shown in Figs. 7(a)–7(c) for the optimal decoder, marginal decoder and the energy method, respectively, and are plotted versus the fractional standard deviation of the speed estimate for the same 48 conditions using the spike train ensembles obtained directly from the model. The diagonal lines indicate equality between the fractional SD of the speed estimates obtained using the shuffled responses and that obtained directly from the model. Somewhat surprisingly, given the significant correlations in this data (cf. Fig. 2 in [7]), this trial-shuffling procedure did not significantly hurt the performance of any of the three velocity estimators. For the marginal decoder, there is a noticeable reduction in performance for those stimulus conditions with more precise speed estimates, while for conditions with higher fractional SD, most points lie just below the line. However, for the other two decoders, if anything, there is a slight bias in Fig. 7(a) and 7(c), with data points tending to lie a bit below the identity line in both plots, indicating that the shuffling procedure happened to lead to velocity estimates with slightly reduced variability. These results are consistent with the conclusions of [2], that treating retinal ganglion cells as independent encoders leads only to a minor loss of information.
B34
J. Opt. Soc. Am. A / Vol. 26, No. 11 / November 2009
(A)
Fractional SD of speed estimate
Lalor et al.
Fractional SD of speed estimate
(B)
(C)
0.1
Fractional SD of speed estimate
0.1
0.01
0.01
Shuffled
Shuffled
Shuffled
0.1
0.01
0.1
0.01
Regular
(D)
0.1
0.01
Regular
Fractional SD of speed estimate
(E)
0.1
Regular
Fractional SD of speed estimate
(F)
Fractional SD of speed estimate
0.1
0.01
0.01
0.1
0.1
Resampled
Resampled
0.1
Resampled
0.01
0.01
0.01
Regular
0.1
Regular
0.01
0.01
0.1
Regular
Fig. 7. Effect of correlated activity and spike timing structure on speed estimates. Fractional SD of speed estimates using shuffled responses plotted as a function of that obtained using regular simulated data for (A) the Bayesian decoder with full image information, (B) the Bayesian decoder with incomplete image information, and (C) the energy method. Fractional SD of speed estimate using resampled spike trains plotted as a function of that obtained using regular simulated data for (D) the Bayesian decoder with full image information, (E) the Bayesian decoder with incomplete image information, and (F) the energy method. Diagonal lines indicate equality. Each circle represents a different one of the 48 speed-by-contrast stimulus conditions. Note that the performance of the decoders is relatively unaffected by these rather drastic manipulations of spike timing.
2. Timing Structure of Spike Trains The question of whether cell spiking activity can be accurately modeled as a simple Poisson process with a timevarying rate or whether the intrinsic temporal structure of retinal spike trains plays an important role in communication has a long history in systems neuroscience. Simulations with the retinal ganglion cell model used in this study have demonstrated that preserving the spike history and cross-coupling effects can increase stimulus decoding performance by up to 20% [7]. We wished to examine the effect of removing the specific timing information of the individual spike trains. This was carried out using the method of [4]. Specifically, we generated a spike train for each cell for 100 trials of the moving bar stimulus. We then randomly selected spike times for each cell, with replacement, from that cell’s spike distribution [its peri-stimulus time histogram (PSTH)], such that the number of spikes in each resampled spike train was equal to the average number of spikes in the corresponding original spike trains. This results in a spike train for each cell where spikes occur according to the marginal mean firing rate only, with no consideration given to spike history effects such as action potential refractoriness. Note that this process is even more disruptive of spike timing information than the shuffling procedure described in the previous subsection, since now we are destroying spike train structure both between and within cells. Again, this convoluted process was carried out in preference to simply removing the spike history filters hij from the model before generating the spike trains, as removal of those fil-
ters would have resulted in a greater number of total spikes and would thus have resulted in a misleadingly good speed estimation performance. This process of generating a spike train ensemble through resampling was carried out for each of the 48 stimulus conditions mentioned above. The results are shown in Figs. 7(d)–7(f) for the optimal decoder, marginal decoder and the energy method, respectively, and are plotted versus the fractional standard deviation of the speed estimate for the same 48 conditions using spike train ensembles obtained directly from the model. Once again, the effects of this spike timing disruption on the performance of the velocity estimators was fairly minimal, with the resampled spike trains appearing to give a marginally worse performance as indicated by the preponderance of data points slightly above the identity line. Again for the marginal decoder the decreased performace is more pronounced for stimulus conditions with better performance. 3. Parameters of Cell Population In the simulations above, two simple assumptions were made about the parameters of the cell population. First, the cells were arranged in an oversimplistic grid as in Fig. 8(a). And second, all ON cells were given a baseline log firing rate [bi in Eq. (2)] of 2 spikes/ s and all OFF cells a baseline log firing rate of 3 spikes/ s, corresponding to the mean values obtained when fitting the model [7]. In order to examine a somewhat more biologically realistic case we jittered the center location of the cells as in Fig. 8(b) and
Lalor et al.
Vol. 26, No. 11 / November 2009 / J. Opt. Soc. Am. A
randomly selected the baseline log firing rates of the ON and OFF cells from uniform distributions on intervals 1 to 3 spikes/ s and 1.5 to 4.5 spikes/ s, respectively. Figure 9 illustrates the speed estimates over 100 trials for a stimulus with speed of 28.8° / s and contrast of −1 using the regular cell arrangement and uniform baseline log firing rates (left column) versus the jittered cell arrangement and random baseline log firing rates (middle column) for all three methods. The performances of the optimal decoder, marginal decoder and energy method are shown in the top, middle, and bottom row, respectively. No significant difference in performance between the regular and jittered arrangements is apparent for any method. While randomly jittering the baseline log firing rates around the mean caused no obvious change in estimation accuracy, this does not allow us to comment on the pos-
(B)
100
100
50
50
y
y
(A)
0 0
50
0 0
100
50
x
100
x
Fig. 8. (A) Simple rectangular grid cell arrangement. (B) Jittered cell arrangement.
Regular
Jittered
Higher baseline
80
80
80
60
60
60
20 0
Trials
100
Trials
100
Trials
100
40
40 20
26
27
29
30
0
32
Putative stimulus speed (°/s)
40 20
26
27
29
30
0
32
Putative stimulus speed (°/s)
80
80
60
60
60
20 0
Trials
80
Trials
100
Trials
100
40 20
26
27
29
30
0
32
Putative stimulus speed (°/s)
26
27
29
30
0
32
Putative stimulus speed (°/s)
60
60
60
Trials
80
Trials
80
Trials
80
40 20
26
27
29
30
32
Putative stimulus speed (°/s)
0
30
32
26
27
29
30
32
Putative stimulus speed (°/s)
100
0
29
20
100
20
27
40
100
40
26
Putative stimulus speed (°/s)
100
40
B35
40 20
26
27
29
30
32
Putative stimulus speed (°/s)
0
26
27
29
30
32
Putative stimulus speed (°/s)
Fig. 9. Histograms illustrating the velocity estimates over 100 trials for a stimulus with velocity 28.8° / s and contrast of −1 using the regular cell arrangement and uniform baseline log firing rates (left column) and the jittered cell arrangement and random baseline log firing rates (middle column). The top row represents the performance of the optimal Bayesian decoder, the middle row represents that of the marginal decoder, and the bottom row presents that of the energy method. Similar performance was obtained with both the rectangular-grid and randomized spatial layouts for all three methods. The right column illustrates the improved estimation performance obtained for all three methods by doubling the baseline log firing rates from 2 and 3 spikes/ s to 4 and 6 spikes/ s for the ON and OFF cells respectively.
B36
J. Opt. Soc. Am. A / Vol. 26, No. 11 / November 2009
sible effects of changes in the mean baseline log firing rate. To assess this, we also carried out 100 simulations using a stimulus with speed of 28.8° / s and a contrast of −1, where the cells were arranged in the original simple grid and the ON and OFF cells were given baseline log firing rates of 4 and 6 spikes/ s, respectively. The right column of Fig. 9 illustrates the significantly improved estimation performance obtained by inflating the baseline log firing rates compared to the fitted values used throughout the rest of this study for all three methods.
4. DISCUSSION The model of [7] employed stochastic checkerboard stimuli in order to accurately capture both the stimulus dependence and detailed spatio temporal correlation structure of responses from a population of retinal ganglion cells. In this study, we have examined responses from this model to a more behaviorally relevant coherent velocity stimulus. Specifically, we have used these responses to assess how faithfully speed is encoded in a population of neurons using an optimal Bayesian decoder, with complete knowledge of the stimulus image. We have also shown how to compute the Bayesian velocity estimate in the case where we have only a limited amount of information about the stimulus image, and how the Bayesian estimate in this case is closely related to a biologically plausible motion-energy-based method [36,43]. A connection between Bayesian velocity estimation and the energy method of [36] has been noted before [12,15]. In that work, a Bayesian model of local motion information was described. It was shown that this model could be represented using a number of mathematical “building blocks” that qualitatively resembled direction-selective complex cells. Given that models of those cells have been based on the energy method of [36], a link was drawn between the two methods. Furthermore, previous work has sought to optimally estimate instantaneous motion from spike train ensembles in the fly [38,44]. However, to the best of our knowledge, in the case of non local estimation of rigid motion, the mathematical connection revealed here between the energy method and the Bayesian method based on the marginal image likelihood in the LG case has not been previously described. In terms of biological plausibility, it is unlikely that the brain performs optimal Bayesian inference with full knowledge of the image in order to estimate velocity. This is supported by a recent study, which [8] employed the energy method (Subsection 2.B.2) to examine the efficiency of the code from a population of primate RGCs. They did this by comparing the estimate of the velocity of a stimulus using the spiking activity in the cell population with psychophysical estimates made by human observers. While the energy model consistently outperformed the human observers, it was shown that at very brief presentation times, i.e., ⬍100 ms the difference in estimation performance between the energy method and the human behavior was much smaller than at longer presentation times. This suggests that readout of the retinal population code can be extremely efficient when exposure to the moving stimulus is very brief, but less efficient over long trials when storing information over a long time is re-
Lalor et al.
quired by the optimal Bayesian decoder. In this study, having used longer presentation times 共125– 675 ms兲, and given that the optimal Bayesian decoder significantly outperforms even the energy method, it seems clear that human observers do not decode using a known image in this task. Instead, given the relationship presented here between the marginal decoder and the energy method, it appears that a strategy equivalent to marginalization over the uncertain image seems to be more consistent with the available data. A couple of factors in the relationship between the marginal decoder and the energy method are worthy of further discussion. First, the optimal filter width for velocity estimation from cell population responses when using the energy method on real data was reported to be of the order of 10 ms [4]. This implies that the elementary motion signal was conveyed with a time resolution comparable to the interspike interval of RGCs. A similar filter width was empirically shown using our simulated data (Fig. 3), which was not unexpected given the large amount of variance captured by the model in peristimulus time histograms in response to novel stimuli [7]. Of more interest, however, the optimal filter derived analytically for our (LG) marginal decoder is also shown to be of similar width, at least in the case where stimulus velocities are above about 5 ° / s (Fig. 2). This lends further weight to the biological plausibility of the marginal decoder. The notion that optimal filters based on stimulus filters, natural image prior, and velocity could have a biological instantiation seems reasonable. Second, in this study, we have assessed the performance of the energy method relative to the marginal decoder where the spike trains were generated not by a simple LG model, but by a GLM model. Because of the resulting improvement in spike train modeling we saw a significant improvement in velocity estimation for the marginal decoder relative to the energy method. Obviously the optimal decoder outperformed both other methods given the extra image information with which it was furnished. In terms of performance specifics, the optimal Bayesian decoder achieved an average relative precision of 2% across all 48 stimulus conditions, with the marginal decoder achieving 6.4% and the energy method realizing only 10% relative precision. It is interesting to compare the estimation performance using our model to that obtained using similar stimuli with real cells in [4]. The authors of that study reported that the ensemble activity of around 100 RGCs signaled speed with a precision of the order of 1%. The precision of 10% obtained using the same decoder on our model output spike trains is higher than that result. One likely reason for this is that our stimulus range included much lower contrast stimuli. If we restrict our precision estimate to those conditions that most closely resemble those used by [4], i.e., speeds of 10.8, 14.4, 28.8, and 57.6° / s and contrast levels of −1 and 1, we obtain a value of 2.8% using the energy method which is of the same order as their result. We examined the precision of our speed estimates as a function of both stimulus speed and stimulus contrast. As expected, decoding performance improves with increasing contrast and with decreasing speed (Fig. 5). Figure 5(a) illustrates that our model approximately followed a
Lalor et al.
Weber–Fechner law with visual speed discrimination being roughly proportional to speed [45]. As discussed in Subsection 3.A.1, the faster the moving bar traverses the retina, the less time spent stimulating the cells, and the smaller the total number of spikes we have with which to decode the stimulus speed. Similarly, the precision of the speed estimate improves with increasing absolute contrast, which increases the effective signal-to-noise of the retinal output [see Fig. 5(b)]. The nonlinear function f共 · 兲 used in Eq. (2) for this study was chosen to be exp共 · 兲. Given that in determining the firing intensities i共t兲, this function operates on the stimulus input (as well as the baseline firing rates and spike history and cross-coupling effects), any increase in stimulus contrast would be expected to have a strong impact on the stimulus-related firing rates; similar conclusions may be drawn from an analysis of the Fisher information in this model [26]. As mentioned earlier, Bayesian modeling has been employed in a number of studies investigating how visual speed perception is affected by properties of the visual stimulus. In [16] an optimal Bayesian observer model was used to examine human psychophysical data in terms of stimulus noise characteristics and prior expectations. They reported that the perception that low-contrast stimuli move more slowly than high-contrast stimuli was well modeled by an ideal Bayesian observer. This was because the broader likelihood (based on psychophysical measurements), when multiplied by a prior favoring low speeds [46], resulted in a larger shift toward zero than multiplication by a narrower likelihood. In the present study, a uniform prior was used for the speed of the moving bar. Thus, we would not expect a widening of the likelihood distribution by lowering the stimulus contrast to shift the location of the posterior probability distribution. As such, we would not expect any relationship between stimulus contrast and the mean (or median) of the speed estimate distribution. This appeared to be the case, with no straightforward relationship seen to exist between speed estimate bias and contrast [Fig. 5(d)]. There did appear to be a very slight trend toward greater bias to low speeds at low contrasts for the energy method, but given the much higher variance in the speed estimate at this contrast [Fig. 5(b)], we are disinclined to draw any deeper conclusions from these results. In terms of a relationship between speed estimate bias and stimulus speed, however, our results indicate a clear trend. Specifically, there appears to be a systematic bias in speed estimation tending to underestimate speed at high stimulus velocities for both the energy method and the Bayesian decoder with known image, while tending to overestimate speed at the same high stimulus velocities for the Bayesian decoder with uncertain image [Fig. 5(c)]. This can be explained by the well-known fact that likelihood-based estimators can display bias in lowinformation settings (as the high-speed setting is here, since effectively less time is available to observe spiking data during the stimulus presentation). In the low-speed, high-information setting, the bias of the likelihood-based estimator is negligible, as expected. The discrepancy between the biases of the marginal decoder and the energybased estimate is clarified by the connection between these two methods as described in Subsection 2.B.3 and
Vol. 26, No. 11 / November 2009 / J. Opt. Soc. Am. A
B37
Appendix A. Specifically, see the discussion after Eqs. (24) and (25) of Subsection 2.B.3 and Eqs. (A7) and (A8) of Appendix A. In [7] it was found that, when comparing the full RGC model with an uncoupled version (retaining spike history effects), Bayesian stimulus decoding recovered 20% more information (about the spatiotemporal light intensity profile) using pseudorandom stimuli. The authors also noted that additionally ignoring spike history effects further reduced the recovered information by 6%. Thus, we wished to examine the importance of correlations between cells and of the intrinsic timing structure of the spike trains for speed estimation precision. We followed the procedure employed in [4] and, as in that study, it appeared that, for most stimulus conditions, the shuffled, uncorrelated spike trains surprisingly resulted in a weak improvement in estimation precision. The one exception to this was in the case of the marginal decoder, where for high-information stimulus conditions (i.e., low speeds and high contrast), the shuffled spike trains resulted in a significant reduction in performance. We also replicated their test of how precise spike timing might affect speed estimation precision [4]. Again, as in their study, we found only a very slight reduction in performance for the optimal Bayesian decoder and the energy method. Similar to the reshuffled case, the deterioration in the performance of the marginal decoder was more pronounced. Given that we have completely abolished the intraneuronal and interneuronal nonstimulus-driven correlation structure here, these small decreases in performance indicate that velocity decoding does not depend strongly on the fine spike train structure—at least in the very simple case of a moving bar. It should be noted that for the results plotted in Fig. 7, all spike train ensembles were decoded using the full model. That is, coupling filters and spike history effects were assumed and accounted for when calculating i in the decoding step. Given that coupling effects were removed by our shuffling procedure and that both coupling effects and spike history effects were removed by our resampling procedure, it is possible that decoding the spike trains with an appropriately reduced model might provide more accurate speed estimation for these manipulated spike train ensembles. To that end, we used a model without coupling filters to decode the speed of the shuffled spike train ensembles and a model with all hij set to zero to decode the speed of the resampled spike train ensembles. It is interesting to note that incorporating this knowledge about the presence or absence of cell coupling and spike history effects into the decoding made no qualitative difference to the accuracy of the estimated velocity (not shown).
5. CONCLUSION Optimal Bayesian decoding with full image information has been shown to outperform a “motion energy” method that uses no prior image information. A method for performing Bayesian decoding without full image information has been described and has demonstrated performance intermediate between that of the optimal decoder and the energy method. All of these methods appear to outperform human psychophysical performance [8], par-
B38
J. Opt. Soc. Am. A / Vol. 26, No. 11 / November 2009
Lalor et al.
ticularly in experiments in which the motion stimulus was visible for an extended period of time. A mathematical description of the connection between the Bayesian decoder with less than full image information and the energy method indicates that, in addition to the extra information about the image used by the Bayesian estimator, information about the network’s spatiotemporal stimulus filtering properties also plays an important role in optimal velocity estimation. The results of a number of simulations indicate a good correspondence between the speed encoding performance of the model and that of a population of real RGCs. This work thus provides a rigorous framework with which to explore the factors limiting the estimation of velocity in vision. Future work will seek to utilize these methods to investigate motion decoding using more complex stimuli moving in nontranslational ways, perhaps incorporating real-world issues such as occlusions and accelerations. Also, we aim to employ the methods to investigate real data.
APPENDIX A: MARGINAL LIKELIHOOD IN THE LINEAR GAUSSIAN MODEL In this appendix we show that the logarithm of the marginal likelihood p共r 兩 v兲 for a simple LG model of the RGCs is closely related to the energy function of [4], and thus for this model the Bayesian velocity decoding is nearly equivalent to the energy method. In the linear Gaussian model, the response of cell i, ri, is given linearly in terms of the image intensity profile x up to additive Gaussian noise with covariance ⌺, as in Eq. (23). Thus we have pLG共r兩x,v兲 =
兿 N共b + K i
i,v
· x,⌺兲.
i
Using this and px共x兲 = N共0 , Cx兲 as the Gaussian image prior, we repeat the steps in Eqs. (11)–(19) of Subsection 2.B.1. For the LG model, the log-posterior function is given by LLG共x,r,v兲 ⬅ log关px共x兲兴 + log关pLG共r兩x,v兲兴 = − −
1 2
兺 共r − b − K i
i
i,v
· x兲T⌺−1共ri − bi − Ki,v · x兲
i
共A1兲
instead of Eq. (11), and the marginal distribution pLG共r 兩 v兲 by pLG共r兩v兲 =
冕
eLLG共x,r,v兲dx,
共A2兲
similar to Eq. (10). As before, setting ⵜxLLG = 0 yields the equation for xMAP, which unlike Eq. (19) is linear, and can be easily solved to yield xMAP共r,v兲 = H共v兲
−1
兺
T Ki,v
·⌺
−1
i
Here, the negative Hessian is given by
· 共ri − bi兲.
共A3兲
兺K
T i,v
· ⌺−1 · Ki,v ,
共A4兲
i
which is now independent of the observed spike trains r. Using Eqs. (A3) and (A4), we can rearrange the terms in Eq. (A1) to complete the square for x, and obtain 1
LLG共x,r,v兲 = − 2 共x − xMAP兲TH共v兲共x − xMAP兲 1 2
−
兺 ␦r ⌺ T i
−1
␦ri +
i
1 2
兺 X C 共v兲X + const., T i x
j
ij
共A5兲 where Cx共v兲 = H 共v兲 is the posterior covariance over the fixed image, and we defined the mean-adjusted response ␦ri ⬅ ri − bi and the prefiltered response −1
T Xi ⬅ Ki,v ⌺−1␦ri .
共A6兲
The marginalization in Eq. (A2) is thus a standard Gaussian integration, which yields log pLG共r兩v兲 =
1 2
兺 X C 共v兲X − T i x
j
ij
1 2
log兩CxH共v兲兩 + const. 共A7兲
(the constant term is independent of v, and therefore irrelevant for estimating it). The decomposition into the two terms on the right-hand side of Eq. (A7) is similar to that in Eq. (18). In both equations the second term arose from a Gaussian integration over x [an approximation in the case of Eq. (18)], and the first was (up to a constant in v) the value of the logarithm of the joint distribution of x and r, given v, at xMAP共r , v兲. Unlike Eq. (18), however, although the second term on the right-hand side of Eq. (A7) depends on v, it is nevertheless independent of the observed response r. The only term that modulates the velocity posterior depending on r (through the implicit dependence of Xi) is the first, which we denote by ELG共v , r兲. We will see that this term corresponds closely to the energy function introduced in [4]. More explicitly, we have ELG共v,r兲 ⬅
1 T −1 x Cx x 2
+ const.
H共v兲 = − ⵜxⵜxLLG = C−1 x +
1 2 1
=
2
兺 X C 共v兲X T i x
ij
兺 ij
冕冕
j
Xi共n1兲Cx共n1,n2 ;v兲Xj共n2兲d2n1d2n2 . 共A8兲
In the following we will rewrite Eq. (A8) in a form which is explicitly akin to Eq. (21). For simplicity, we assume that the noise covariance is white, i.e., ⌺ = 21. Physiologically, this implies that we are ignoring stimulus-conditional correlations and history dependences in the network (as, e.g., in the uncoupled model discussed in [7]). From Eq. (A6) and the definition of Ki,v, Eq. (7), we then obtain the explicit form Xi共n兲 =
1
2
冕 冕 dt
dki共t − , v + n兲␦ri共t兲.
共A9兲
If we further assume that the spike train observation has not revealed much information about the identity of the fixed image (as happens, e.g., for low contrasts or short
Lalor et al.
Vol. 26, No. 11 / November 2009 / J. Opt. Soc. Am. A
presentation times), then the posterior distribution over x will not be very different from the prior px共x兲. Therefore, we can use the approximation Cx共v兲 ⬇ Cx. In the onedimensional case, which we are studying in this paper, the image profile x共n兲, and hence the prior image covariance, depend only on the component of n parallel to the direction of motion vˆ = v / 兩v兩 and are constant in the perpendicular direction. Denoting the former component by n共 = n · vˆ 兲 and the latter by n⬜共 = n − nvˆ 兲, we can then perfom the integrals over n⬜ in Eq. (A8) and rewrite it as ELG共v,r兲 =
1 2
冕冕
兺 ij
˜ 共n 兲C 共n ,n 兲X ˜ 共n 兲dn dn , X i 1 x 1 2 j 2 1 2 共A10兲
˜ 共n兲 ⬅ X i
冕
Xi共n兲dn⬜ =
1
2
冕 冕 dt
d˜ki共t − , v + n兲␦ri共t兲, 共A11兲
Cx共n1 − n2兲 =
冕
ki共t,n + ni兲dn⬜ ,
ELG共v,r兲 =
1 2v
2
兺 ij
冉
冕冕 冉
˜ −t + R i 1
˜ −t + ⫻R j 2
nj v
冊
ni v
冊
Cx共vt1,vt2兲
dt1dt2 .
共A13兲
˜ 共t 兲 ⬅ X ˜ 共n − vt 兲 R i 1 i i 1 =
2 1
=
2
冕 冕 冕 冕 dt
d˜ki共t − ,v − vt1 + ni兲␦ri共t兲
dt
dqi共t − ,v共 − t1兲兲␦ri共t兲.
冊 冉 冊 冉冉 兺 冕冕冕 冉 冉 冊冊
2v 兺 ij
冕冕冕 冉
˜ −t + R i 1
˜ −t + ⫻Bx共v共t2 − t兲兲R j 2 1 =
2v
ni v
共A15兲
nj v
Bx共v共t1 − t兲兲
dt1dt2dt
˜ 共t 兲B v t + R i 1 x
ij
⫻Bx v t +
nj v
ni v
− t1
冊冊
˜ 共t 兲dt dt dt. R j 2 1 2
− t2
共A16兲
We derived the last line by renaming the integration variables as t1 → ni / v − t1, t2 → nj / v − t2, and t → −t. Finally, defining Ri共t兲 ⬅
1
冑v
冕
we obtain ELG共v,r兲 =
˜ 共t 兲dt , Bx共v共t − t1兲兲R i 1 1
冕 冉 冊冉 冊
1
2兺
Ri t +
ij
ni v
Rj t +
nj v
共A17兲
dt.
共A18兲
Equation (A18) is akin to the energy function used in [4], and together with Eq. (A7) yields Eq. (24) of Subsection 2.B.3. To find the explicit form of the smoothing filter in Eq. (25), we compare that equation, in the form Ri共t兲 =
Using Eq. (A11) and the definiton (A12), we write Ri共t1兲 explicitly as
1
1
ELG共v,r兲 =
共A12兲
(where ni ⬅ ni · vˆ ), qi共t , n兲 vanishes when 兩n兩 Ⰷ 1°; for all cells, qi are localized (up to the above scale) around the origin, as opposed to around the position of their respective receptive field centers along v. In order to make the comparison with the energy model of Subsection 2.B.2 clearer, we also switch to the time domain (recalling that space n and time t are linked here via the velocity v); we ˜ 共t兲 ⬅ X ˜ 共n − vt兲 [equivalently, X ˜ 共n兲 = R ˜ 共共−n define R i i i i i + ni兲 / v兲] and rewrite Eq. (A10) by changing the integration variables from n1共2兲 to vt1共2兲:
Bx共n1 − n兲Bx共n2 − n兲dn.
In general, given an explicit form of Cx共n1 − n2兲, Bx can be computed in the Fourier domain by taking the square root of the power spectrum [29]. In particular, for Cx共n1 − n2兲 = c2e−兩n1−n2兩/lcorr, we have Bx共n兲 = c冑2 / lcorr共n兲e−n/lcorr, where c is the image contrast, lcorr is the correlation length of typical images in the naturalistic prior ensemble, and 共t兲 is the Heaviside step function. In the simulations of Subsection 3.A.4 we used this particular form of Cx, as it yields (for spatial frequencies f larger than the inverse of the correlation length lcorr but smaller than the inverse image pixel size) a power spectrum ⬀1 / f2, as observed in natural images. Substituting definition (A15) (after renaming the integration variable n to vt) in Eq. (A13), we rewrite the latter as
where v ⬅ 兩v兩, and we defined ˜ki共t , n兲 ⬅ 兰ki共t , n兲dn⬜. For each cell i, we specify a fixed point ni positioned at its receptive field center, so that ki共t , ni + ⌬n兲 vanishes when 兩⌬n兩 gets considerably larger than the size of the receptive field surround 共 ⬃ 1 ° 兲. Hence, if we define qi共t,n兲 ⬅ ˜ki共t,n + ni兲 =
冕
B39
冕
wLG共t − t⬘兲␦ri共t⬘兲dt⬘ ,
共A19兲
with definition (A17): Ri共t兲 =
1
2
冑v
冕 冕 冕 dt1
dt⬘
dBx共v共t − t1兲兲
⫻qi共t⬘ − ,v共 − t1兲兲␦ri共t⬘兲, 共A14兲
Exploiting the translation invariance of the prior image ensemble that dictates Cx共n1 , n2兲 = Cx共n1 − n2兲, we define Bx to be the operator square root of Cx, in the sense that
1 =
2冑v
冕 冕 冕 dt1
dt⬘
dBx共v共t − t⬘ − t1兲兲
⫻qi共− ,v共 − t1兲兲␦ri共t⬘兲,
共A20兲
[where we used Eq. (A14) to write the first line, and
B40
J. Opt. Soc. Am. A / Vol. 26, No. 11 / November 2009
Lalor et al.
shifted and t1 by t⬘ to derive the second], and obtain wLG共t兲 =
1
2
冑v
冕 冕 dt1
dBx共v共t − t1兲兲qi共− ,v共 − t1兲兲. 共A21兲
Thus, Ri共t兲 is a version of the response function of the cell i offset by its baseline log firing rate bi and smoothed out on the time scale dictated by the largest of the spatiotemporal scales of the receptive fields (via qi) or the correlation length of typical images (via Bx)—with spatial scales converted to time scales by dividing by v. To see this more precisely, let us define ⌬1 ⬅ , ⌬2 ⬅ t1 − , and ⌬3 ⬅ t − t1, such that t = ⌬1 + ⌬2 + ⌬3. On the other hand, because of the finite support of the factors of its integrand, the double integral Eq. (A21) receives nonzero contributions only when 兩⌬1兩 ⱗ k, 兩⌬2兩 ⱗ lk / v, and 兩⌬3兩 ⱗ lcorr / v [where k and lk are the typical temporal and spatial size of the receptive field filters ki共t , n兲, respectively, and lcorr is the correlation length of typical images in the naturalistic prior ensemble]. Thus if 兩t兩 = 兩1 + ⌬2 + ⌬3兩 is much larger than the sum of the three scales k, lk / v, and lcorr / v, the filter w共t兲 is bound to vanish. This leads to the discussion of Subsection 2.B.3 following Eq. (25).
APPENDIX B: O„D… DECODING Here, we discuss how to implement the Newton–Raphson optimization algorithm such that it finds the maximum a posteriori estimate for the image xMAP [satisfying Eq. (19)] in cases where the image depends only on one spatial dimension and in a computational time that scales only linearly with the spatial dimensionality of the image vector d. The Newton–Raphson algorithm for minimizing the function L共x兲 works as follows [we have in mind the objective function defined in Eq. (13), but for simplicity we drop r and v from its arguments in this appendix]. At each iteration of this algorithm, starting from the vector x, we change this vector by an amount ⌬x which is found by solving the set of linear equations H共x兲⌬x = ⵜxL共x兲. Here, the right-hand side is the gradient of L共x兲, and H共x兲 is its negative Hessian matrix [as in Eq. (15)], both evaluated at x. In general, the solution of a set of d linear equations can be calculated in O共d3兲 elementary operations [47]. This would make the decoding of images with even moderate angular extension forbidding. Fortunately, as we will now explain, the quasi-locality of the GLM model allows us to overcome this limitation. The negative Hessian of L共x兲, Eq. (13), is given by H共x兲 = C−1 x +
兺J
i,t共x兲,
numerical implementation, and for simplicity we wrote Eq. (B2) for the case of exponential GLM nonlinearity. Generalization of this equation and the rest of the argument to general nonlinearities is straightforward. Because of the finite spatial size of the receptive field and the finite duration of the temporal filter, ki共 , n兲 is nonzero i i , nmax 兴, where Tk and only when 苸 关0 , Tk兴 and n 苸 关nmin i i ⌬n ⬅ nmax − nmin are upper bounds on the cells’ temporal integration windows and the size of the cells’ receptive field surrounds, respectively. It follows then from Eq. (7) i i − vt 艋 n 艋 nmax − vt that Ki,v共t ; n兲 vanishes unless nmin + vTk (we assumed v ⬎ 0, but generalization to v ⬍ 0 is straightforward). Thus Ji,t共n1 , n2 ; x兲 vanishes if 兩n1 − n2兩 ⬎ ⌬n + vTk, regardless of i and t. In other words, for all 共i , t兲, Ji,t共x兲 are banded matrices with a band width of ⌬n + vTk, and so is their sum. If we further use a prior covariance Cx with a banded inverse, then the full Hessian Eq. (B1) will be banded [e.g., the naturalistic prior covariance introduced after Eq. (A15) can be defined as the inverse of a tridiagonal matrix in the numerical implementation]. Unlike in the general case, the solution of a set of d linear equations with a banded equation matrix of band width B can be found in a computational time ⬀B2d—i.e., in our case, in a computational time scaling only linearly (as opposed to cubically) with the image size d. On the other hand, we have observed empirically that the number of necessary Newton–Raphson iterations is more or less constant and does not scale with d. Hence the overall optimization procedure for finding xMAP can be performed in O共d兲 computational time. This allows us to decode the velocity of large moving images. Similar methods with O共d兲 computational cost have been used in inference and estimation problems involving state–space models [48,49], e.g., in applications to neural data analysis [50].
ACKNOWLEDGMENTS Thanks to E. P. Simoncelli for very detailed comments on the manuscript, to J. Pillow for providing us with the parameters for the network model introduced in [7], and to D. Pfau and E. J. Chichilnisky for many useful comments. YA and LP are partially supported by NEI grant R01 EY018003 and by a McKnight Scholar award to LP. YA is additionally supported by a Patterson Trust Fellowship in Brain Circuitry. EL is supported by an Irish Research Council for Science, Engineering and Technology (IRCSET) Government of Ireland Postdoctoral Research Fellowship.
共B1兲
i,t
where the matrices Ji,t共x兲 have the elements Ji,t共n1,n2 ;x兲 = Ki,v共t;n1兲Ki,v共t;n2兲i共t;x兲dt,
共B2兲
and Ki,v共t ; n兲 was defined in Eq. (7) in terms of the receptive field filter of the cell i, ki共 , n兲 [as we are considering the one-dimensional image case, ki共 , n兲 is understood to be the full receptive field integrated along the transverse spatial dimension]. Here, we turned the integral over t in Eq. (13) into a discrete sum in Eq. (B1), as is done in the
REFERENCES 1. 2. 3.
M. Meister, L. Lagnado, and D. Baylor, “Concerted signaling by retinal ganglion cells,” Science 270, 1207–1210 (1995). S. Nirenberg, S. Carcieri, A. Jacobs, and P. Latham, “Retinal ganglion cells act largely as independent encoders,” Nature 411, 698–701 (2002). E. Chichilnisky and R. Kalmar, “Functional asymmetries in ON and OFF ganglion cells of primate retina,” J. Neurosci. 22, 2737–2747 (2002).
Lalor et al. 4.
5.
6.
7.
8.
9.
10. 11. 12.
13. 14. 15. 16. 17.
18. 19. 20.
21.
22. 23.
E. Frechette, A. Sher, M. Grivich, D. Petrusca, A. Litke, and E. Chichilnisky, “Fidelity of the ensemble code for visual motion in the primate retina,” J. Neurophysiol. 94, 119–135 (2005). E. Schneidman, M. Berry, R. Segev, and W. Bialek, “Weak pairwise correlations imply strongly correlated network states in a neural population,” Nature 440, 1007–1012 (2006). J. Shlens, G. Field, J. Gauthier, M. Grivich, D. Petrusca, A. Sher, A. Litke, and E. Chichilnisky, “The structure of multi-neuron firing patterns in primate retina,” J. Neurosci. 26, 8254–8266 (2006). J. Pillow, J. Shlens, L. Paninski, A. Sher, A. Litke, E. Chichilnisky, and E. Simoncelli, “Spatio-temporal correlations and visual signalling in a complete neuronal population,” Nature 454, 995–999 (2008). E. S. Frechette, M. I. Grivich, R. S. Kalmar, A. M. Litke, D. Petrusca, A. Sher, and E. J. Chichilnisky, “Retinal motion signals and limits on speed discrimination,” J. Vision 4, 570 (2004). A. Litke, N. Bezayiff, E. Chichilnisky, W. Cunningham, W. Dabrowski, A. Grillo, M. Grivich, P. Grybos, P. Hottowy, S. Kachiguine, R. Kalmar, K. Mathieson, D. Petrusca, M. Rahman, and A. Sher, “What does the eye tell the brain?: Development of a system for the large-scale recording of retinal output activity,” IEEE Trans. Nucl. Sci. 51, 1434–1440 (2004). R. Segev, J. Goodhouse, J. Puchalla, and M. Berry, “Recording spikes from a large fraction of the ganglion cells in a retinal patch,” Nat. Neurosci. 7, 1154–1161 (2004). D. Knill and W. Richards, eds., Perception as Bayesian Inference (Cambridge Univ. Press, 1996). E. P. Simoncelli, “Distributed analysis and representation of visual motion,” Ph.D. thesis (Department of Electrical Engineering and Computer Science, Massachusetts Institute of Technology, Cambridge, Massachusetts, 1993). Also available as MIT Media Laboratory Vision and Modeling Technical Report #209. D. Ascher and N. Grzywacz, “A Bayesian model for the measurement of visual velocity,” Vision Res. 40, 3427–3434 (2000). Y. Weiss, E. Simoncelli, and E. Adelson, “Motion illusions as optimal percepts,” Nat. Neurosci. 5, 598–604 (2002). E. P. Simoncelli, “Local analysis of visual motion,” in The Visual Neurosciences, L. M. Chalupa and J. S. Werner, eds. (MIT Press, 2003), Chap. 109, pp. 1616–1623. A. Stocker and E. Simoncelli, “Noise characteristics and prior expectations in human visual speed perception,” Nat. Neurosci. 9, 578–585 (2006). A. E. Welchman, J. M. Lam, and H. H. Bulthoff, “Bayesian motion estimation accounts for a surprising bias in 3D vision,” Proc. Natl. Acad. Sci. U.S.A. 105, 12087–12092 (2008). F. Hurlimann, D. Kiper, and M. Carandini, “Testing the Bayesian model of perceived speed,” Vision Res. 42, 2253–2257 (2002). P. Thompson, K. Brooks, and S. Hammett, “Speed can go up as well as down at low contrast: Implications for models of motion perception,” Vision Res. 46, 782–786 (2005). A. Thiel, M. Greschner, C. Eurich, J. Ammermüller, and J. Kretzberg, “Contribution of individual retinal ganglion cell responses to velocity and acceleration encoding,” J. Neurophysiol. 98, 2285–2296 (2007). J. Kretzberg, I. Winzenborg, and A. Thiel, “Bayesian analysis of the encoding of constant and changing stimulus velocities by retinal ganglion cells,” presented at Frontiers in Neuroinformatics 2008, Stockholm, September 7–9, 2008. D. Brillinger, “Maximum likelihood analysis of spike trains of interacting nerve cells,” Biol. Cybern. 59, 189–200 (1988). P. McCullagh and J. Nelder, Generalized Linear Models (Chapman & Hall, 1989).
Vol. 26, No. 11 / November 2009 / J. Opt. Soc. Am. A 24. 25.
26.
27. 28. 29.
30. 31.
32. 33. 34.
35. 36. 37. 38. 39.
40. 41. 42. 43. 44. 45.
46. 47.
B41
L. Paninski, “Maximum likelihood estimation of cascade point-process neural encoding models,” Network Comput. Neural Syst. 15, 243–262 (2004). W. Truccolo, U. Eden, M. Fellows, J. Donoghue, and E. Brown, “A point process frame-work for relating neural spiking activity to spiking history, neural ensemble and extrinsic covariate effects,” J. Neurophysiol. 93, 1074–1089 (2005). L. Paninski, J. Pillow, and J. Lewi, “Statistical models for neural encoding, decoding, and optimal stimulus design,” in Computational Neuroscience: Progress in Brain Research, P. Cisek, T. Drew, and J. Kalaska, eds. (Elsevier, 2007). D. Snyder and M. Miller, Random Point Processes in Time and Space (Springer-Verlag, 1991). D. Field, “Relations between the statistics of natural images and the response profiles of cortical cells,” J. Opt. Soc. Am. A 4, 2379–2394 (1987). D. H. Brainard, D. R. Williams, and H. Hofer, “Trichromatic reconstruction from the interleaved cone mosaic: Bayesian model and the color appearance of small spots,” J. Vision 8, 1–23 (2008). R. Kass and A. Raftery, “Bayes factors,” J. Am. Stat. Assoc. 90, 773–795 (1995). E. Brown, L. Frank, D. Tang, M. Quirk, and M. Wilson, “A statistical paradigm for neural spike train decoding applied to position prediction from ensemble firing patterns of rat hippocampal place cells,” J. Neurosci. 18, 7411–7425 (1998). W. Bialek and A. Zee, “Coding and computation with neural spike trains,” J. Stat. Phys. 59, 103–115 (1990). S. Koyama and S. Shinomoto, “Empirical Bayes interpretations of random point events,” J. Phys. A 38, 531–537 (2005). J. Pillow, Y. Ahmadian, and L. Paninski, “Model-based decoding, information estimation, and change-point detection in multi-neuron spike trains,” submitted to Neural Comput. Y. Ahmadian, J. Pillow, and L. Paninski, “Efficient Markov chain Monte Carlo methods for decoding neural spike trains,” submitted to Neural Comput. E. Adelson and J. Bergen, “Spatiotemporal energy models for the perception of motion,” J. Opt. Soc. Am. A 2, 284–99 (1985). E. Chichilnisky and R. Kalmar, “Temporal resolution of ensemble visual motion signals in primate retina,” J. Neurosci. 23, 6681–6689 (2003). W. Bialek (Princeton University,
[email protected]) and R. de Ruyter van Steveninck (Indiana University,
[email protected]) (personal communication, 2003). V. Perry and A. Cowey, “The ganglion cell and cone distributions in the monkey’s retina: implications for central magnification factors,” Vision Res. 25, 1795–1810 (1985). S. Ullman, The Interpretation of Visual Motion (MIT Press, 1979). P. Thompson, “Perceived rate of movement depends on contrast,” Vision Res. 22, 377–380 (1982). L. Stone and P. Thompson, “Human speed perception is contrast dependent,” Vision Res. 32, 1535–1549 (1992). D. C. Bradley and M. S. Goyal, “Velocity computation in the primate visual system,” Nat. Rev. Neurosci. 9, 686–695 (2008). M. Potters and W. Bialek, “Statistical mechanics and visual signal processing,” J. Phys. I France 4, 1755–1775 (1994). S. McKee, G. Silvermann, and K. Nakayama, “Precise velocity discrimination despite random variations in temporal frequency and contrast,” Vision Res. 26, 609–619 (1986). M. Blakemore and R. Snowden, “The effect of contrast upon perceived speed: a general phenomenon?” Perception 28, 33–48 (1999). W. Press, S. Teukolsky, W. Vetterling, and B. Flannery, Numerical Recipes in C (Cambridge Univ. Press, 1992).
B42 48. 49.
J. Opt. Soc. Am. A / Vol. 26, No. 11 / November 2009 N. Shephard and M. Pitt, “Likelihood analysis of nonGaussian measurement time series,” Biometrika 84, 653–667 (1997). R. Davis and G. Rodriguez-Yam, “Estimation for statespace models: an approximate likelihood approach,” Stat. Sin. 15, 381–406 (2005).
Lalor et al. 50.
L. Paninski, Y. Ahmadian, D. Ferreira, S. Koyama, K. Rahnama, M. Vidne, J. Vogelstein, and W. Wu, “A new look at state-space models for neural data,” J. Comput. Neurosci. (to be published). Epub ahead of print, doi 10.1007/s10827-009-0179-x.