e-Review of Tourism Research (eRTR), Vol. 3, No. 5, 2005 http://ertr.tamu.edu
______________________________________________________________________________ Rodolfo Baggio Lecturer Bocconi University
The Relationship between Virtual and Real Image of Tourism Operators The wide diffusion of the Internet and of the new technologies in communication and business has dramatically changed the way we live. This change has an important influence in many fields of activity and especially for the tourism sector, considered to be one of the most successful areas on the Web. The influence of the Internet is so high that there is a direct relationship between the appreciation of the virtual online presence for an operator and its image in the “real” world. Keywords: tourism, internet, website quality, brand image By Rodolfo Baggio Lecturer Master in Tourism and Economics Bocconi University via Sarfatti, 25 20136 Milan, Italy Phone: +39 02 5836 5447 Fax: +39 02 5836 5439 Email:
[email protected]
Rodolfo Baggio holds a degree in Physics from the University of Milan, Italy. He is presently a lecturer at the Bocconi University where he teaches courses in Computer Science and coordinates the Information and Communication Technologies area at the Master in Tourism and Economics. After having worked for the IT industry, he is now involved in a number of educational and research projects on the relationships between IT and the travel and tourism sector.
118
e-Review of Tourism Research (eRTR), Vol. 3, No. 5, 2005 http://ertr.tamu.edu
Introduction This extensive force of change due to the wide adoption of Internet technologies leaves very few areas of our lives unchanged, and the changes we may expect over the coming decades are likely to be much more extensive, and to happen much faster, than any in the past. More importantly, they look as pervasive and ubiquitous as basic utilities. In this scenario, it is nowadays well accepted that tourism represents a sector of great importance. The digital travel segment, one of the most significant on the Web, is characterized by a continuous growth, and the revenue forecasts are continuously on the rise. The growth of the Net as a new sale and promotional channel is of great impact on tourist services and very few can ignore that an effective Internet strategy is a key element to achieve a competitive advantage. From a market point of view it has been shown on many occasions that the influence of the virtual channel on the real business is quite high. Just as an example we may reference the vast amount of research done on the effects of an online gathering of information before proceeding to an offline purchase of goods or services (see for example Forrester, 2004), so that a new term has been coined to indicate this effect: infocommerce. The importance of this channel is quite high. Almost 15% of U.S. retail spending is considered to be strongly influenced by online product research (Dieringer, 2004). On a different perspective, online advertising is enhancing branding metrics. According to EIAA (European Interactive Advertising Association; www.eiaa.net) this improvement is sensible in many areas: brand awareness (+5.4%), brand favorability (+5.6%), and purchase intent (+4.9%). It is rather obvious then, to think that a good virtual image acquired online can play a crucial role in the build-up of an organization image, even in the real world. This relationship may acquire
119
e-Review of Tourism Research (eRTR), Vol. 3, No. 5, 2005 http://ertr.tamu.edu
even more importance for tourism related businesses. Tourists buy before they can experience and the quest for information is a critical stage in the buying process (Detlor et al., 2003; Steinfield et al., 2001) The World Wide Webs today is one of the main ways of acquiring tourism information and the quality of the content and services offered online is, in many cases, an important determinant for the final choice. The evaluation of the quality of a website, the attributes of content and services provided, the design and appeal of the implementations, have been analyzed, evaluated and discussed in several investigations (see for example: Frew et al., 2003; Frew, 2004, 2005). These works have also established a set of criteria and methodologies for both evaluating a website and designing and arranging the elements that can be regarded as success factors. This note presents the preliminary results of an exploration aimed at verifying the relationships between the virtual and the real image of tourism operators.
Methodology and findings A pseudo-random sample of 50 websites belonging to Italian tourism intermediaries (tour operators and travel agents) has been selected by consulting a major search engine (Google: www.google.com). A sample of evaluators (35 people) has examined the websites. The group has been divided into two subgroups. Group one (25 people), after having consulted the websites, have assessed the “real” image of the companies assigning a score (1=min to 5=max) to elements such as: willingness to use the company services, brand awareness, etc.
120
e-Review of Tourism Research (eRTR), Vol. 3, No. 5, 2005 http://ertr.tamu.edu
The second group (10 people) has conducted an assessment of the website’s quality. The assessment is a heuristic evaluation of the user perception of the site and a mapping of contents and services offered by the organization. Both elements are then combined to define a measurement of appreciation for the visitors which can be expressed as a quality index of the website. The first step of the procedure consists in measuring the visitor opinion. A list of items that can be inspected and evaluated is prepared (Antonioli & Baggio, 2002; 2004). The list comprises elements such as the quality of graphical representations, the balance between text and pictures, the clarity of the descriptions, etc. The evaluation is qualitative as, the visitors express their appreciation of the various website features by means of a score (1=min to 5= max). The second step in the assessment procedure is the mapping of the contents and services offered online. The analysis has been accomplished by identifying a series of possible informational contents and interactive services that are considered useful or appealing for a user of a tourist website (Antonioli & Baggio, 2002; Baggio, 2003). The list comprises elements such as accurate geographical information, itinerary descriptions, interactive request forms and e-business functionalities. The evaluators are asked to check the existence of the items on the website under analysis. The criteria used to perform the evaluations may be combined to define a general quality index: QI = AVERAGE EVALUATION × CONTENTS COVERAGE where AVERAGE EVALUATION is the average score obtained in the user evaluation process and CONTENTS COVERAGE is the percentage of features (contents and services) present in the websites with respect to the complete list.
121
e-Review of Tourism Research (eRTR), Vol. 3, No. 5, 2005 http://ertr.tamu.edu
The ten QIs have been processed with the bootstrap method (Efron & Tibshirani 1993) in order to obtain confidence interval for the average value. A bootstrap is a simulation method for making statistical inferences based exclusively on the observed data, and it is usually used when standard parametric inference techniques are difficult, like in our case for the small number of evaluators. The results of this procedure give an average 5% confidence interval of about 15% of the values obtained, which may be regarded as a confirmation of a good “precision” of the evaluation, even with such a small sample of evaluators.
IMM
6.0
2
5.0
R = 0.79
4.0
3.0 2
R = 0.84 2.0
1.0 1.0
1.5
2.0
2.5
3.0
3.5
4.0
4.5 QI
5.0
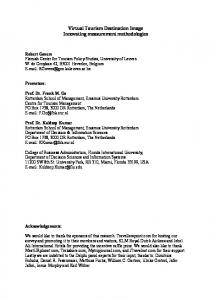
Figure 1 The relationship between the evaluation of the image and the quality of tourism operators websites
A regression is then performed using image scores (IMM) as the dependent variable and quality indexes (QI) as the independent variable.
122
e-Review of Tourism Research (eRTR), Vol. 3, No. 5, 2005 http://ertr.tamu.edu
Adopting a linear model, the regression, with a R2=0.79, gives as a result a good dependency of the image of a tourism operator from the quality of their own website as perceived by the users (Figure 1). However, a more careful analysis of the data show that a better fit (R2=0.84) can be obtained by adopting a square function (Figure 1). This means that the dependency has a different behavior for different regions of the values. Seen in a different way (Figure 2) the relationship is steeper for low quality scores (QI