the effects of charge transfer inefficiency (CTI), the observations were done ..... detected at high S/N. The reader should bear in mind that our observations use ...
The Astrophysical Journal, 791:18 (10pp), 2014 August 10 � C 2014.
doi:10.1088/0004-637X/791/1/18
The American Astronomical Society. All rights reserved. Printed in the U.S.A.
THE REST-FRAME ULTRAVIOLET STRUCTURE OF 0.5 < z < 1.5 GALAXIES Nicholas A. Bond1 , Jonathan P. Gardner1 , Duilia F. de Mello2 , Harry I. Teplitz3 , Marc Rafelski3 , Anton M. Koekemoer4 , Dan Coe4 , Norman Grogin4 , Eric Gawiser5 , Swara Ravindranath6 , and Claudia Scarlata7 1
Cosmology Laboratory (Code 665), NASA Goddard Space Flight Center, Greenbelt, MD 20771, USA 2 Physics Department, The Catholic University of America, Washington, DC 20064 USA 3 IPAC, California Institute of Technology, Pasadena, CA 91125, USA 4 Space Telescope Science Institute, 3700 San Martin Drive, Baltimore, MD 21218, USA 5 Department of Physics and Astronomy, Rutgers University, Piscataway, NJ 08854, USA 6 Inter-University Centre for Astronomy and Astrophysics, Pune, India 7 Minnesota Institute for Astrophysics, School of Physics and Astronomy, University of Minnesota, Minneapolis, MN 55455, USA Received 2013 November 25; accepted 2014 March 26; published 2014 July 22
ABSTRACT We present the rest-frame UV wavelength dependence of the Petrosian-like half-light radius (r50 ), and the concentration parameter for a sample of 198 star-forming galaxies at 0.5 < z < 1.5. We find a ∼5% decrease in r50 from 1500 Å to 3000 Å, with half-light radii at 3000 Å ranging from 0.6 kpc to 6 kpc. We also find a decrease in concentration of ∼0.07 (1.9 < C3000 < 3.9). The lack of a strong relationship between r50 and wavelength is consistent with a model in which clumpy star formation is distributed over length scales comparable to the galaxy’s rest-frame optical light. While the wavelength dependence of r50 is independent of size at all redshifts, concentration decreases more sharply in the far-UV (∼1500 Å) for large galaxies at z ∼ 1. This decrease in concentration is caused by a flattening of the inner ∼20% of the light profile in disk-like galaxies, indicating that the central regions have different UV colors than the rest of the galaxy. We interpret this as a bulge component with older stellar populations and/or more dust. The size-dependent decrease in concentration is less dramatic at z ∼ 2, suggesting that bulges are less dusty, younger, and/or less massive than the rest of the galaxy at higher redshifts. Key words: cosmology: observations – galaxies: formation – galaxies: high-redshift – galaxies: structure Online-only material: color figures observations are consistent with theoretical models of gas-rich turbulent disks where clumps are supported by infalling cold streams of gas (Bournaud et al. 2007; Bournaud & Elmegreen 2009). There are alternative models involving mergers (e.g., Robertson & Bullock 2008), which may be important for a subset of galaxies at these redshifts, but fragmented structures in sources with clear rotation curves suggest that this is not the dominant mechanism (Genzel et al. 2008; Fruchter & Sosey 2009; Law et al. 2009; Shapiro et al. 2009). At higher redshifts, rest-frame UV imaging with ACS reveals that most z > 2 star-forming galaxies are clumpy, disturbed and disk-like in the rest-frame UV, with only ∼30% having light profiles consistent with galactic spheroids (e.g., Ferguson et al. 2004; Elmegreen & Elmegreen 2005; Lotz et al. 2006; Ravindranath et al. 2006; Petty et al. 2009). These studies find typical half-light radii of ∼2 kpc at z ∼ 2–3 and a size evolution that scales approximately as H −1 (z). Although the UV wavelength dependence of galaxy structure has not been studied at high redshift, such studies have been carried out on well-resolved galaxies in the local universe. Taylor-Mager et al. (2007) found that morphology changes occur as one observes bluer in the UV, with galaxies becoming less concentrated, clumpier and more asymmetric. We can obtain a clearer picture of the young stars in galaxies at 0.5 � z � 1.5 by studying their rest-frame UV emission at λ ∼ 1000–4000 Å. Previous studies of star-forming galaxies in this redshift range were performed without the aid of observed-frame UV imaging (e.g., Bruce et al. 2012; Wuyts et al. 2012, 2013) or with relatively shallow imaging in a single filter (Voyer 2011; Rutkowski et al. 2012). In this paper, we use data taken as part of a program (GO 11563, PI: Teplitz) to obtain UV imaging of the Hubble Ultra Deep Field (hereafter UVUDF) and study intermediate-redshift galaxy structure in
1. INTRODUCTION Observations of galaxies at rest-frame ultraviolet wavelengths (λ ∼ 1500 Å) are important for tracing the evolution of star formation and dust obscuration. Until recently, the study of the structural properties of galaxies in the rest-frame ultraviolet has focused on z � 2, as wavelengths 50% detection efficiency, is mAB = 27.7, 27.7, 28.2 for F225W, F275W, and F336W, respectively. For all individual galaxies, we determined redshifts using a Bayesian photo-z (BPZ) algorithm (Ben´ıtez 2000; Ben´ıtez et al. 2004; Coe et al. 2006), but the UVUDF catalog also includes spectroscopic redshifts, compiled by Rafelski et al. (2009) from a range of sources (Le F`evre et al. 2004; Szokoly et al. 2004; Vanzella et al. 2005, 2006, 2008; Popesso et al. 2009). We 9
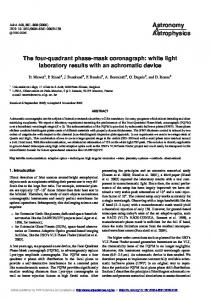
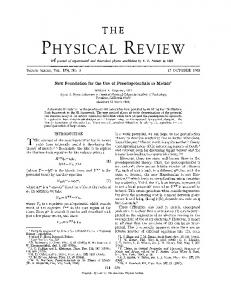
Figure 1. Photometric redshift plotted against the spectroscopic redshift for 33 galaxies in the UVUDF. The photometric redshifts have a scatter in Δz/(1 + z) of σz = 0.030, after excluding one 3σ outlier, and the mean has a bias of Δz/(1 + z) = 0.008 ± 0.006.
also include new measurements from Balestra et al. (2010) and Kurk et al. (2013), giving a total of 33 0.5 < z < 1.5 galaxies with spectroscopic redshifts. We demonstrate the accuracy of the photometric redshifts in Figure 1 by comparing them to spectroscopic redshifts for these galaxies. The photometric redshifts have a scatter in Δz/(1 + z) of σz = 0.030 over the range, 0.5 < z < 1.5. In addition, there is a bias of (zphot − zspec )/(1 + z) = 0.008 ± 0.006, which we find to be insignificant at 2, see Section 2.2 for more detail on the signal-to-noise requirements). Our source catalog is 100% complete for all galaxies brighter than this magnitude cut. The final luminosity-limited samples contain 198 galaxies at 0.5 < z < 1.5 and 400 galaxies at 1.5 < z < 2.5. 2.2. Structural Diagnostics We measure galaxy sizes with a Petrosian-like radius (Petrosian 1976); specifically, the radial distance at which the
http://www.stsci.edu/hst/wfc3/tools/cte_tools
2
The Astrophysical Journal, 791:18 (10pp), 2014 August 10
Bond et al.
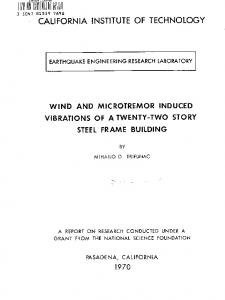
Figure 3. Fractional difference in r50 as a function of distance from the CCD readout for UVIS Chip 1 (top) and UVIS Chip 2 (bottom). Black triangles indicate individual galaxies, while red squares indicate the median differential radius in 10 object bins. Each panel includes a linear least squares fit (dashed line) to the data, both of which are consistent with the zero line (solid line) at