Concepts of uncertainty modeling and fragility assessment in earthquake engineering and their applications in consequence-based engineering (CBE) of.
The Role of Fragility Assessment in Consequence-Based Engineering Y. K. Wen,a… M.EERI, and B. R. Ellingwoodb… Concepts of uncertainty modeling and fragility assessment in earthquake engineering and their applications in consequence-based engineering 共CBE兲 of buildings in a region of low-to-moderate seismicity are presented. Efficient treatment of uncertainties in components and systems that are major contributors to building vulnerability is an essential ingredient of risk assessment and decision making. Current methodologies are reviewed first. A framework for fragility analysis then is demonstrated using an unreinforced masonry building as an example. The importance of fragility analysis in various stages of risk assessment, loss estimation, and decision making in CBE to achieve the desirable long-term objective in reduction of loss and consequence with the most efficient intervention measures is clearly indicated. Current research issues related to vulnerability assessment are identified. 关DOI: 10.1193/1.1979502兴 INTRODUCTION Provisions governing earthquake-resistant design of buildings and other structures found in codes of practice historically have been aimed at preserving life safety. These provisions have tended to be prescriptive in nature, making them easy to use and interpret but providing little guidance for the exercise of professional judgment in addressing other building performance issues. Many buildings designed by traditional prescriptive criteria failed to perform according to expectations during the recent Loma Prieta 共1989兲 and Northridge 共1994兲 earthquakes. These failures in building construction have been widely publicized, and public awareness of building performance issues is increasing as a result. Although loss of life due to these events was relatively low 共indicating that building codes fulfilled their goal of assuring life safety兲, insured losses from these two events were in excess of $20 billion, and total economic losses were far greater. In regions of low to moderate seismicity in the eastern United States, where building code provisions for earthquake-resistant design are rudimentary or non-existent, the potential for damage is greater yet. Contrary to the belief of the citizenry and many architects and engineers, buildings and other structures designed by traditional codes are not disasterproof, and this realization has caused the profession to focus on the attributes of acceptable structural performance 共beyond life safety兲 and on how to achieve them in structural design. The new paradigm of consequence-based engineering 共CBE兲 共Abrams 2002兲 is a a兲
Department of Civil and Environmental Engineering, University of Illinois at Urbana-Champaign, 205 N. Mathews, Urbana, IL 61801 b兲 School of Civil and Environmental Engineering, Georgia Institute of Technology, Atlanta, GA 30332-0355
861
Earthquake Spectra, Volume 21, No. 3, pages 861–877, August 2005; © 2005, Earthquake Engineering Research Institute
862
Y. K. WEN AND B. R. ELLINGWOOD
methodology for managing risk and predicting likely socioeconomic impact to the public through targeted attention to key elements in distributed civil infrastructure systems within a region at earthquake risk. A key element of consequence-based engineering is the development of seismic fragilities that describe the vulnerability of these key elements and depict the probability of failure under various earthquake scenarios. This paper summarizes methods for fragility assessment, and identifies potential benefits and research challenges associated with implementing this new paradigm in managing earthquake risk in mid-America. TECHNICAL APPROACH CBE is a framework requiring, first of all, an identification of the earthquake hazard, a method for rapidly assessing vulnerability of the systems that are potentially at risk, and the likely consequences of seismic events to a local region. A decision is then made on whether consequences are acceptable according to stakeholders’ need. If not, a further, more refined and detailed assessment of the situation 共damage synthesis兲 is carried out to reduce the consequences to an acceptable level. Compared with performancebased engineering 共PBE兲, CBE is more of a two-stage risk management decision tool, one that is further distinguished by its focus on the regional local impact of earthquake events rather than on individual building response. Thus, the two concepts are complementary to one another. The need for a rapid assessment methodology stems from the fact that the vast majority of civil infrastructure in mid-America has been designed without consideration of seismic hazards, and risk assessment must focus on a small subset of the infrastructure that is essential for public health and economic well-being. In this decision-making process, treatment of uncertainty is essential. Depending on the nature of the decision and the level of detail, different methodologies may be used to suit the purpose. Fast, approximate methods may be used in the first stage, followed by detailed, more elaborated methods in the second stage. To develop appropriate methodologies for the above purposes, we begin with a review and critical appraisal of current methods for modeling and analysis of uncertainty in earthquake engineering and application to performance evaluation and design 共Wen et al. 2003兲. Based on this appraisal, a framework for uncertainty assessment suitable for CBE is proposed and is illustrated using an unreinforced masonry building as an example. Performance assessment of individual buildings is a necessary first step toward developing the regional loss assessment required in CBE, and is the point where CBE and PBE most clearly interface. We conclude with a discussion of some current issues that distinguish fragility and vulnerability assessment in mid-America from the western United States and other regions of high seismicity. DEMAND, FRAGILITY, AND LIMIT-STATE PROBABILITY
One begins the performance assessment of the components and systems that are dominant contributors to risk by identifying potential limit states 共LS兲 under future earthquake excitations. In a narrow structural engineering sense, such limit states may be either strength or deformation-related. In a broader socioeconomic context, they may be related to repair costs and losses, including deaths and injuries. The limit-state prob-
THE ROLE OF FRAGILITY ASSESSMENT IN CONSEQUENCE-BASED ENGINEERING
863
ability over a given period of exposure 共customarily chosen as 1 or 50 years, depending on whether annualized or lifetime risk is relevant to decision making兲 can be used to describe the performance or safety of the components or systems as follows:
Pt共LS兲 =
冕 P共LS兩D = r兲f 共r兲dr ⬁
D
共1兲
0
in which fD共d兲 = the probability density function of the demand D during 共0, t兲. The demand D could be the maximum structural displacement or excitation intensity measured in terms of peak ground or spectral acceleration, or other intensity measure during the period of interest, depending on the purpose of the analysis. The demand can be described by a random variable depending on the seismicity and the system response characteristics. The conditional probability term in the above equation, P共LS兩 D = d兲, is often referred to as the fragility, which is a function of the component or system capacity and its uncertainty with respect to a given limit state. Assessment of performance and risk therefore depends on accurate modeling of the uncertainty, both aleatory 共inherent randomness兲 and epistemic 共modeling errors or deficiencies in supporting databases兲, in the capacity and demand. RAPID ASSESSMENT OF VULNERABILITY
For regions of low to moderate seismicity, the response of most systems to earthquake ground motion may be well within the linear elastic range. For such systems, or for simple nonlinear systems that can be represented by an equivalent single-degree-offreedom 共SDOF兲 inelastic system 共Collins et al. 1996兲, a rapid assessment of fragility can be performed without going through repeated time-history response analyses. An excitation intensity measure such as the spectral acceleration at the fundamental period of the building, Sa, can be obtained from the response spectrum. The structural demand parameter, D, is expressed as a function of Sa 共or the ith-mode spectral accelerations, Sia, in the case of a building modeled as a multi-degree-of-freedom system兲, multiplied by a correction factor to account for uncertainty in the simple method of analysis. For example, if the demand variable is maximum interstory displacement at a given floor and the excitation intensity measures are the spectral accelerations of the first n modes,
冑兺 n
D ⬇ Ng共s兲 = N
␥igi共Sia兲2
共2兲
i=1
in which functions gi are the interstory drifts due to ith mode, and ␥i is the ith modal participation factor. Factor N is the correction factor for modeling and analysis errors. Terms Sia can be determined from the uniform hazard response spectra. The modal contributions are combined using the SRSS rule to obtain an approximate evaluation of the combined maximum response. 共Alternatively, with some additional computation, one could also use the CQC rule 关Der Kiureghian 1980兴, which also includes the modal correlations.兲 The bias and uncertainty in N can be estimated from a comparison of predictions from Equation 2 to the results of nonlinear finite element analyses of the same system 共limited in number兲, supplemented by professional judgment. Once the functions gi
864
Y. K. WEN AND B. R. ELLINGWOOD
and the bias and uncertainty in the correction factor N are established, the probabilistic demand curve of D can be detemined; this demand curve considers both the modeling errors and uncertainty in seismic hazard. If the bias factor is modeled by a lognormal distribution and the seismic hazard is described in terms of the maximum spectral acceleration in time interval 共0, t兲, the probabilistic demand curve can be calculated as follows:
Pt共D ⬎ d兲 =
冕 再1 − ⌽冋 ln d−
D兩S=s
D兩S=s
册冎
fSa共s兲ds
共3兲
in which D兩S=s兩 = ln µNg共s兲 − 1/22D兩S = s兩 D兩S=s兩 = 冑ln共1 + ␦2N兲 ⌽共 兲 = standard normal probability integral; and fSa共s兲 = density function of maximum spectral acceleration in 共0,t兲. The uncertainty in the seismic excitation intensity measure and the bias 共µN = mean value of N兲 and uncertainty 共␦N = coefficient of variation of N兲 in modeling and analysis are therefore properly combined in Equation 3. Similarly, for an inelastic system that can be represented approximately by an SDOF inelastic system with a given deflection shape 共e.g, Collins et al. 1996兲, the displacement demand can be approximately described by an uniform hazard inelastic response spectrum. The demand spectrum, expressed in terms of the the system yield coefficient Cy 共system yield force/system weight兲 and the system ductility ratio , can be obtained from the uniform hazard acceleration spectrum of the linear system 共e.g., Miranda and Bertero 1994兲. One can therefore establish the relationship between the ductility demand and the spectral acceleration for the nonlinear system as
= Ng共Sa兲
共4兲
in which g共Sa兲 is the functional relationship between and Sa based on the uniform hazard inelastic response spectra. The correction factor, N, for the bias and uncertainty in this approximate method may differ from the value of N in Equation 2, although it is determined by similar methods of analysis. Once the statistical parameters and distribution for N have been established, the probabilistic ductility demand curve can be obtained. The probabilistic demand curve of the system can be used to evaluate the limitstate probability by Equation 1 when the system capacity against a given limit state and its uncertainty are known. DETAILED ASSESSMENT OF VULNERABILITY SAC/FEMA APPROACH
In the second stage of CBE, where a more detailed analysis may be required or where a complex nonlinear structural system must be evaluated, time-history response
THE ROLE OF FRAGILITY ASSESSMENT IN CONSEQUENCE-BASED ENGINEERING
865
analyses may be required to evaluate the limit-state probability. The SAC/FEMA approach 共Cornell et al. 2002兲 may be used to determine the probabilistic demand curve. In this approach, a simple power law relationship between demand, D, and spectral ordinate, S, is developed from the results of time-history analysis of prototypical 共generally nonlinear兲 systems subjected to representative natural or synthetic ground motion records, yielding
共5兲
D = aSb
This power law is developed by a straightforward linear regression analysis to deter˜ mine the constants a and b and the conditional median of D given S, D 兩S=s兩, and also the conditional coefficient of variation of D given S, ␦D兩S=s兩, assumed to be a constant as an approximation. This coefficient of variation models the uncertainty in system response due to the nonstationarity in phasing and intensity of the ground motion. While other nonlinear equations may be used if they fit the relationship between D and S better, research to date 共e.g., Giovinale et al. 2004兲 indicates that Equation 5 is sufficiently accurate, given the inherent variability in seismic demand and system response. Moreover, the fact that b typically is close to 1.0 for buildings with periods in excess of approximately 0.5 sec is a confirmation of the “equal displacement rule” first observed by Newmark, Veletsos, Chelapati, and others four decades ago. A proper distribution function 共generally, the lognormal CDF is a good fit兲 is then selected for D, from which the fragility curve can be determined. The seismic hazard, expressed in terms of the annual probability that the spectral acceleration S exceeds s, can be modeled approximately 共over the range of accelerations that contribute significantly to risk兲 by the power law relationship
Ht共s兲 = k0s−k
共6兲
Equations 5 and 6 allow one to evaluate the probability of demand in closed form 共cf. Equation 3兲:
冋
Pt共D ⬎ d兲 = Ht共sd兲exp
1 k2 2 ␦ 2 b2 D兩S=s
册
共7兲
in which sd = 共d / a兲1/b is the spectral acceleration level corresponding to the demand, d, according to Equation 5. If, in addition, the system capacity is modeled as a lognormal random variable, with median mC and dispersion ␦C, a point estimate of the limit-state probability, D ⬎ C, can be obtained by convolving Equation 7 with the density of C, yielding ˜
2 + ␦C2兲/2兴 Pt = H共sC兲exp关共k/b兲2共␦DR
共8兲 ˜
in which the substitution ␦DR = ␦D兩S=s兩 has been made for brevity and sC = 共mC / a兲1/b = spectral acceleration that corresponds to the median capacity. Equations 7 and 8 reflect aleatory uncertainty 共or inherent randomness兲. A point estimate of risk that includes the epistemic 共or modeling兲 uncertainty is given by the mean 共in a Bayesian sense兲 limit-
866
Y. K. WEN AND B. R. ELLINGWOOD
state probability, E关Pt兴, determined as follows 共Cornell et al. 2002兲: ˜
E关Pt兴 = E关Ht共sC兲兴exp
冋
1 k2 2 共␦ + ␦2 + ␦2 + ␦2 兲 2 b2 DR DU CR CU
in which ˜
˜
冋 册
E关Ht共sC兲兴 = Ht共sC兲exp
1 2 ␦ 2 HU
册
共9a兲
共9b兲
˜
where sC is the spectral acceleration corresponding to the median displacement capacity, ˜ , determined from Equation 5. Subscripts DR, DU, CR, CU, and HU on coefficient of C variation ␦ indicate demand randomness, demand uncertainty, capacity randomness, capacity uncertainty, and hazard uncertainty, respectively. UNIFORM HAZARD GROUND MOTION APPROACH
For complex nonlinear systems, a simple intensity measure may not be adequate to predict the system demand, and a time-history analysis under uniform hazard ground motions may be necessary to evaluate the limit-state probability. For example, in the SAC Project, records were selected and scaled to match the uniform response spectra for a wide range of natural period and corresponding to 50%, 10%, and 2% in 50 years exceedance probabilities at the site 共Somerville et al. 1997兲. In areas where such records are not available, such as in the central and eastern United States, synthetic ground motions corresponding to a uniform hazard response spectrum can be generated for this purpose 共Wen and Wu 2001兲. These ground motions represent future excitations due to events of various magnitudes, distances, and attenuation, but all match the target response spectra for a given probability over a wide period range. Since the matching is done at the median of the response spectra, the median of the structural response under the suite of the uniform hazard ground motions is a consistent measure of the displacement demand corresponding to that hazard level. Wen and Wu 共2001兲 have shown that the median response obtained for both linear and nonlinear inelastic systems from a suite of 10 uniform hazard ground motions has a small coefficient of variation 共 ⬍10% 兲 and closely matches the response corresponding to the hazard level based on simulation of large 共9,000兲 samples. The complementary cumulative distribution modeling the demand can be then obtained by fitting a distribution 共a lognormal distribution is generally a good model兲 through these three probability levels 共50%, 10%, and 2% in 50 years兲. This procedure eliminates the need to identify a proper intensity measure and to perform the regression analysis required in the SAC/FEMA approach. The effect of capacity and modeling uncertainty can be then incorporated into the limit-state probability via a correction factor 共Wen and Foutch 1997兲 similar to Equations 8 and 9. While a comparison of limit-state probabilities by these two methods is problematic because of differences in the ensembles of ground motions used in their development 共the SAC/ FEMA approach utilized a mix of natural and synthetic ground motions, while the Wen/Wu ground motions are entirely synthetic兲, they appear to be consistent in terms of order of magnitude, as will be shown in the following illustration.
THE ROLE OF FRAGILITY ASSESSMENT IN CONSEQUENCE-BASED ENGINEERING
867
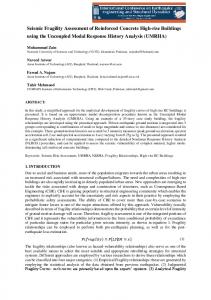
Figure 1. Hysteretic behaviors of different wall damage modes.
EXAMPLE OF VULNERABILITY ANALYSIS OF A URM BUILDING A large percentage of building stock in mid-America consists of unreinforced masonry 共URM兲 structures. Such buildings are vulnerable to seismic forces and their failures may cause serious consequences. Yet response behavior of such buildings is quite complex and the uncertainty in their capacity is large. To illustrate and compare the SAC/FEMA and uniform hazard methods of uncertainty modeling described above, a study of the fragility and vulnerability of such a building has been conducted. The building selected was a two-story residential/commercial building of 1930 vintage located in Memphis, Tennessee. A finite element model based on ABAQUS was developed to model the nonlinear dynamic response behavior. Hysteresis models for three different modes of structural behavior leading to damage 共bed-joint sliding, rocking, and diagonal tension cracking兲 of the masonry walls were considered 共Figure 1兲. The diaphragm/wall connections are modeled either as flexible 共relying on gravity friction, bolts, and nails for a typical connection detail for such a structure兲, or as rigid after retrofit. Typical nonlinear response behaviors of the walls with rigid connections are shown in Figure 2. The system performance levels selected are Immediate Occupancy 共IO兲, Life Safety 共LS兲, and Collapse Prevention 共CP兲, corresponding to maximum drifts of 0.3%, 0.6%, and 1.0%, respectively, as described in FEMA-273 共ATC 1997兲 and FEMA-356 共ASCE 2000兲. For comparison, the Incipient Collapse 共IC兲 level considered in the FEMA/SAC procedure, determined from an incremental dynamic analysis 共IDA兲 共Vamvatsikos and Cornell 2002兲, performed using the uniform hazard ground motions 共UHGM兲 generated for Memphis in Wen and Wu 共2001兲, was also considered. Figure 3a illustrates the regression of interstory drift on spectral acceleration at the fundamental period 共T1 = 0.55 sec兲 of the URM building with rigid wall/diaphragm connections under the Memphis UHGM. Typical results from the IDA analyses are shown in Figure 4a. The drift ratios at the transition points of these curves when there is a large increase in displacement at a small increase in spectral acceleration can be used to define the capacities against incipient collapse. These points are not always as obvious from Figure 4a as they were in the IDAs performed in the SAC Project, which addressed steel moment frames and where IC was defined as the point where the slope decreased to 20%
868
Y. K. WEN AND B. R. ELLINGWOOD
Figure 2. Time history and force-displacement relationship under 2 / 50 ground motions: 共top兲 bed-joint sliding mode of 1st floor south wall, and 共bottom兲 rocking mode of 2nd floor north wall.
of the initial 共elastic兲 value. Such a definition may not be reasonable for a URM system, which lacks the ductility of a steel moment frame. It should be noted that the drift ratio capacities thus selected are somewhat subjective 共Maison and Bonowitz 2004兲. The results are fitted by a lognormal distribution, as shown in Figure 4b, as the fragility curve of IC due to the randomness of the excitation only. The points identified in Figure 4b 共with a median of 1.74% and a COV of 0.33兲 tend to be larger than the recommended limit of 1% for IC in FEMA-273, confirming the conservative nature of those earlier FEMA recommendations. An example of the probabilistic displacement demand curve of the building with rigid connections is shown in Figure 5a. Note that the data points correspond to different UHGMs and the uncertainty refers to that of the record-to-record variability across the UHGM. The 50-year limit-state probabilities of IO, LS, CP, and IC were also calculated according to Equation 1. Capacity uncertainties due to material properties and other sources were assumed as shown in Table 1. These values were doubled to check the sensitivity 共the last two rows of Table 1 for the case of rigid connections兲. Notice also that the vulnerabilities are not particularly sensitive to the capacity uncertainties because of the dominance of the uncertainty in the seismic excitation, which is much larger than that in the capacity. It can easily be seen from Figure 5a that
THE ROLE OF FRAGILITY ASSESSMENT IN CONSEQUENCE-BASED ENGINEERING
869
Figure 3. Regression analysis of building response under Memphis uniform hazard ground motions: 共a兲 wall drift ratio 共rigid connections兲, and 共b兲 diaphragm slip 共gravity connections兲.
at low probability levels, the demand curve is very flat; changes in drift capacity uncertainty in this range have only a small effect on the exceedance probability. To further the comparison of the SAC/FEMA and uniform hazard approaches, we have computed the probability that the URM building 共rigid diaphragm/wall connec-
Figure 4. Building incipient collapse capacity analysis: 共a兲 incremental dynamic analysis 共IDA兲 using Memphis uniform hazard ground motions, and 共b兲 lognormal fit of incipient collapse capacity.
870
Y. K. WEN AND B. R. ELLINGWOOD
Figure 5. URM Building demand curves using 10% and 2% in 50 years uniform hazard ground motions at Memphis: 䊐 denotes data point corresponding to each UHGM, 䊊 denotes median value, effect of uncertainty due to record-to-record variability across UHGMs considered 共solid line兲, not considered 共dashed line兲: 共a兲 wall drift demand curve 共rigid connections兲, and 共b兲 diaphragm slip demand curve 共gravity connections兲.
tions兲 exceeds a drift of 0.5% using Equation 8 and compared it to the results presented in Figure 5a. This comparison requires that the parameters a and b in Equation 5 be determined for the masonry building, and that an estimate of seismic hazard parameters ko and k in Equation 6 be determined for Memphis, Tennessee. From regression analysis using the UHGMs shown in Figure 3a, we obtain a = 0.0075 and b = 1.02. The spectral acceleration corresponding to a drift of 0.5% is therefore obtained as 0.67 g. Using the USGS web site for Memphis, Tennessee, zip code 38118 共http://geohazards.cr.usgs.gov兲, we obtain ko and k = 3.2⫻ 10−4 and 1.09, respectively. Substituting these values into
Table 1. 50-year limit-state probability of URM building with rigid connections
Limit State
Immediate Occupancy 共IO兲
Life Safety 共LS兲
Collapse Prevention 共CP兲
Incipient Collapse 共IC兲
Reference Median Drift Ratio Capacity 共%兲 Standard Deviation of Capacity 共%兲 Limit-State probability Standard Deviation of Capacity Limit-State Probability
FEMA-273 0.3 0.3 3.75⫻ 10−2 0.6 4.06⫻ 10−2
FEMA-273 0.6 0.3 2.11⫻ 10−2 0.6 2.30⫻ 10−2
FEMA-273 1 0.3 1.35⫻ 10−2 0.6 1.495⫻ 10−2
IDA analysis 1.74 0.33 8.36⫻ 10−3
THE ROLE OF FRAGILITY ASSESSMENT IN CONSEQUENCE-BASED ENGINEERING
871
Figure 6. Gravity connection element response behavior based on contact mechanics model: 共a兲 time history of slip, and 共b兲 force-displacement hysteresis.
Equation 8, we obtain the annual probability of drift ratio exceeding 0.005 to be 4.94 ⫻ 10−4. From Figure 5a, the 50-year probability of drift ratio exceeding 0.005 is 2.6 ⫻ 10−2, which can be converted into an annual probability of 5.26⫻ 10−4. In view of the different bases for the two methods and the large uncertainties in the seismic hazard analysis, the agreement is quite good. Most existing unreinforced masonry buildings in mid-America have either none or only minimal diaphragm/wall connection fixtures such as steel straps nailed to the floor joists. For such buildings, the friction due to gravity provides most of the lateral resistance. Diaphragm slipping resulting in falling or impacting the walls could cause collapse, as has been observed in past earthquakes. Connection elements based on contact mechanics are developed and incorporated into the ABAQUS model. Figure 6 shows a typical time history of slip and the hysteresis of this element during a 2 / 50 earthquake. Figure 3b shows the regression analysis of diaphragm slip versus PGA and Figure 5b shows the probabilistic demand curve for slip. It is seen that the diaphragm slip demand has larger scatter compared to the drift demand on the walls. If the diaphragm anchor is 2 in, from Figure 5b, the 50-year probability of diaphragm falling is about 0.015. If the building is retrofitted to have rigid connections, the 50-year probability of incipient collapse due to excessive drift is 0.00836 共Table 1兲. Details of the nonlinear models for the wall and connections and similar results for steel, reinforced concrete, masonry, and light-frame wood construction are given in Wen et al. 共2004兲.
872
Y. K. WEN AND B. R. ELLINGWOOD
CURRENT RESEARCH ISSUES Several research issues that challenge the use of the fragility assessment procedures described above in consequence-based engineering and risk management are reviewed briefly in the following paragraphs. These issues are topics currently under investigation in research conducted under MAE Center sponsorship. GROUND MOTION MODELING
The U.S. Geological Survey web site provides estimates of spectral acceleration at periods of 0.2 s and 1.0 s and at several return periods for rock at any specified latitude and longitude or zip code in the continental United States. That information can be used to construct a mean 5%-damped response spectrum at those return periods. To assess the performance of a building or other structure at that site, a suite of ground motion records is required. The nonstationary nature of the ground motion in both frequency and time domains must be captured to achieve a reasonable simulation of performance in the nonlinear response range, and most recent studies of building performance in the western United States have been able to use scaled accelerograms that capture this nonstationarity naturally. In mid-America and other areas of historically low seismicity where natural ground motions are limited or nonexistent, the uncertainty resulting from this process may be large, and scaling existing ground motions may not be appropriate. On the other hand, it has been found that synthetic accelerograms may fail to capture adequately certain ground motion characteristics such as nonstationary intensity and frequency content. Methods for constructing appropriate ensembles of ground motion for different site conditions must be standardized in order for independent investigators and decision makers to achieve consistent and auditable results. Furthermore, CBE involves regional damage and loss assessment using quantitative seismic risk analysis tools; this requires that the variation in ground motion intensity over an urban, county, or state area be modeled. Techniques must be developed for adjusting suites of ground motion to take local site conditions, spatial correlation, and regional variations into account in CBE. Many recent studies of individual structural systems have adopted spectral acceleration to describe the intensity of strong ground motion and its impact on the built environment. The spectral acceleration has been identified as the intensity measure for which the 共aleatory兲 uncertainty in demand is relatively small 共Giovinale et al. 关2004兴 denote this as “efficiency.”兲 Whether this characterization is optimal for distributed facilities 共an end goal in CBE兲 is an open question. Moreover, the importance of other ground motion parameters—velocity, frequency content, duration—for fragility and loss assessment has not been examined thoroughly. STRUCTURAL BEHAVIOR AND FACILITY RESPONSE
The underlying system reliability analysis relies on the fidelity of the finite element 共FE兲 platform, which must be validated for the buildings and other facilities to which it is applied 共Song and Ellingwood 2001, Wang and Wen 2000兲. Computational platforms for assessing response of individual facilities and complex systems of facilities to earthquake ground motion have increased in their levels of sophistication during the past decade 共e.g., Gupta and Krawinkler 2000兲. Notwithstanding these improvements, the
THE ROLE OF FRAGILITY ASSESSMENT IN CONSEQUENCE-BASED ENGINEERING
873
epistemic uncertainties associated with the use of these platforms by different analysts, who may be equally well qualified but who are working independently with competing platforms, are substantial. Two major sources of such uncertainties arise from 共1兲 differences 共often subtle兲 in the capabilities and limitations of the platforms, e.g., their models of nonlinear structural action in beam-column elements, and 共2兲 differences in the way that analysts may choose to model the systems of interest—granularity, simplifying assumptions, and similar factors. The fundamental attributes of the FE methods used to analyze the system must be identified and agreed upon. Otherwise, the fragility models or vulnerability assessments of decision alternatives, supported by such FE analyses, may not be comparable and the ranking of preferences may not be ordinally correct. Variations in response obtained using alternate FE platforms are part of the epistemic uncertainty in the CBE decision process, and must be displayed along with the other uncertainties in the risk analysis. The display of epistemic uncertainties is a customary ingredient of risk-informed decision making regarding essential facilities 共Kennedy and Ravindra 1984, Ellingwood 1990, Elms 2004兲, such as chemical and nuclear power plants, but has only recently been introduced to civil infrastructure systems. PERFORMANCE MEASUREMENT AND LOSS ASSESSMENT
Performance metrics for consequence-based engineering must be established. At the most fundamental level, such performance metrics would include lives lost, injuries, facility damage as a percentage of replacement cost, and losses due to economic disruptions, business downtime, and lost opportunities 共both direct and indirect losses兲. One of the foremost research issues is how exactly to measure such losses and assign uncertainties to them for decision purposes. In addition, facility performance objectives must be mapped to the space of structural analysis and design variables 共e.g., “life safety” must be related to a load or deformation that is computed through finite element analysis 关Ellingwood 2001a兴兲. This mapping process and the uncertainties that are part of it are a major research challenge to the development and implementation of CBE. Most previous studies have measured vulnerability as the cost to repair damage 共or economic loss兲, expressed as a fraction of replacement cost 共e.g., Singhal and Kiremidjian 1996, Whitman et al. 1997, Kircher et al. 1997兲. The normalized cost ratio depends on the nature of the building occupancy as well as the type of structural system, and must be determined for general categories of building occupancy 共e.g., general offices, single-family and multifamily residential, commercial and industrial兲. Existing databases tend to be biased, in the sense that more severely damaged buildings tend to be inspected more carefully, skewing the damage statistics toward more heavily damaged facilities. Conversely, lightly damaged buildings may not be inspected or evaluated. Biases in current loss assessment procedures must be identified. SUPPORTING DATABASES
Sources of uncertainty, both aleatory and epistemic in nature, must be taken into account in decision analysis. There is a need to identify significant 共and insignificant兲 sources of uncertainty and to establish protocols on the collection and modeling of those uncertainties that are identified as being significant to the decision process. Uncertainties
874
Y. K. WEN AND B. R. ELLINGWOOD
in damage and economic loss are at least as important to the overall decision process as those in structural behavior. Procedures must be developed by which uncertainties based on small samples can be updated as additional information becomes available 共e.g., Gardoni et al. 2002兲, making the fragility assessment a living process. An ability to make decisions regarding building re-occupancy immediately following the occurrence of an earthquake and having decision support tools to identify strategies for repair or retrofit of damaged structures are compelling needs. RISK COMMUNICATION AND DECISION
Numerous risk communication issues and challenges arise in the strategies selected for presenting information to the stakeholders of CBE—structural engineers, building owners or occupants, regulators, lenders and insurers, and urban planners. There are tradeoffs between potential losses and the cost of reducing expected losses. CBE will fail to achieve its objectives if performance and risk issues cannot be explained to various stakeholder groups and decision makers in understandable terms. Most stakeholders are not trained in or comfortable with the tools of quantitative risk analysis, especially when the decision process involves very rare events. As a specific example, modern building codes and standards in the United States stipulate the designbasis earthquake as an event with a 2% probability of being exceeded in 50 years 共or a 2,475-year mean recurrence interval event兲. Most nontechnical stakeholders have difficulty in understanding either of these measures. In particular, they interpret the return period as meaning that the earthquake will occur every 2,475 years; they find it confusing or incredible when informed that this is not the case, and their incredulity diminishes the value of the risk analysis. Stating that the design 共or scenario兲 earthquake is one with a magnitude 7 occurring 20 km from the site of the facility is more understandable. Unfortunately, such a statement requires that the earthquake hazard at the site be deaggregated, a process that carries uncertainties of its own. A related issue arises in establishing confidence in the risk or loss assessment. To illustrate this point, suppose that a building structural system is designed for the 10% / 50 year earthquake, which is related to the Life Safety performance objective. The median probability of failure threatening life safety, obtained by convolving the fragility with the median seismic hazard curve, might be on the order of 10−4 / year 共e.g., from Equation 8兲 for a typical code-compliant structure. How should this risk be communicated to the building owner? By saying, “The probability of damage or failure endangering life safety is 10−4 / year or less”? or, “It is 90% likely that the objective of life safety in 50 years will be achieved”? The underlying risk is the same 共10−4 / yr兲, but the two statements are based on different viewpoints and information and convey different messages. The first focuses on overall annual failure risk, while the second interprets risk in terms of successful performance under a 50-year design-basis event, ignoring the role of fragility. Stakeholders may react to such statements differently. Note that the uncertainty in the estimated risk metric 共arising from modeling assumptions and limitations in the supporting databases兲 is not reflected in either statement, making it difficult to judge its credibility. The collective effect of the various sources of epistemic uncertainty on the quality of the probability estimate can be characterized by a Bayesian dis-
THE ROLE OF FRAGILITY ASSESSMENT IN CONSEQUENCE-BASED ENGINEERING
875
tribution. This distribution 共analogous to a sampling distribution in classical statistics兲 can be used to derive confidence statements that convey a sense of the credibility of the estimate, e.g., “I am 95% confident that the probability of not meeting the performance objective is less than 10−4 / year,” an affirmation that presumably would be viewed more strongly than the one at the beginning of the paragraph. One difficulty with this approach is in assigning an appropriate confidence level for decision purposes. Most stakeholders cannot distinguish among 90%, 95%, or 99% confidence levels, viewing all as “highly confident or credible;” yet, the decision variable may be sensitive to the confidence level assigned or required. Another difficulty is in the complexity, i.e., a probability of a probability is a concept that some find difficult to grasp. It seems likely that several alternatives might be necessary for conveying a sense of epistemic uncertainty and quality of the decision variables. In turn, the alternative selected may have an impact on the manner in which epistemic uncertainties are propagated through the decision analysis. There is a similar issue in communicating uncertainties in losses. Structural reliability applications over the past two decades, which have been built around the concept of “notional probabilities,” have facilitated significant advances in structural codes and standards. On the other hand, notional reliabilities are of limited usefulness in decision models that require estimates of expected losses from different hazard scenarios. Such models are at the core of quantitative vulnerability and loss assessment methodologies. Efforts should be directed to quantifying limit-state probabilities and risks in such a way that they can be compared directly to risks from other human endeavors 共Ellingwood 2001b兲. In situations where the system analysis models are rudimentary or databases are incomplete, measures should be assigned to such sources of epistemic uncertainty, and should be displayed as part of the CBE process. Calculated earthquake scenario risks 共expressed in terms of probabilities兲 should be benchmarked against other socially acceptable risks 共Ellingwood 2001a兲. Finally, there is the issue of scope of application of structural fragility concepts in consequence-based engineering in mid-America. In the western United States, large earthquakes occur with sufficient frequency that most buildings are likely to be exposed to one or more potentially damaging events in the 50- to 100-year period that is viewed as typical for the service life of many buildings. There have been sufficient occurrences of significant damage, even in an era of modern seismic codes, that it is not difficult to persuade engineers, regulators, and policy makers that earthquake hazard reduction through a combination of code improvements for new buildings and rehabilitation of existing buildings is deserving of investment. In contrast, in the eastern United States, damaging events occur very infrequently 共the estimated return period of New Madrid– type events is about 500 years兲, and while the potential for devastation is great, the annualized losses are perceived as being much smaller than those from other natural hazards 共Stein et al. 2003兲. Under the circumstances, it is difficult to persuade stakeholders that investing in earthquake risk reduction adds value to building projects. It does not advance the cause of earthquake risk reduction in the central United States for the research community to warn that New Madrid–type events have a 10% likelihood of occurring in the next 50 years, or to belabor their possible impact. Instead, a series of carefully constructed test beds should be constructed to assess the economics of investing in
876
Y. K. WEN AND B. R. ELLINGWOOD
rehabilitation of existing buildings vs. enhancing codes for new construction. It is quite possible that optimal strategies for mitigating earthquake risk in the central and eastern United States may be quite different from those followed in regions of high seismicity. CONCLUSIONS The new paradigm of consequence-based engineering is aimed at managing seismic risk and regional losses through selective assessment and intervention of infrastructure systems critical to that region. Quantitative tools necessary to meeting that objective successfully are under development; some of these tools were described and illustrated in the preceding sections. For effective utilization in decision making and risk management, supporting databases and methods of risk communication to a broad stakeholder group must be developed. While past research on earthquake risk reduction has focused on structural engineering solutions, much of the current research is occurring at the interface of earth science, building science and engineering, and public policy. The challenges posed are equally as significant and difficult as those that involve structural reliability assessment or that are purely technical in nature. ACKNOWLEDGMENTS This paper is an extended version of one that was presented at the 9th International Conference on Applications of Statistics and Probability in Civil Engineering, held in San Francisco, California, in July, 2003. The study was supported by National Science Foundation under Grant EEC-9701785 to Mid-America Earthquake Center. Comments from D. Veneziano and J. Bracci are greatly appreciated. REFERENCES Abrams, D. P., 2002. Consequence-based engineering approaches for reducing loss in midAmerica, Linbeck Distinguished Lecture Series in Earthquake Engineering, University of Notre Dame. Applied Technology Council 共ATC兲, 1997. NEHRP Guidelines for the Seismic Rehabilitation of Buildings, prepared for the Building Seismic Safety Council, published by the Federal Emergency Management Agency, FEMA-273, Washington, D. C. American Society of Civil Engineers, 共ASCE兲, 2000. Prestandard and Commentary for the Seismic Rehabilitation of Buildings, prepared for the SAC Joint Venture, published by the Federal Emergency Management Agency, FEMA-356, Washington, D. C Cornell, C. A., Jalayer, F., Hamburger, R. O., and Foutch, D. A., 2002. Probabilistic basis for 2000 SAC Federal Emergency Management Agency steel moment frame guidelines, J. Struct. Eng. 129 共4兲, 526–533. Der Kiureghian, A., 1980. Structural response to stationary excitation, J. Eng. Mech. Div. 106 共6兲, 1195-1213. Ellingwood, B., 1990. Validation studies of seismic PRAs, Nucl. Eng. Des. 123 共2兲, 189–196. Ellingwood, B., 2001a. Earthquake risk assessment of building structures, Reliability Eng. Sys. Safety 74, 251–262. Ellingwood, B., 2001b. Acceptable risk bases for design of structures, Progress in Structural Engineering and Materials 3 共2兲, 170–179.
THE ROLE OF FRAGILITY ASSESSMENT IN CONSEQUENCE-BASED ENGINEERING
877
Elms, D. G., 2004. Structural safety—Issues and progress, Progress in Structural Engineering and Materials 6 共2兲, 116–126. Gardoni, P., Der Kiureghian, A., and Mosalam, K. M., 2002. Probabilistic capacity models and fragility estimates for reinforced concrete columns based on experimental observations, J. Eng. Mech. 128 共10兲, 1024–1038. Giovinale, P., Cornell, C. A., and Esteva, L., 2004. Comparing the adequacy of alternative ground motion intensity measures for the estimation of structural response, Earthquake Eng. Struct. Dyn. 33, 951–979. Gupta, A., and Krawinkler, H., 2000. Behavior of ductile SMRFs at various seismic hazard levels, J. Struct. Eng. 126 共1兲, 98–107. Kennedy, R. P., and Ravindra, M. K., 1984. Seismic fragilities for nuclear power plant studies, Nucl. Eng. Des. 79 共1兲, 47–68. Kircher, C. A., Nasser, A. A., Kustu, O., and Holmes, W. T., 1997. Development of building damage functions for earthquake loss estimation, Earthquake Spectra 13 共4兲, 663–682. Maison, B. F., and Bonowitz, D., 2004. Discussion of seismic performance evaluation of preNorthridge steel frames with brittle connections, J. Struct. Eng. 130 共4兲, 690–692. Miranda, E., and Bertero, V. V., 1994. Evaluation of strength reduction factors for earthquakeresistant design, Earthquake Spectra 10 共2兲, 357–379. Singhal, A., and Kiremidjian, A. S., 1996. Method for probabilistic evaluation of seismic structural damage, J. Struct. Eng. 122 共12兲, 1459–1467. Somerville, P. G., Smith, N, Punyamurthula, S., and Sun, J., 1997. Development of Ground Motion Time Histories for Phase 2 of the FEMA/SAC Steel Project, Report No. SAC/BD–97/04, SAC Joint Venture, Sacramento, CA. Song, J., and Ellingwood, B. R., 2001. Risk evaluation of steel frames with welded connections under earthquake, Struct. Eng. Mech. 11 共6兲, 663–672. Stein, S., Tomasello, J., and Newman, A., 2003. Should Memphis build for California earthquakes? EOS Trans. Am. Geophys. Union 84 共19兲, 177, 184–185. Vamvatsikos, D., and Cornell, C. A., 2002. Incremental dynamic analysis, Earthquake Eng. Struct. Dyn. 31 共3兲, 491–514. Wang, C.-H., and Wen, Y. K., 2000. Evaluation of pre-Northridge low-rise steel buildings, II: Reliability, J. Struct. Eng. 126 共10兲, 1169–1176. Wen, Y. K., Ellingwood, B. R., Veneziano, D., and Bracci, J., 2003. Uncertainty Modeling in Earthquake Engineering, Report FD-2, Mid-America Earthquake Center, University of Illinois at Urbana-Champaign 共http://mae.ce.uiuc.edu兲. Wen, Y. K., Ellingwood, B. R., and Bracci, J., 2004. Vulnerability Function Framework for Consequence-Based Engineering, Report DS-4, Mid-America Earthquake Center, University of Illinois at Urbana-Champaign 共http://mae.ce.uiuc.edu兲. Wen, Y. K., and Foutch, D. A., 1997. Proposed Statistical and Reliability Framework for Comparing and Evaluating Predictive Models for Evaluation and Design and Critical Issues in Developing Such Framework, Report No. SAC/BD-97/03, SAC Joint Venture, Sacramento, CA. Wen, Y. K., and Wu, C. L., 2001. Uniform hazard ground motions for mid-America cities, Earthquake Spectra 17 共2兲, 359–384. Whitman, R. V., Anagnos, T., Kircher, C. A., Lagorio, H. J., Lawson, R. S., and Schneider, P., 1997. Development of a national earthquake loss estimation methodology, Earthquake Spectra 13 共4兲, 643–662.
共Received 24 November 2003; accepted 17 November 2004兲