1
The Rule Induction System LERS—A Version for Personal Computers Michal R. Chmielewski*, Jerzy W. Grzymala-Busse*, Neil W. Peterson*, Soe Than*
Abstract. This paper describes the system LERS (Learning from Examples based on Rough Sets), a version for personal computers, which induces a set of rules from a decision table and classifies new examples using the set of rules induced previously by the system. The system may quantize numeric values of attributes and may handle two kinds of uncertainty: missing values of attributes and inconsistent examples. LERS handles inconsistencies using rough set theory.
1.
Introduction This paper presents the system LERS (Learning from Examples based on Rough
Sets) which may induce a set of rules from examples given in the form of a decision table and may classify new examples using the set of rules induced previously by LERS (or another set of rules) [1–8]. The decision table represents input data, gathered from any domain, e.g., medicine, finance, military, etc. In the decision table examples are described by values of attributes (e.g., tests) and characterized by a value of a decision, assigned by an expert. All examples with the same value of the decision belong to the same concept. The decision table is similar—in format—to a data base. The system LERS looks for regularities in the decision table. The output of LERS are rules, a knowledge about original data. These rules are more general than information contained in the original decision table, since—in general—more new examples may be correctly classified by rules than may be matched with examples from the original decision table. The system LERS belongs to the class of machine learning systems from examples. LERS, like other such systems, is finding a minimal description of a concept, described by * Department of Computer Science, University of Kansas,
Lawrence, KS 66049, U. S. A.
2 positive examples, excluding from the description of the concept the remaining, negative examples. Thus rules induced by LERS may be described as a minimal discriminant description of the concept [9]. LERS is able to handle uncertainty in the input decision table. There are two kinds of uncertainty in decision tables: missing values of attributes or inconsistent examples. Missing attribute values are caused by lack of information or don't care values. The latter case happens when we do not care what the attribute value is. Two examples are inconsistent when they are characterized by the values of all attributes, but they belong to two different concepts, i.e., the values assigned by the expert are different. A decision table with at least one pair of inconsistent examples is called inconsistent. LERS handles inconsistencies using rough set theory. Similar systems are: REDUCT [13, 14], RoughDAS and RoughClass [12]. The main advantage of rough set theory, introduced by Z. Pawlak in 1982 [10, 11], is that it does not need any preliminary or additional information about data (like probability in probability theory, grade of membership in fuzzy set theory, etc.). In rough set theory approach inconsistencies are not removed from consideration. Instead, lower and upper approximations of the concept are computed. On the basis of these approximations, LERS computes two corresponding sets of rules: certain and possible.
2. Rough Sets Let U be a nonempty set, called the universe, and let R be an equivalence relation on U, called an indiscernibility relation. An ordered pair A = (U, R) is called an approximation space [10]. For any element x of U, the equivalence class of R containing x will be denoted [x]R. Equivalence classes of R are called elementary sets in A. We assume that the empty set is also elementary. Any finite union of elementary sets in A is called a definable set in A.
3 Let X be a subset of U. We wish to define X in terms of definable sets in A. Thus, we need two more concepts. A lower approximation of X in A, denoted by R _ X, is the set {x ∈ U | [x]R ⊆ X }. _ An upper approximation of X in A, denoted by RX, is the set {x ∈ U | [x]R ∩ X ≠ Ø }. The lower approximation of X in A is the greatest definable set in A, contained in X. The upper approximation of X in A is the least definable set in A containing X. Time complexity of algorithms for computing lower and upper approximations of any set X is O(n2), where n is the cardinality of set U of examples. A rough set in A is the family of all subsets of U having the same lower and the same upper approximations in A. Let x be in U. We say that x is certainly in X if and only if x ∈ R _ X , and that x is _ possibly in X if and only if x ∈ RX. Our terminology originates from the fact that we want to decide if x is in X on the basis of a definable set in A rather than on the basis of X. This _ _ means that we deal with R _ X and RX instead of X. Since R _ X ⊆ X ⊆ RX, if x is in R _ X, it _ is certainly in X. On the other hand, if x is in RX, it is possibly in X.
3.
Decision Tables The input to a LERS program is a decision table. The decision table provides
information about the real world phenomena. Properties of examples (or entities) are perceived through an assignment of values of attributes. However, information about examples, given by that assignment, may not be sufficient to characterize examples without ambiguity. Thus, some examples are characterized by the same attribute values, or they are recognizable up to an indiscernibility relation determined by the set of all attributes. However, examples are independently classified by an expert by values of a decision. The decision table may contain inconsistent examples, i.e. examples, characterized by the same values of attributes yet the corresponding values of a decision are different.
4 For example, the decision table may describe a hospital, the examples are patients, the attributes are tests, and the decisions are diseases. Each patient is characterized by test results and is classified by the physicians (experts) as being on some level of disease severity. If the decision table describes an industrial process, the examples may represent samples of process taken at some specific moments in time, attributes are the parameters of the process, while decisions are actions taken by the operators (experts). Formally, a decision table S is a quadruple (U, Q, V, ρ), where U is a nonempty finite set, and its elements are called examples of S, Q = C ∪ D is a set, C is a nonempty finite set, its elements are called attributes of S, and D is also a nonempty finite set, and its elements are called decisions of S, D ∩ C = Ø, V = ∪ Vq is a nonempty finite set, and its elements are called values q∈Q
of attributes, where Vq is the set of values of attribute q, called the domain of q, and ρ is a function of U × Q onto V, called a description function of S, such that ρ(x, q) ∈Vq for all x ∈U and q ∈ Q [11]. Let P be a nonempty subset of Q, and let x, y be members of U. Examples x and y are P y, if and only if for each q in P, ρ(x, q) = ρ(y, q). is an equivalence relation on U. Thus P defines a partition on U; such a
indiscernible by P in S, denoted by x Obviously,
P partition is a set of all equivalence classes of
P . This partition is called a classification of U
generated by P in S, or briefly a classification generated by P. For a nonempty subset P of Q, an ordered pair (U, P ) is an approximation space A. For the sake of convenience, for any X ⊆ U, the lower approximation of X in A and the upper approximation of X in A will be called P-lower approximation of X in S and P-upper _ approximation of X in S, and will be denoted by P _ X and PX, respectively. A definable set X in A _ will be also called P-definable in S. Thus, X is P-definable in S if and only if P _ X = PX. Example. A decision table is presented in Table 1. Table 1 The classification, generated by the set C of attributes, called Temperature and Headache, is equal to
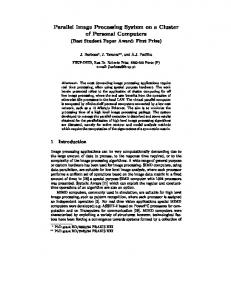
5 {{x 1 }, {x 2 , x3 }, {x 4 }, {x 5 , x6 }, {x 7 }, {x 8 , x9 }}. The set D of decisions consists of one member, called Influenza. As follows from the table, an expert introduced two inconsistencies. First, he assigned different values of attributes to patients x2 and x3, in spite of the fact that both patients, x2 and x3, are characterized by the same values of attributes Temperature and Headache. Another inconsistency is associated with patients x5 and x6. Let us assume that X is equal to the following concept {x | ρ(x, d) = no}, i.e., that X = {x1, x2, x4, x5}. Thus X represents all patients in U, classified by an expert in the same way, as being not sick with influenza. Then C _ X ={x 1} ∪ {x 4} = {x 1, x4}, and _ CX = {x 1 } ∪ {x 2 , x3 } ∪ {x 4 } ∪ {x 5 , x6 } = {x 1 , x2 , x3 , x4 , x5 , x6 }. _ For set X from the example, sets C _ X and CX are illustrated by Figure 1. Figure 1 The set X determines the following rough set {{x 1 , x 2 , x4 , x5 }, {x 1 , x2 , x4 , x6 }, {x 1 , x3 , x4 , x5 }, {x 1 , x3 , x4 , x6 }}.
4. Certain and Possible Rules Let us represent the decision of the expert from the example, corresponding to concept X, by rules. We may represent set X by rules if and only if X is C-definable. If set X is not Cdefinable we can not represent it by a single set of rules. Instead, we may represent sets C _ X and _ CX by the rules. A rule derived from set C _ X of positive examples and set U – C _ X of negative _ _ examples is certain, a rule derived from set CX of positive examples and set U – CX of negative examples is possible. In the example, X is not C-definable in S. The certain rules are (Temperature, normal) ∧ (Headache, no) → (Influenza, no), (Temperature, medium) ∧ (Headache, no) → (Influenza, no),
6 the possible rules are (Temperature, normal) → (Influenza, no), (Temperature, medium) → (Influenza, no). A quality of lower approximation of X by P in S, denoted by γP(X), is equal to |P _ X| , |U| where for a set Z, |Z| denote the cardinality of Z. Thus, the quality of lower approximation of X by P in S is the ratio of the number of all certainly classified examples by attributes from P as being in X to the number of all examples of the system. It is a kind of relative frequency. Note that γP(X) is a belief function according to Dempster-Shafer theory. In our example,
γ P (X) =
|{x 1 , x4 }| 2 = 9 = 0.222222. |U|
_ A quality of upper approximation of X by P in S, denoted by γP(X), is equal to _ |PX| |U| . The quality of upper approximation of X by P in S is the ratio of the number of all possibly classified examples by attributes from P as being in X to the number of all examples of the system. Therefore, it is again a kind of relative frequency. The quality of upper approximation of X by P in S is a plausibility function from the Dempster-Shafer theory viewpoint. In our example, _ |{x 1 , x 2 , x 3 , x 4 , x 5 , x 6 } | 6 γP(X) = = 9 = 0.666667. |U| A rough measure of the rule describing concept X is equal to |X ∩ Y| , |Y| where X is the concept and Y is the set of all examples described by the rule. The rough measure of the rule describing concept X is the ratio of the number of all examples from the concept X correctly described by the rule to the number of all examples described by the rule. Thus, it is a kind of relative frequency, that may be interpreted as a conditional
7 probability P(X| Y). Obviously, the rough measure of a certain rule is equal to 1. The higher rough measure for a possible rule the more reliable rule is. In our example, for the concept X = {x1, x2, x4, x5} and for possible rule (Temperature, normal) → (Influenza, no), set Y = {x1, x2, x3}, and rough measure is equal to |{x 1 , x 2 }| |{x 1 , x 2 , x 4 , x 5 } ∩ {x 1 , x 2 , x 3 } | 2 = = = 0.666667, |{x 1 , x 2 , x 3 } | |{x 1 , x 2 , x 3 } | 3 for possible rule (Temperature, medium) → (Influenza, no), set Y = {x4, x5, x6}, and rough measure is equal to |{x 4 , x 5 }| |{x 1 , x 2 , x 4 , x 5 } ∩ {x 4 , x 5 , x 6 } | 2 = = = 0.666667. |{x 4 , x 5 , x 6 } | |{x 4 , x 5 , x 6 } | 3
5.
Learning algorithms of LERS The system LERS for personal computers, described here, has the following three
options of rule induction. A basic algorithm, invoked by selecting Induce Rules from the menu Induce Rule Set. The algorithm, selected this way, is also called LEM2. The algorithm works on the level of attribute-value pairs, hence it is local. A local covering for each of the concepts is computed, ignoring any priorities. The principle, used in LEM2, is quoted below. Let d denote a decision and let w denote its value. A concept is a set [(d, w)] of all examples that have value w for decision d. In other words, [(d, w)] is a {d}-elementary set of U. Similarly, the block of an attribute-value pair t = (q, v), denoted [t], is the set of all examples that for attribute q have value v. Let B be a nonempty lower or upper approximation of a concept represented by a decision-value pair (d, w). Set B depends on a set T of attribute-value pairs if and only if Ø ≠ [T] = ∩ [t] ⊆ Β. t∈T
8 Set T is a minimal complex of B if and only if B depends on T and no proper subset T' of T exists such that B depends on T'. Let T be a nonempty collection of nonempty sets of attribute-value pairs. Then T is a local covering of B if and only if the following conditions are satisfied: (1) each member T of T is a minimal complex of B, (2)
∪
[T] = B, and
T∈T
(3) T is minimal, i.e., T has the smallest possible number of members. In LEM2 an attribute-value pair is selected first on the basis of its relevance with a goal (goal initially is a concept, later on, it is a concept without examples already described by rules). If a tie occurs, then an attribute-value pair is selected on the basis of the maximum of conditional probability of a block of the attribute-value pair given the goal. The option Induce Rules Using Priorities on Rule Level of the menu Induce Rule Set invokes LEM2 algorithm with an extra feature: the first criterion to select an attributevalue pair becomes the highest attribute priority, then maximum of relevance, and then maximum of conditional probability. The option Induce Rules Using Priorities on Concept Level of the menu Induce Rule Set represents global algorithm (working on entire attributes), called LEM1. First, new partitions on the set U, called substitutional partitions are computed, each with exactly two blocks; the first block is either lower or upper approximation of the concept, the second block is the complement of the first block. On the basis of the substitutional partition, a global covering is computed. Let C denote the set of all attributes and let d denote a lower or upper substitutional decision. Let P be a subset of C. The family of all P-elementary sets will be denoted P*. We say that {d} depends on P if and only if P* ≤ {d}*. A global covering of {d} is a subset P of C such that {d} depends on P and P is minimal in C. Thus, coverings of {d} are computed by comparing partitions P* with {d}*. Then linear dropping conditions, based on a single scanning all conditions of a rule is applied. The set of rules computed this way is—in general—of lower quality than the set
9 of rules computed by LEM2, however, the user has more control over what attributes will be used in rules. Quantize all numeric attributes The method of quantization used here attempts to divide original interval of a numeric attribute into subintervals with equal number of values in each subinterval. In quantizing all attributes, the required level of consistency is provided by the consecutive search for attributes to be additionally divided using an entropy criterion.
6.
System Description This system consists of two major subsystems: a learning subsystem that will
produce a set of rules from a decision table, and a processing subsystem that will take the resulting set of rules (or any set of rules) and use them to classify new examples. The system is menu based and a mouse can be used for most operations, making the package very user friendly. This section highlights some of the general features of the system, and then provides a detailed tour of the entire system. Menu Operation This system is entirely menu driven, and a mouse can be used to select any item from a menu. At any time in the menu structure, pressing the Esc key will cause the system to return to the previous menu. An Exit option is also provided for each menu, and this option is equivalent to pressing Esc. Repeatedly pressing Esc will take the user from anywhere in the menu structure back to the main system menu. A second useful feature is the presence of hot-keys. In each menu item, one letter will be highlighted. Pressing this letter on the keyboard will cause that menu option to be selected immediately, allowing fast and easy menu operation.
10 On-line Help To get on-line help from anywhere in the system, press the F1 key and a help screen will appear to explain what part of the system the user is in and what options are currently available. To remove the help screen press the Esc key. Descriptive messages are also displayed at the bottom of the screen for each menu item, giving a more detailed explanation of what each option does.
6.1
System Operation The system can be entered by typing LERS from the DOS prompt, or it can be
initiated from within a Windows environment. The system assumes a color monitor by default. To specify a monochrome monitor, use the command line option -m (LERS -m). Upon entering the system, the following menu will be displayed, see Figure 2. Figure 2 About This option displays a short summary of system information, such as version number and last release date.
6.2 Learn New Rule Set This option is the learning part of the system. Selecting this option from the main menu will place the user into the learning subsystem, and the following menu will appear on the screen, see Figure 3. Figure 3. Read Decision Table The first step in producing rules is to load a decision table into the system. This is done by selecting the first option from the main learn menu. A box will appear on the screen containing a list of all files in the current directory with the extension TAB. A file may be selected using the mouse or arrow keys, and the user can move around in the directory structure if the desired file is in another directory. Once a file has been selected,
11 the system will attempt to load the file from the disk. If the file is not in the proper format, an error message will be displayed, and after pressing the Esc key the user will be placed back at the main learn menu. Until a decision file has been loaded into the system, the only other option that can be selected from this menu is Exit. Decision Table Format Decision tables must be in the proper format in order for the LERS system to process them correctly. An example decision table is shown below along with a description of each of the important sections, see Table 2. Table 2 The first section begins with the special character ''. NOTE : This section does not necessarily have to take only one line. The special characters '' denote the begin and end of the section. Also note that there MUST be a space separating the ''. The second section gives a listing of the attribute and decision names to be used. As with the first section special characters denote the beginning and ending of this section. In this case the special characters are '[' and ']', and a blank space must appear immediately after the '[' and immediately before the ']'. No blanks are allowed in attribute or decision names. The third section of the table is the actual data. Although in the table shown above each example takes up one line, this does not have to be the case. Attribute and decision values are separated by one or more spaces and again must not contain spaces. Note that
12 the first two lines of this table are conflicting. They each have the same values for the four attributes, but each has a different decision. Also note the question mark that appears in the fifth line of this section. This symbol indicates that the value for this attribute is unknown. NOTES : 1. Comments - Comments may be included in the decision table. Any line which begins with the character ! will be treated as a comment and not processed by LERS. In the example table above the first three lines are comments. 2. Ignoring Attributes - To ignore an attribute (or decision) during processing of a table, place an X in the appropriate column in the symbolic representation of the table (the first section of the table). For example if the first section of a table was < A1 A3 X A2 D >, then the third column in each example would be ignored in the rule inducing process.
6.3
Edit Decision Table Choosing this option from the Learn New Rule Set menu will take the user to the
Edit Decision Table menu shown below, see Figure 4. Figure 4. Make Table Consistent This option can only be selected when the current table is inconsistent. When selected, the system will gather together all groups of examples with conflicting decisions. For each such group, the user can select from a menu to keep any one of the examples, or to keep none of them. After this operation has been completed, the table will be consistent and this option cannot be selected again until a new inconsistent table has been loaded into the system. Replace Examples Containing Unknown Values
13 This option attempts to solve the problem of unknown values in the decision table. For example, consider one example containing a value of unknown for one of its attributes. This method would replace that single example with a set of new examples each containing a new value for that attribute. As many new examples are created as there are possible values for the missing attribute in the decision table. The following example illustrates this process. The sample decision table listed above contains an example with an unknown value for the fourth attribute: yellow
11
soft
?
positive
Since the possible values for the fourth attribute in the example table are plastic, wood, and metal, this example will be replaced by the three examples listed below. yellow yellow yellow
11 11 11
soft soft soft
plastic wood metal
positive positive positive
The default unknown values for the LERS system are '?', '*', and '-'. However, the user can tell the system to recognize any symbol as an unknown. The following query is the first action taken when this option is selected. > Unknown values are: '?', '*', '-' > Enter additional unknown value (RETURN for none) : > > > > > > > >
******************************************* Unknown values found in attribute # of examples with unknown values: 1 # of possible values: 3 Current # of examples: 6 Replacing unknown values will add 2 more examples Replace unknown values in attribute ? (y or n) y Total # of examples: 8
The new decision table is presented in Table 3.
14 Table 3 Note that the last three examples were produced from the one example in the original table with the unknown value for the attribute size. Caution is suggested when attempting to use this method for large data sets with many unknown values present, as the size of the table may increase exponentially. This method works best with a fairly small number of unknowns present in a table. Remove Unknown Examples The system contains a second option for dealing with unknown values. This method simply removes all examples that contain any unknown values from the table. After selecting this option, the system will ask if any other symbols should be treated as unknowns other than the default values ('?', '*','-'). This is done in the same manner as with the previous option. Starting from the same initial table as in the previous example, this option would result in the following: > 1 example(s) with unknown values were removed from the table. > Total # of examples: 5
The user would then be back at the Edit Decision Table menu. Notice that this option decreases the size of the original table if unknown values are present, while replacing unknowns increases the size.
15 Quantize Attribute Values Quantization is the process of placing numerical values into groups or clusters, members or which will all have the same value in the quantized decision table. Quantization reduces the number of distinct values for any particular attribute and is often essential in order to produce viable rules. For example, if a decision table has an attribute called employees and each of the 100 examples has a different value for this attribute, it would make sense to quantize this attribute into perhaps three classes: small, medium, and large. If quantization was not done in this case, the resulting rules would most likely be far too specific to be of much value. The following menu appears upon entering the quantization sub-system, see Figure 5. Figure 5. Show ALL Attribute Information This option gives a detailed description of each attribute. A sample for a single attribute is shown below. > > > > >
Attribute name: INTEGER values # of total values: # of distinct values: # of examples in table:
Size 8 5 8
The second line of this display describes the type of the attribute. The system will only quantize attributes of type CONTINUOUS or INTEGER. Quantize ALL Numeric Attributes This option will result in the quantization of every numeric attribute present in the table. The user is first prompted for a desired level of consistency to maintain. This level must be less than or equal to the level of consistency in the original table. When completed, the system will display the quantization scheme produced for each attribute in the following format. In the example table, quantization will result in the following:
16
> Quantization Scheme For: > > 2 new values > Discrete Value Name > (Based on Interval) 3..8.5 8.5..14
# of Examples in Intervals (Frequency) 3 5
In this example, the attribute (which originally had integer values) now has one of two discrete values. The symbols used in the new table to denote these discrete values will be the actual symbols that appear above (3..8.5 and 8.5..14). If a value in the original table falls exactly on a breakpoint, then it will be placed in the latter interval. For example, if the value 8.5 appeared in the original table, it would be placed into the interval 8.5..14 in the new table, not in the first interval. Also note that if a value falls on the upper bound of the last interval, it will be placed into this last interval. The second column denotes the number of examples in the original table that fall into each new category. Select SOME Numeric Attributes and Quantify Them It may be the case that a user does not wish to quantify every numeric attribute in a particular table. This option presents a list of attributes to the user, and the user can pick from this list the attributes that are to be quantified. The system will then perform quantification on only the selected attributes, giving a quantification scheme for each affected attribute in the same format as in the previous option. Check Table For Consistency This option is included here because the process of quantification can affect the consistency of a decision table. This option will either display a message that the table is consistent, or it will display the number of conflicting examples in the current table along with the percentage of the table that is consistent.
17 Save Table to a File This option allows the user to save the edited decision table to a file. The system recognizes files with a TAB extension as decision table files, so decision table files should be named accordingly when this option is selected.
6.4 Induce Rule Set This option is used to produce a set of rules from the current decision table. When it is selected, the following menu will appear: Induce Rules This option will produce a set of rules using the LEM2 Single Covering Local method. All attributes are considered equally. When this option is selected, a display similar to the following will appear, see Figure 6. Figure 6 > > > > > > > > > > > > > > > > > > >
Inducing rules using LEM2SCL ignoring attribute priorities Learning Concept: (Attitude,positive) Belief: 0.3750 [ 2, 0] 2 rules learned Minimizing complex list { 2, 0} 2 rules learned Plausibility: 0.7500 [ 1, 0] 1 rules learned Minimizing complex list { 1, 0} 1 rules learned Learning Concept: (Attitude,negative) Belief: 0.2500 [ 1, 0] 1 rules learned Minimizing complex list { 1, 0} 1 rules learned Plausibility: 0.6250 [ 2, 0] 2 rules learned Minimizing complex list { 2, 0} 2 rules learned
>
Elapsed Time: 00:00:00.03
18 You will notice that the numbers in the brackets will change as rules are produced. The number on the left is the number of rules produced, the number on the right is the number of examples yet to be covered. So when the algorithm is finished the number on the left will be the total number of rules, and the number on the right should be 0. Induce Rules Using Priorities on Rule Level This method also computes a set of rules using the LEM2 Single Covering Local method, but attribute priorities are considered. The format of output to the screen is exactly the same as in the previous option. The sample data below was produced from the same decision table as was used in the previous method. > > > > > > > > > > > > > > > > > > >
Inducing rules using LEM2SCL using attribute priorities Learning Concept: (Attitude,positive) Belief: 0.3750 [ 2, 0] 2 rules learned Minimizing complex list { 2, 0} 2 rules learned Plausibility: 0.7500 [ 2, 0] 2 rules learned Minimizing complex list { 1, 0} 1 rules learned Learning Concept: (Attitude,negative) Belief: 0.2500 [ 1, 0] 1 rules learned Minimizing complex list { 1, 0} 1 rules learned Plausibility: 0.6250 [ 2, 0] 2 rules learned Minimizing complex list { 2, 0} 2 rules learned
>
Elapsed Time: 00:00:00.02
Changing the priorities may or may not result in a different set of rules. It may be the case that the system finds a particular attribute to be useless in computing rules, regardless of the priority it is given.
19 Induce Rules Using Priorities on Concept Level This option generates a set of rules using the LEM1 Single Covering Global method. The screen display for this method is different from the previous two methods. An example is shown below. > > > > > > > > > > > > > > >
Inducing rules using LEM1SCG using attribute priorities Learning Concept: (Attitude,positive) Belief: 0.3750 Computing a covering 2 OK Inducing CERTAIN rules 2 rules learned Plausibility: 0.7500 Computing a covering 1 OK Inducing POSSIBLE rules 1 rules learned Learning Concept: (Attitude,negative) Belief: 0.2500 Computing a covering 1 OK Inducing CERTAIN rules 1 rules learned Plausibility: 0.6250 Computing a covering 2 OK Inducing POSSIBLE rules 2 rules learned
>
Elapsed Time: 00:00:00.02
The method computes a single covering for each concept, and the size of the covering is displayed after the message 'Computing a covering' and before 'OK'. Attribute priorities are considered in the process of computing coverings. The system will try to use attributes with higher priorities first when computing coverings, but as in the previous method, the system may determine an attribute to be useless regardless of its priority. Priorities influence a decision only when two attributes are 'tied', i.e. when either of two different attributes would work equally well in a covering, but only one is necessary. In this case, the system will pick the one with the highest priority. View Attribute Priorities This option allows the user to view the priority of each attribute in the current decision table. When selected, a display similar to the following will appear.
20 > Attribute Name
Priority
Size Color Feel Material
3 1 1 1
Change Attribute Priorities This option allows the user to change priorities of individual attributes. When selected, the system will display each attribute and its current priority. The user then has the choice of changing the priority by entering a new number, or by simply pressing the Enter key the user can go on to the next attribute without recording a change. View Rules After a set of rules has been generated this option can be selected. The user will be prompted for the number of rules to be displayed per screen, and the rules will be displayed. The output will be in the following format: > Certain rules - 3 total > > >
(Material,wood) -> (Attitude,positive) (Material,metal) & (Size,8.5..14) -> (Attitude,positive) (Color,red) -> (Attitude,negative)
> Possible rules - 3 total > > >
(Color,yellow) -> (Attitude,positive) (Material,plastic) -> (Attitude,negative) (Material,metal) & (Size,3..8.5) -> (Attitude,negative)
These rules were produced from an inconsistent table, so a set of certain rules and a set of possible rules was produced. From a consistent table, only certain rules will be produced.
21 Save Rules Once a set of satisfactory rules has been produced, this option allows the user to save them to a file. The system recognizes files with an RUL extension as rule files, so it is advisable to adhere to this convention when selecting a file name. Show System Information This option gives detailed information about the current state of the system. An example is shown below. > > > > > > > > > > > > > > > > > > > >
Number of examples: 8 Unique examples : 7 Ratio /: 0.8750 Number of attributes: 4 Source file: EX.TAB Level of consistency: 62.50% Author of rules: LEM2 C Version (Single Cover Local) # of CERTAIN rules: 3 # of POSSIBLE rules: 3 Elapsed Time: 00:00:00.02 Total Rules : 3 Total Conditions : 4 Conditions/Rule : 1.3333 Shortest Rule : 1 Longest Rule : 2 Total Rules
: 3 Total Conditions
: 4 Conditions/Rule
: 1.3333 Shortest Rule
: 1 Longest Rules
: 2
Exiting the Learning Sub-system The user can return to the main system menu either by repeatedly pressing the Esc key, or by selecting the Exit option on each sub-menu. NOTE: Upon leaving the learning sub-system, the current decision table and rule set will be lost. Any information that is to be retained must be saved to a file before exiting the learning sub-system.
22
6.5 Process New Data This is the part of the system that attempts to classify new examples using a set of rules produced by the learning subsystem (or any set of rules). Selecting this option results in the following menu appearing on the screen, see Figure 7. Figure 7. System Status Box The status box gives you information about the current system, and the rule base being used to make decisions. When the program is initially loaded, there will be no Knowledge Base in the system. Loading a Knowledge Base The first step in using this sub-system is to load in a knowledge base of rules. Until this is done, no other menu options will be available except for the option to Exit back to the main menu. Selecting this option causes a selection box to appear on the screen, filled with a listing of eligible rule files (RUL extensions). A file can be selected by using the arrow keys or mouse. Rule File Format The rules produced by the learning sub-system are saved in an ASCII file. A set of rules produced from the example table is shown below.
23
[RuleAuthor] LEM1 C Version (Single Cover Global & LERS) [CertainRuleStatistics] Total-Rules Total-Conditions Conditions-per-Rule-(Average) Shortest-Rule Longest-Rule
3 4 1.3333 1 2
[PossibleRuleStatistics] Total-Rules Total-Conditions Conditions-per-Rule-(Average) Shortest-Rule Longest-Rule
3 4 1.3333 1 2
[CertainRuleSet] 2 0.375000 0.375000 1.000000 (Material,wood) -> (Attitude,positive) 3 0.375000 0.375000 1.000000 (Material,metal) & (Size,8.5..14) -> (Attitude,positive) 2 0.250000 0.250000 1.000000 (Color,red) -> (Attitude,negative) [PossibleRuleSet] 2 0.375000 0.750000 0.833333 (Color,yellow) -> (Attitude,positive) 2 0.250000 0.625000 0.500000 (Material,plastic) -> (Attitude,negative) 3 0.250000 0.625000 1.000000 (Material,metal) & (Size,3..8.5) -> (Attitude,negative)
The first part of the rule file contains some statistics about the rules. These statistics are followed by the set of certain rules headed by the token [CertainRuleSet], and the set of possible rules headed by the token [PossibleRuleSet]. Each rule is preceded by a line containing 4 values. In order, these values represent the following:
24 • Number of variable-value pairs in the rule: describes how many attribute-value pairs and a decision-value pair make up the rule that will follow. It is an integer value. • Belief of the concept: describes the belief of the concept as deduced from the decision table. It is a real number (decimal fraction) in the range 0.0 to 1.0. • Plausibility of the concept: describes the plausibility of the concept as deduced from the decision table. It is a real number (decimal fraction) in the range 0.0 to 1.0. • Rough measure of the rule: describes the rough measure of the rule as derived from the decision table. It is also a real number (decimal fraction) in the range 0.0 to 1.0.
NOTE: These four values are optional. They are produced by the learning subsystem, but the processing sub-system will accept rules in a bare format without these values.
Within a set of the rules, these symbols are used: '(' and ')':
Parenthesis are used to denote an attribute-value pair, and the context of such a pair determines whether it is a condition or a decision. A comma is used to separate the value from the attribute name inside the parenthesis.
'-->':
This symbol separates the conditions of the rule from the decision, which always stands alone to the right of this symbol.
'&':
This symbol is used to separate the conditions of a rule.
In general then, a rule consists of one or more conditions (attribute-value pairs) each separated by the symbol '&', followed by the symbol '-->', and then the decision which is also in the form of an attribute-value pair. The system is somewhat flexible in accepting rules in a slightly different format, but generally it is a good idea to adhere as closely to this format as possible.
25 Information pertaining to the format of rules has been included here because it is possible and often desirable for a user to add to the set of rules produced by the learning system. Rules may be simply added by hand in a bare format (no values for conditions in the rule, belief, etc.) or they may be obtained from some other source. This system can work with any set of rules in the above format, even if none of the rules were produced by the learning system. This adds a great deal of flexibility to the system, as sets of rules from different sources may be easily merged together. As the file is read... While a rule file is being read, a status message will appear at the bottom of the screen. Changes will also appear in the Status Box as the certain and possible rules are read into the system. The name of the file being loaded as the Knowledge Base will appear, along with the number of rules read and the amount of free memory. Along with the each rule file that is read, an accompanying explanation file is loaded if it exists. An explanation file will have the same name as a rule file with an EXP extension. These explanations are used in the system to provide more detailed information about decisions that are made. The absence of an explanation file will not affect the actual decision making process in any way, and for that reason such a file is optional. Closing a Knowledge Base To close a Knowledge Base choose the Close option. You will be asked confirm your choice and then the Knowledge Base will be removed, enabling you to load a new Knowledge Base or exit back to the main system menu. Specifying Facts Once a Knowledge Base is loaded, the user may enter facts about an example for which a decision is desired. To do this, choose the Specify Facts option from the main menu. A Facts Screen listing the attributes which are present in the Knowledge Base will appear, along with spaces that will hold a value for each attribute. To select a value for a
26 particular attribute, move the selection bar to that attribute using either the left mouse button or the arrow keys. Pressing F2 or the right mouse button at this point will cause a list of all possible values for this attribute to appear, from which the user can select the desired value by pointing the mouse and pressing the left button, or by moving to that value with the arrow keys and pressing the return key. Note that there may be more attributes than can fit on one screen. To move between screens of attributes, simply press the PgDn and PgUp keys. When the values for all desired facts have been specified (all attributes that are not adjusted will be given a value of Don't-Know by default), the Ctrl key and the Enter key should be pressed at the same time to confirm the data return to the processing menu. NOTE : Pressing the Esc key while specifying facts will also return the system to the processing menu but will NOT save any of the facts that might have been specified. Instead it will return the values of all attributes to Don't-Know. Begin Reasoning Once the values for all possible facts have been specified, the system can attempt to deduce a decision. After selecting this option, a status bar will appear on the screen. This bar will show the progress of the system as it tries to match the facts that were entered with the rules in the knowledge base. The number of matches found will be tallied as the search progresses, and this total will be displayed at the bottom of the screen beneath the status bar. Once the matching process has been completed, the system will display one of three things: (1) A window containing a listing of the rules that were matched, and the decision part of each rule. This will appear when enough information is present for the system to reach a conclusion, and when all rules that were matched contained the same conclusion. For each match, the decision reached will be shown, along with whether that match was full or partial. (More information on partial matches is included below under the Reasoning Options section). To view more information about a match, highlight it with the arrow
27 keys and press the Return key. A description screen will appear containing the decision reached, the belief, plausibility and rough measure of the decision, and the attribute-values which led to the decision. To return to the list of matches press any key. To return to the main menu from the match list press the Esc key. (2) A message explaining that possible conflicting decisions were reached. This occurs when the conclusions from two or more rules that were matched contained conflicting decisions. In this case the system will display a warning along with the decision it considers to be the most believable. Pressing the Esc key at this point will send the user to a screen containing a list of all matches and decisions. From this point, the system can be used in exactly the same manner as described in (1). (3) A message explaining that no reasoning was possible with the given facts and the current knowledge base. Process Facts File This option allow the user to perform reasoning on a file containing examples, rather than simply processing one example which must be entered by hand. After selecting this option from the main menu, a list of facts files found on the current drive will be displayed. The system looks only for files with an FF (facts file) extension, and these files must be in a specific format in order to be processed by the system. Use the arrow keys or the mouse to select the facts file. At this point, there will be a short pause while the system performs some initialization. Then processing will begin. The bottom half of the screen contains a box with a status bar showing the progress of the reasoning process for the current example. This box is essentially the same as the box that appears when Begin Reasoning is chosen, with a few differences. In a facts file, up to 4 lines of text description can be included for each example for the purpose of describing or identifying that example. These lines are optional in the file, but if they are present the system will display the first 2 of them to the screen for each individual example. Some additional pieces of information are given for
28 each example as it is being processed: Total Facts, Facts Recognized, and Facts Not Recognized. Total facts represents the total number of facts found in the facts file for a particular example. Facts recognized is the number of facts that are recognized by the current knowledge base, i.e. this is the number of facts that match some single condition in some rule contained in the knowledge base. A large number of facts recognized does not guarantee that a match will be found, since a rule may have multiple conditions and a recognized fact is guaranteed to match only one condition in some rule. However, if facts recognized is 0 for a particular example, then it will be impossible for the system to reach a conclusion for that example. In the top half of the screen is a box containing a second status bar. This status bar shows the progression through the entire facts file. Listed are the total number of examples in the file, the example that is currently being processed, and the number remaining. The decisions made by processing a facts file will be sent to a file by the same name as the facts file but with the extension RES (results). This file name is displayed in the upper box. Processing a facts file can require a substantial amount of time, depending on the size of the knowledge base and number of examples in the facts file. Thus, the user can interrupt the process at any time by simply pressing and holding the Control key, and then pressing Q. This results in a small menu appearing in the middle of the screen with 3 choices. "Oops, never mind" will simply tell the system to continue processing the file. "Skip this example" will terminate reasoning for the current example, and reasoning will begin again for the following example. "Abort Processing" will cause the facts file processing to terminate. The results of the processing up to the termination point can be found in the same output file that is created by normal processing.
29 Reasoning Options Using Reasoning Options allows the user to adjust some ways in which the reasoning process is executed. When this option is selected a menu containing four entries will appear. The Stop Match Limit option puts a limit on the number of rules that can be matched for a particular example. The system will stop searching for new matches when this limit is reached. The Partial Match Factor allows the system to find rules in the Knowledge Base which do not fully match the information that has been entered, but which are close. By pressing the F2 key when Partial Match Factor is highlighted the user can tell the system to search for rules that match all information Less 1, 2, or 3 attribute-value pairs. For example, if "Less One Pair" is selected, the system will be able to match a rule with four conditions, even if only three of those conditions are satisfied from the facts that were entered, and so on. This can dramatically increase the number of matches found, although it should be remembered that these matches are not complete. The Concept Search option allows the system to search for all concepts or just for a particular concept. Pressing the F2 key when Concept Search is highlighted will open a menu box listing the value "All Concepts", followed by a list of all concepts currently found in the knowledge base. Selecting All Concepts at this point and pressing the Enter key tells the system to match every possible rule in the search process. Selecting one of the specific concepts listed will tell the system to match only rules that support that concept. This gives the user a means to narrow the search field. The Rough Measure Limits option gives the user a second way to narrow the search field. Rough measure ranges from 0.0 to 1.0 for all rules, and these are the default settings for the minimum and maximum values. To change these values, move to the desired field and enter a decimal number between 0.0 and 1.0. A decimal point must be typed in the second place from the left in each field. Adjusting these values allows the user to specify a
30 rough measure range that all rules must satisfy before they can be matched. For example, if rough measure is set to 0.5000 to 1.0000, then only rules that have a rough measure value within this range will be matched. To confirm any changes made under Reasoning Options and return to the processing menu, press the Ctrl and Enter keys at the same time. Pressing the Esc key at any time will return the user to the processing menu without saving any changes that were made. Exiting the Processing Sub-system This sub-system can also be exited either by pressing the Esc key or choosing Exit from the main processing menu. NOTE: Upon leaving this sub-system, the current rule file will be removed from the system and thus will have to be reloaded if the user enters the processing sub-system again. All reasoning options will also be reset. Exiting the Main System To exit the main system, the Exit System option should be chosen from the main system menu. The Esc key will not work in this case, and confirmation is required by the system.
References [1]
A. Budihardjo, J. W. Grzymala-Busse, and L. Woolery: Program LERS_LB 2.5 as a tool for knowledge acquisition in nursing. Proc. of the 4th Int. Conf. on Industrial & Engineering Applications of Artificial Intelligence & Expert Systems, 1991, 735–740.
[2]
J. S. Dean and J. W. Grzymala-Busse: An overview of the learning from examples module LEM1. Report TR-88-2, Department of Computer Science, University of Kansas, 1988.
[3]
J. W. Grzymala-Busse: Knowledge acquisition under uncertainty—A rough set approach. J. Intelligent & Robotic Systems 1, 1988, 3–16.
[4]
J. W. Grzymala-Busse: An overview of the LERS1 learning system. Proc. of the 2nd Int. Conf. on Industrial and Engineering Applications of Artificial Intelligence and Expert Systems, 1989, 838–844.
31 [5]
J. W. Grzymala-Busse: On the unknown attribute values in learning from examples. Proc. of the ISMIS'91, 6th Int. Symp. on Methodologies for Intelligent Systems, 368–377.
[6]
J. W. Grzymala-Busse: Managing Uncertainty in Expert Systems. Kluwer Academic Publishers, 1991.
[7]
J. W. Grzymala-Busse: LERS—A system for learning from examples based on rough sets. In R. Slowinski, ed. Intelligent Decision Support. Handbook of Appications and Advances of the Rough Sets Theory, Kluwer Academic Publishers, 1992, 3–18.
[8]
J. W. Grzymala-Busse and D. J. Sikora: LERS1—A system for learning from examples based on rough sets. Report TR-88-5, Department of Computer Science, University of Kansas, 1988.
[9]
R. S. Michalski: A theory and methodology of inductive learning. In R. S. Michalski, J. G. Carbonell, T. M. Mitchell, eds. Machine Learning, Morgan Kaufmann 1983, 83–134.
[10]
Z. Pawlak: Rough sets. Int. J. Computer and Information Sci., 11, 1982, 341– 356.
[11]
Z. Pawlak: Rough Classification. Int. J. Man-Machine Studies 20, 1984, 469– 483.
[12]
R. Slowinski and J. Stefanowski: 'RoughDAS' and 'RoughClass' software implementations of the rough sets approach. In R. Slowinski, ed. Intelligent Decision Support. Handbook of Appications and Advances of the Rough Sets Theory, Kluwer Academic Publishers, 1992, 445–456.
[13]
W. Ziarko: Acquisition of control algorithms from operation data. In R. Slowinski, ed. Intelligent Decision Support. Handbook of Appications and Advances of the Rough Sets Theory, Kluwer Academic Publishers, 1992, 61–75.
[14]
W. Ziarko and J. D. Katzberg: Control algorithm acquisition, analysis, and reduction. In S. T. Tzafestas, ed. Knowledge-Based System Diagnosis, Supervision and Control, Plenum Press, 1989, 167–178.