The Self-Protection Problem in Wireless Sensor Networks DAN WANG Simon Fraser University QIAN ZHANG Hong Kong University of Science and Technology and JIANGCHUAN LIU Simon Fraser University
Wireless sensor networks have recently been suggested for many surveillance applications such as object monitoring, path protection, or area coverage. Since the sensors themselves are important and critical objects in the network, a natural question is whether they need certain level of protection, so as to resist the attacks targeting on them directly. If this is necessary, then who should provide this protection, and how it can be done? We refer to the above problem as self-protection, as we believe the sensors themselves are the best (and often the only) candidates to provide such protection. In this paper, we for the first time present a formal study on the self-protection problems in wireless sensor networks. We show that, if we simply focus on enhancing the quality of field or object covering, the sensors might not necessarily be self-protected, which in turn makes the system extremely vulnerable. We then investigate different forms of self-protections, and show that the problems are generally NP-complete. We develop efficient approximation algorithms for centrally-controlled sensors. We further extend the algorithms to fully distributed implementation, and introduce a smart sleepscheduling algorithm that minimizes the energy consumption. Categories and Subject Descriptors: C.2.2 [Computer-Communication Networks]: Network Protocols—Applications; F.2.2 [Analysis of Algorithms and Problem Complexity ]: General General Terms: Algorithms, Design, Experimentation Additional Key Words and Phrases: Sensor networks, coverage, protection
Author’s address: D. Wang and J. Liu, School of Computing Science, Simon Fraser University, Burnaby, BC, Canada, V5A 1S6; email: {danw, jcliu}@cs.sfu.ca. Q. Zhang, Department of Computer Science, Hong Kong University of Science and Technology, Clear Water Bay, Kowloon, Hong Kong; email:
[email protected]. A preliminary version of this paper is to appear in the 26th International Conference on Distributed Computing Systems (ICDCS’06), Lisbon, Portugal, July, 2006. Permission to make digital/hard copy of all or part of this material without fee for personal or classroom use provided that the copies are not made or distributed for profit or commercial advantage, the ACM copyright/server notice, the title of the publication, and its date appear, and notice is given that copying is by permission of the ACM, Inc. To copy otherwise, to republish, to post on servers, or to redistribute to lists requires prior specific permission and/or a fee. c 2001 ACM 0000-0000/2001/0000-0111 $5.00 ° ACM Transactions on Sensor Networks, Vol. 2, No. 3, 09 2001, Pages 111–0??.
112
·
Dan Wang et al.
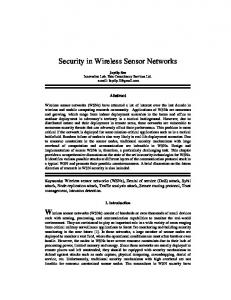
1. INTRODUCTION A wireless sensor network consists of a large number of sensor nodes that perform sensing, computation, and communication. It has become an attractive modern tool for surveillance and protection applications, such as museum monitoring, military surveillance, object tracking, and intrusion detection. A key objective here is to provide enough coverage for the monitored entities; which range from individual objects to an entire area. Obviously, the denser and more active the sensors are, the better the coverage quality we can expect, and hence, the better protection for the objects. Sensors, however, are small and uni-functional devices which are tightly constrained by nonrechargeable batteries. Sensors will die after the depletion of their energy resource and the quality of protection will thus be damaged. Many research activities on sensor networks are focusing on how to balance the quality of protection and energy consumption of the sensors. Sensors may also die due to attacks. By sneakily dismantle a few sensors, the quality of coverage/protection can also be significantly affected. We study an example in Fig. 1 of a maximal breach path in a sensor network [Meguerdichian et al. 2001]. Intuitively, the maximal breach path is a path traveling through the sensor network that has the least probability of being detected. More formally, define the weight of a path as the minimum distance from this path to any sensor in the network; a maximal breach path is the maximum weight path from the source to the destination, as illustrated in Fig. 1 (b). Intuitively, when deploying the sensors, we should minimize the weight of the maximal breach path. While elegant solutions have been devised in this context to provide quality coverage for the area, they generally assume that the sensors are not the target of attacks. This, however, creates a severe backdoor that can be explored by intruders. As shown in Fig 1 (c), if removing two sensors A, B in Fig 1 (b), the weight of the maximal breach path can be substantially increased. Our simulations verifies that, by removing approximately 1% of the carefully chosen sensors the weight of the maximal breach path will increase over 40%. Note that, in the attack, it is not necessary to physically remove a sensor, a simple interference would work, and a smart intruder may strategically select weak sensors to amplify the effect. Given the sensors themselves are important and critical objects in the network, we argue that they also need certain level of coverage and hence protection. We refer to the above problem as self-protection, as we believe the sensors themselves are the best (and often the only) candidate to provide protection. In simple form, a sensor network is self-protected if all sensors are monitored/covered by at least one other active sensor. The challenges remain in three aspects: 1) We need to identify the requirements and constraints for self-protections; 2) We need efficient and preferably distributed algorithms to accommodate the self-protection demands; and 3) Selfprotection itself is never the ultimate objective in system design – sensor network serves field/object protection applications, e.g., monitoring international borders or protecting valuable art collections, to which we refer as the main objective(s) of the system. An effective integration of self-protection with the protection of main objectives is necessary. In this paper, we for the first time present a formal study on the self-protection ACM Transactions on Sensor Networks, Vol. 2, No. 3, 09 2001.
Preparing Articles for the ACM Transactions on Sensor Networks
·
113
C
B E F G A
D
(a)
(b)
C
E F G
D
(c)
Fig. 1. (a) A sensor network. (b) The maximal breach path in the network. The minimum weights are at (B, C) and (A, D). (c) By removing A and B, the weight of the maximal breach path is significantly increased. The weight of the maximal break path is remarked between lines of E, G and F, G.
problem in wireless sensor networks. We show that, if we simply focus on enhancing the quality of field or object covering, the sensors might not necessarily be selfprotected, which in turn makes the system vulnerable. We then investigate different levels of self-protections, and show that the problems are generally NP-complete. We develop efficient approximation algorithms for centrally-controlled sensors. For large sensor networks deployed in open areas, we present fully randomized and distributed implementations. Finally, we developed a two-tier architecture, which seamlessly integrates self-protection with the main objectives of the sensor network. Extensive simulations are conducted to illustrate the necessity of self-protection and the performance of our algorithms. The reminder of this paper is organized as follows: We discuss related work in Section 2. The self-protection problem is formally presented in Section 3. In Section 4, we consider a centralized scenario and discuss its complexity; we also show effective approximate solutions in this scenario. Section 5 extends the solutions to an distributed environment. In Section 6, we describe a two-tier architecture to ACM Transactions on Sensor Networks, Vol. 2, No. 3, 09 2001.
114
·
Dan Wang et al.
integrate the self-protection and the main protection objectives. Section 7 offers simulation results that verify the effectiveness and efficiency of our algorithms. Finally, we conclude our paper in Section 8. 2. RELATED WORK Wireless sensor networks have received a lot of attention recently due to its unique capabilities and the associated wide spectrum of applications. A pioneer work discussing the challenges of sensor networks can be found in [Estrin et al. 1999]. A general overview and a survey focusing on the routing protocols can be found in [Akyildiz et al. 2002] and [Al-Karaki and Kamal 2004], respectively. In many sensor network applications, providing desired field coverage or object protection is a key design objective. A typical coverage criterion is that every point of the field should be k-covered, which is studied in [Slijepcevic and Potkonjak 2001]. The k-coverage problem is further examined in [Kumar et al. 2004], which proposes a sleeping/active schedule to minimize energy consumption. In [Kumar et al. 2005], barrier coverage is considered, where the sensors can be used as barriers of, say, international borders. The problem is formulated as a k-multi-path problem and solved optimally if the sensors are centrally controlled. Distributed algorithms is also discussed in their work. Coverage of individual objects is studied in [Cardei et al. 2005], which shows that the problem is NP-complete and heuristics are then developed. Other related works include target tracing for mobile objects [Zhang and Cao 2004] and variable-quality of coverage [Gui and Mohapatra 2004]. Besides these theoretical studies, practical surveillance systems are also under active development; see for examples [He et al. 2004][Yan et al. 2003]. A closely related and yet opposite research direction is to find breach paths in the sensor protected area. A representative example is the maximal breach path [Meguerdichian et al. 2001], as described in the introduction. The maximal breach path shows the protection quality of the sensor area. The smaller the weight of the maximal breach path is, the better the area is protected. It is followed by minimal and maximal exposure paths [Meguerdichian et al. 2001][Veltri et al. 2003] that focus on the paths with the least and most expected coverage. Our work is motivated by these studies on quality coverage of the sensor field or protection of valuable objects. However, to the best of our knowledge, the above studies do not address the possible weakness of the sensors themselves. Our selfprotection does not conflict with these protection objectives; it can be viewed as a complementary new metric for the quality of coverage/protection. This metric is important because without protected sensors, quality coverage/protection for others can hardly be achieved. In addition to coverage quality, network connectivity is also an important factor successful operation of a multi-hop sensor network. The relation between coverage and connectivity is studied in [Wang et al. 2003], which suggests that if the communication range of a sensor is twice of the sensing range, then the sensor network is connected if the area is covered in a convex region. Additional work can be found in [Shakkottai et al. 2003][Zou and Chakrabarty 2005]. In this paper, however, we focus on the coverage issue. The operations of reporting an abnormal event after it is detected are out of the scope of this paper. In our ACM Transactions on Sensor Networks, Vol. 2, No. 3, 09 2001.
Preparing Articles for the ACM Transactions on Sensor Networks
·
115
scheme, sensors need to exchange information with their neighbors. Therefore, the ratio range must be larger than sensing range for the operations of our protocols. This is true in practice [Miluzzo et al. 2006]; in particular, when the sensors are moving from short range 802.15.4 to Wi-Fi or even longer transmission ranges. 3. SELF-PROTECTION: THE PROBLEM We formulate the sensor network as a graph G(V, E). V represents the set of sensor nodes, and E is the set of directed links, (u, v), where nodes u, v ∈ V and v is in the sensing range of u. We use |V | and |E| to denote the number of nodes and the number of links, respectively, and assume that |V | = N . A sensor is called active, if it is able to provide coverage for the surrounding environment; otherwise it is called a sleeping sensor. Definition 3.1. A sensor network is k-self-protected if each sensor (active or sleeping) is covered by at least k − 1 active sensors. In this paper, we focus on the 2-self-protection only; yet the techniques described can be extended to k-self-protection. In the rest, self-protection simply refers to the 2-self-protection, and we will point out the techniques for generalization whenever necessary. Since energy consumption is a major concern in sensor networks, we study two energy measures. First, we find the smallest number of sensors to activate for self-protection. Second, notice that for long term operations of a sensor network, a common strategy for sensors is to alternate between active and sleeping states. Thus, we find the maximum number of disjoint sets of sensors, each set of which can provide self-protection when the sensors in this set are activated. Consequently, different sets of sensors can work in turn. The lifetime of the sensor network is multiplied by the number of disjoint sets. Formal definition of the two measures are as follows: Definition 3.2. A Minimum Self-Protection is a self-protection for the senor network, where the number of nodes selected to be active is minimized at a certain time. Definition 3.3. A Maximum Disjoint Self-Protection is a set of disjoint selfprotections for the sensor network, where the cardinality of the set is maximized. 4. CENTRALIZED SCENARIOS We first consider the scenario where the sensors can be centrally controlled. This is often achievable in small-scale sensor networks. We prove that both the minimum self-protection problem and the maximum disjoint self-protection problem are NPcomplete. We then present an approximation algorithm for the minimum selfprotection and discuss solutions for finding these self-protections. 4.1 Minimum Self-Protection: Centralized Scenario Theorem 4.1. Finding minimum self-protection is NP-complete. Proof. It is easy to see that the decision problem of validating a given selfprotection is solvable in polynomial time. Therefore, the minimum self-protection ACM Transactions on Sensor Networks, Vol. 2, No. 3, 09 2001.
116
·
Dan Wang et al.
is in NP class. To show this problem is NP-hard, we reduce the Minimum Set Cover to it; the former is known to be NP-complete [Garey and Johnson 1979]. Given a set cover instance, (U, C), where U = u1 , u2 , u3 , . . . , un is the universe of the elements and C = c1 , c2 , c3 , . . . , cm is the family of the subsets of U , construct network G = (V, E), where each node v ∈ V corresponds to an element of U or an element of C. Thus we have |V | = |U | + |C|. E consists of two parts: 1) Make full connection of nodes representing the elements from C; 2) For each node v ∈ V , representing ui ∈ U , 1 ≤ i ≤ n, connect v with the node w ∈ V , representing cj ∈ C, 1 ≤ j ≤ m where ui ∈ cj . We next show that by finding a minimum self-protection, P, in G, we can find a minimum set cover for (U, C) in polynomial time. For each node v in P representing an element ui , delete v and change it to w, which represents the subset cj containing this single element ui . The resulting protection is still a minimum self-protection with no isolating node, and this operation is polynomial. It is easy to see that the resulting nodes representing cj are indeed a minimum set cover, because if there is another set cover with fewer sets, when mapping back to G, we can find a self-protection with fewer nodes, which contradicts to our assumption that P is a minimum self-protection. The minimum self-protection problem can be formulated as a constrained dominating set problem, i.e., the degree of every node in the set has to be at least k − 1 for k-self-protection and one for self-protection. The subgraph formed by the dominating nodes does not need to be connected, however; only isolating nodes are prohibited. We then show that an approximation algorithm exists for minimum self-protection through minimum dominating set problem; the cost of the self-protection is the number of sensors selected to be active. Lemma 4.2. The cost of the minimum self-protection is at most twice of the cost of the minimum dominating set [Garey and Johnson 1979]. And this is also an upper bound. Proof. A dominating set is a set of node where all remaining nodes in the network will connected to at least one node in the dominating set. It is easy to see that a minimum self-protection is a dominating set. We now prove, by contradiction, that the cost of this minimum dominating set is at least half of the cost of minimum self-protection. If the minimum dominating set contains fewer nodes than half of the minimum self-protection, then we add the same number of nodes adjacent to the nodes in this minimum dominating set. The resulting set of nodes is clearly a minimum self-protection. This contradict to that the cost of the protection is minimum. This bound is also a lower bound since the minimum dominating set can also be an independent set, e.g., the network is a straight line. Theorem 4.3. A 2(1+log|V |) approximation algorithm exists for minimum self protection. Proof. A (1 + log|V |) approximation algorithm for minimum dominating set is given in [Johnson 1974]. Since the cost of minimum self protection will not be less than minimum dominating set problem, then by doubling this, we will have an easy 2(1 + log|V |) approximation algorithm. ACM Transactions on Sensor Networks, Vol. 2, No. 3, 09 2001.
Preparing Articles for the ACM Transactions on Sensor Networks
·
117
4.2 Maximum Disjoint Self Protection: Centralized Scenario Theorem 4.4. Finding k-disjoint self-protection is NP-complete for all k. Proof. It is easy to see that the problem is in NP class. We now reduce the k-disjoint set cover problem to it; the former is a known NP-complete problem [Cardei and Du 2005]. Let U = u1 , u2 , u3 , . . . , un be the universe of the elements and C = c1 , c2 , c3 , . . . , cm be the family of the subsets of U . A k-disjoint set cover problem is defined as whether C can be partitioned into k-disjoint set covers of U . Given any instance of disjoint set cover, construct a network G = (V, E) similar to the proof of Theorem 4.1. We find a k-disjoint self protection in this network. We prove that we subsequently find a k-disjoint set cover: For all the links connecting the node representing cj and ti , we remove ti . The resulting set is a disjoint set cover, since every set of nodes will dominate all other nodes. The cardinality of this disjoint set cover is k. Corollary 4.5. Finding Maximum Disjoint self-protection is NP-complete. Proof. We can reduce 2-Disjoint self-protection to it, since an obvious observation is that after merging any disjoint sets of nodes of self protection, the resulting set is still a valid self protection. To find a maximum disjoint self-protection, we may use the minimum selfprotection as a building block and iteratively find the solution. An alternative way is that both the minimum self-protection and the maximum disjoint self-protection can be formulated using integer programming. Heuristics can thus be constructed by relaxing the integrity constraints. The centralized algorithms are suitable for small-scale sensor networks, where all the sensors can be easily controlled through a central unit. For example, the video sensor monitoring systems in museums, where the number of art collections to be protected is very limited. 5. DISTRIBUTED SCENARIOS In a large sensor network, each sensor needs to make decisions based on limited information. In this section, we present two distributed approaches for selfprotection, pre-scheduled independent activation (PIA) and neighborhood cooperative self-protection (NC). In pre-scheduled independent activation, an activation schedule is pre-defined and each sensor follows this schedule without knowing the behavior of other sensors. In neighborhood cooperative self-protection, sensors negotiate activation schedules with each other in a distributed manner. In both PIA and NC, while maintaining qualified protection, sensors need to minimize and balance the energy consumption. We study the relationship between the quality of the self-protection with some key parameters of the system, such as the life time of each sensor and the expected life time of the system, the sensing range of each sensor and the density of the sensor network. Let R be the sensing range and l be the life time of a single sensor with full activation. We assume the sensors are uniformly distributed with density d. ACM Transactions on Sensor Networks, Vol. 2, No. 3, 09 2001.
118
·
Dan Wang et al.
5.1 Two Randomized Algorithms for Pre-scheduled Independent Activation (PIA) In the centralized scenario, the sensor network can find a set of sensors so that all the sensors are protected. In the distributed scenario, this deterministic allocation can be difficult to achieve with no global information. We thus adopt the following probabilistic definition for self-protection: Definition 5.1. Given user defined tolerance parameter δ ∈ (0, 1), a protection is said to be (1-δ)-self-protected if in any given area, the probability that the sensors in this area are not protected is less than δ. Notice that this definition is an extension for our self-protection in the probabilistic point of view. It can be extended to (1-δ)-k-self-protection where the probability that a sensor is not k-self-protected is less than δ 1 . In PIA, a timer and an activation probability p are built in each sensor. When the timer expires, the sensors activate itself with probability p and reset the timer. The key parameter a sensor needs to set for PIA is p, given the user required δ and the network setting. The timers for the sensors also need to be synchronized. Techniques in previous studies of synchronization (e.g., [Elson and Estrin 2001][Li and Rus 2004]) can be used. In addition, a rough synchronization is enough for our algorithm as for each period of time, there can be an initial adjustment phase to adapt to the skew of the sensor clocks. We now discuss two randomized algorithms: in the first, a sensor reactively links to another active sensor after activation; in the second, a sensor pro-actively decides its partner before activation. 5.1.1 Total Random Activation. Each sensor independently makes decisions to activate itself with probability p. After activation, the sensor will search within its sensing range of other active sensors, and connect them as partners. If there is no other active sensor in its neighborhood, the sensor goes back to sleep. To determine the activation probability p, we assume the sensors are on a unit size mesh where the distance between each neighboring sensor is √1d and R > √1d . In our simulation, we relax this assumption and show similar results hold for random uniform distribution. ¡ ¢ √ 2 2+ln δ1 + ln δ1 (4+ln δ1 ) Theorem 5.2. The sensor network is (1-δ)-self-protected if p > . R2 d Proof. Let Yi be a random variable where Yi = 1 if sensor i is activated and Yi = 0 otherwise. Let S denote the set of sensors in a circle with radius r = 12 R. If any sensor that falls into thisP circle is active, all sensors in this circle are covered; see Fig. 2. Define Y where Y = i∈S Yi . The total number of sensors in this circle is at least n = 12 R2 d−c, where c is a constant, as approximated by the inner square of this circle; see Fig. 2. We omit c as it can be compensated by a small adjustment in the probability. Clearly, we have E[Y ] = 21 R2 dp. To construct a self-protection, at least 2 sensors need to be activated in this circle, i.e., we need to find P r[Y < 2]. Since each sensor makes activation independently, using Chernoff’s inequality [Motwani 1 Usually,
δ is a small number. For example if δ = 10%, we have a 90%-self-protection, i.e., the probability that a sensor is protected is 90%. ACM Transactions on Sensor Networks, Vol. 2, No. 3, 09 2001.
·
Preparing Articles for the ACM Transactions on Sensor Networks
119
R R
R r
(a)
R
(b)
Fig. 2. (a) Outside circle has radius R, equal to the sensing range; inside circle has radius r = 12 R. Any sensor activated in this circle will protect all sensors in this circle. The number of sensors is √ √ at least equal to the sensors in the inner box. (b) The inner rectangular is ( 22 R + R) × 22 R. Any pair of sensors activated in this rectangular will protect all sensors in this rectangular. A few pairs are√shown as parallel lines in the rectangular. The number of pairs in this region is at least √ 2 2 R × R = 12 R2 . 2 2 2
2 E[Y ]
−(1− E[Y ] ) 2 2 and Raghavan 1995], we have P r[Y < 2] = P r[Y < E[Y < ] E[Y ]] < e ¢ ¡ √ 2 2+ln δ1 + ln δ1 (4+ln δ1 ) δ. By solving the last inequality, we have p > . The theorem R2 d follows as the circle is arbitrarily chosen.
In the above proof, R should be smaller than the sensor area; so as to make d meaningful for arbitrary chosen circles. This is true in practice where the entire sensor area is much larger than the sensing range of each individual sensor. For boundaries of the sensor network, the density usually is less than the area inside the sensor networks. One solution is to deploy sensors in a slightly enlarged sensor area. Otherwise, it is possible to make the inside area of the sensor network along the boundaries “denser” to compensate the empty outside regions. The bound in Theorem 5.2 is a lower bound. While provides guarantee for (1-δ)self-protection, in practice it may activate more sensors than necessary. It, however, gives us important information of the relations between different parameters. Obviously, the activation probability p is inversely proportional to sensing range R2 and density d, implying that the sensing range has a significant impact on p. The user confident level is easier to boost (i.e., the error δ is easier to reduce), as p ∝ O(ln 1δ ). In fact, from probability theory and randomized algorithms, repeating the sampling O(log k) times will improve δ to kδ . It is worth noting that, given a certain density d and sensing range R, it is possible that we can not achieve a certain level of self-protection at all; if the sensors are too sparse. Therefore, to achieve a quality protection, we may have to sacrifice the cost of deploying more sensors. This is formally stated in Corollary 5.3, which is also illustrated by numerical experiments shown in Fig. 3 where R = 3 and the area is a 40 × 40 square. ratio (1-δ), the minimum density of Corollary 5.3. ¡To achieve ¢ √ the protection 2 2+ln δ1 + ln δ1 (4+ln δ1 ) the network is d > . R2 ¡ ¢ √ 2 2+ln δ1 + ln δ1 (4+ln δ1 ) Proof. Directly from < p < 1. R2 d ACM Transactions on Sensor Networks, Vol. 2, No. 3, 09 2001.
·
120
Dan Wang et al.
40000
7000 p = 0.1 p = 0.5 p = 1.0
Total Random Paired Random
6000
30000
Number of Sensors
Number of Sensors
35000
25000 20000 15000 10000
5000 4000 3000 2000 1000
5000 0
0 0
20
40 60 delta(%)
80
100
0
20
40 60 delta(%)
80
100
Fig. 3. Number of sensors needed as a Fig. 4. Comparison of Total Random function of the tolerance parameter. and Paired Random Activation. We are also interested in the life time of the system. The life time of the network is directly related to the life time of each sensor. Neglecting the energy consumption during the sleeping state and other light-weight uses, the expected life time of the network can be estimated as L = pl if the active sensor sets are periodically alternated in a random fashion. This result, together with Corollary 5.3, implies that the life time of the network is proportional to the sensor density, as formally stated in Corollary 5.4. This is consistent with the experimental findings in [Xu et al. 2001]. Corollary 5.4. To achieve the protection ratio (1-δ) ¡ and the √ expected ¢life time 2L 2+ln δ1 + ln δ1 (4+ln δ1 ) L, the minimum density of the sensor network d > . lR2 5.1.2 Paired Random Activation. The sensors will first arbitrarily choose one of their neighbors to form pairs. Sensor pairs will activate themselves with certain probability, which, by re-using notations, is also denoted as p. Compared to Total Random Activation, where the sensors may not find other active sensors in its surroundings after activation, Paired Random Activation guarantees sensors are activated in a protected way. Similar to Total Random Activation, for analytical purposes, we assume that the sensors are placed in a unit mesh. Sensor pairs are specifically chosen in parallel with each other as shown in Fig. 2 (b) and the distance between the two sensors in a pair is R. Intuitively, we paired the sensors that they will cover a larger area. √ 2(1+ln δ1 + ln δ1 (1+ln δ1 )) Theorem 5.5. The sensor network is (1-δ)-self-protected if p > . R2 d Proof. Let Yi be a random variable where Yi = 0 if sensor pair i √is not activated √ and Yi = 1 if activated. Let S denote the set of pairs in a 22 R×(R+ 22 R) rectangle. P Let Y be the total number of pairs activated in this rectangle, we have Y = i∈S Yi . √ √ The number of pairs in this rectangle is at least n = 22 R × 22 Rd = 12 R2 d, where we count the pairs with both ends being in the rectangle only. It follows that E[Y ] = 12 R2 dp. Note that whenever a pair located in this rectangle is activated, the entire rectangle will be protected, as shown in Fig. 2 (b). Therefore, the probability that the rectangle is not protected is P r[Y < 1]. Since all pairs are ACM Transactions on Sensor Networks, Vol. 2, No. 3, 09 2001.
Preparing Articles for the ACM Transactions on Sensor Networks
·
121
activated independently, using Chernoff’s inequality, we have P r[Y < 1] = P r[Y < 1 E[Y ] E[Y
1
]] < e−(1− E[Y ] )
2 E[Y ] 2
< δ. By solving the last inequality, the theorem
follows.
We compare Paired Random Activation and Total Random Activation by using the activation bounds in Theorem 5.2 and 5.5. Although these bounds are not tight, they give important indication of the performance of the two algorithms. Numerical experiment results are shown in Fig. 4, where the total number of sensors is 5000, the sensor field is 40 × 40, and R = 3. We see that, when δ is small, the number of sensors required to achieve (1-δ)-self-protection in Paired Random is much larger than Total Random. For such small δ, we need a more refined protection and high activation probability for both algorithms. Consequently, even if sensors make activation decision individually in Total Random, the probability that they can not find other active sensors in their neighborhood is relatively small if a large number of sensors are activated; Paired Random, however, might activate more sensor than needed in this case. On the other hand, when δ is large, the two algorithms perform closely. The drawback of Total Random is that some sensors might not find protection after activation in this case. While our analysis is based on a mesh sensor network and various assumptions, our simulations results in Section 7 validate the above conclusions for uniformly distributed sensor networks. 5.2 Neighborhood Cooperative Self-Protection In PIA, to accurately estimate the activation probability p, the density of the sensor network should be known. This, however, can not be easily obtained if the sensors are deployed arbitrarily, e.g., from an aircraft. We now present another distributed self-protection, Neighborhood Cooperation, where sensors work cooperatively to provide necessary protections without knowing the density information. There have been many studies on neighborhood cooperation in sensor networks, e.g., Geographical Adaptive Fidelity (GAF) [Xu et al. 2001] and Probing Environment and Adaptive Sleeping (PEAS) [Ye et al. 2003]. In GAF, the sensors cooperate for routing. The area is divided into virtual grids, and each sensors in a grid can reach all the sensors in the neighboring grids. Thus, the sensors in a grid are equivalent to each other and only one sensor shall be active at a time. The sensors in a virtual grid alternate between sleeping and active states. An additional discovery state is used to assist state transition. PEAS focuses failure prone sensor networks. Sensors alternate between two states, probing environment and adaptive sleeps. In the probing state, each sensor sends out probing messages and collects replies. Each active sensor will measure the frequency of the probing message from its neighbors and attach this information in the reply messages. In the adaptive sleeping state, each sensor sleeps for a duration according to the estimation of active sensors by the frequency information. PECAS [Gui and Mohapatra 2004] extends PEAS by allowing each active sensor to reply the probing message with a variable next sleep time, indicating the remaining active period of this sensor. Upon receiving this message, the probing sensor will activate itself accordingly. Our Neighborhood Cooperative (NC) self-protection is motivated by the above studies. The key difference is that, unlike these schemes where only one active sensor ACM Transactions on Sensor Networks, Vol. 2, No. 3, 09 2001.
122
·
Dan Wang et al.
Discovery
Waiting
Sleeping
Active
Fig. 5.
State Transition Diagram.
is needed, in our setting, sensors not only need to decide whether they should keep active, but also have to wait for other sensors to form pairs if appropriate. The NC algorithm has four states, namely, active, discovery, waiting, and sleeping; see Fig. 5 for the state transition diagram. In the sleeping state, the sensor is in the power saving mode for a period of sleep time dur. After the timer expires, the sensor changes to the discovery state and sends out probe messages to its neighbors. The active neighbor sensors will reply with rejection messages, which includes their remaining active time. If the sensor receives more than rN um rejections, it will return to the sleeping state and set sleep time dur to the smallest remaining active time it receives. Otherwise, it will change to the waiting state, and periodically sends out probe messages. If it receives another probe message, the two sensors will form a pair and activate themselves. The pair sensors will stay for a duration of work time dur in the active state. The work time dur and sleep time dur are chosen uniformly from [0, MAX WORK TIME] and [0, MAX SLEEP TIME]. Fig. 6 gives an illustrative example of the state transition for a sensor network consisting of five sensors. In Fig. 6 (a), sensor 2 and 3 are in the active states, protecting each other and the surrounding sleeping sensors. In Fig. 6 (b), two sleeping sensors 1 and 4 wake up and send discovery messages to their neighbors. We set rN um = 2 in this example, so sensor 1 switches to the waiting state and sensor 4 returns to sleep after receiving two rejections. Sensor 4 sets the sleeping time to the remaining working time for the active sensors. In Fig. 6 (c), Sensor 0 changes to waiting state, and the waiting sensors send probe messages to the neighbors. In Fig. 6 (d), the two waiting sensors 0 and 1 become active. The two original active sensors 2 and 3 return to sleep as their working timers expire, and the sleeping sensor 4 wake up to the discovery state. The basic design philology of NC is to use rN um to control the quality of the self-protection and the sleep/work schedules to balance the energy consumption. Its performance will be evaluated through simulations in Section 7. 6. BINDING WITH THE MAIN OBJECTIVES As we mentioned earlier, self-protection improves the robustness of the network, but itself is never the single objective in the system design. It serves as a complement to such main objective(s) as monitoring the field or valuable objects. Therefore, ACM Transactions on Sensor Networks, Vol. 2, No. 3, 09 2001.
Preparing Articles for the ACM Transactions on Sensor Networks
Sleeping
·
123
Discovery 4
4
Rejection Discovery
Active Active 3
3
Active
2
Active
2
Discovery Rejection
Sleeping
1
1
Discovery
Sleeping
Sleeping 0
0
(a)
(b)
Discovery
Sleeping 4
4
Active
Sleeping Active
3
2
3
Sleeping 2
Active
Waiting
1
1
Activation
Probe
Waiting
Active 0
0
(c)
(d)
Fig. 6. (a) A snapshot of the sensor network; (b) Sensor 1 and 4 are in discovery state; (c) Sensor 4 returns sleep after receiving two rejections (rN um = 2); Sensor 1 switch to waiting state; (d) Sensor 0 and 1 change to active state and sensor 4 wakes up again.
an effective integration of self-protection with these main protection objective is a critical issue. We suggest a two-tier architecture, in which the sensor network will first calculate the set of sensors that can provide self-protection. All the sensors will then participate in the operations for the main objectives. The set of sensors to stay in active is the union of that for self-protection and for the main objectives. An interface is provided between the two tiers for communicating of their respective energy consumption. Each tier then independently optimizes its coverage and energy consumption. We adopt this architecture for its simplicity and adaptability to different coverage/protection scenarios (i.e., main objectives). The main design principle is that the sensor network should first be self-protected. Then the sensors will participate the calculation for the main objectives, according to their energy status. We focus ACM Transactions on Sensor Networks, Vol. 2, No. 3, 09 2001.
124
·
Dan Wang et al.
on the interface of how the sensors should know the energy status so that they can estimate the self-protection correctly. We thus concentrate on how to enhance our self-protection algorithms for PIA and NC, respectively. 6.1 Energy Adjustment for PIA In Pre-scheduled Independent Activation (PIA), the sensors are aware of their total remaining energy and the energy usage for self-protection and operations for the main objectives. Since each node does not know the energy consumption of other sensors, to balance the load, the sensor needs to have the knowledge of the average energy consumption ratio between the cost of self-protection and the cost of the main objectives. This information can be estimated based on the functionality of the main objective and previous experiences. Thus, the sensors can evaluate the speed of its own energy consumption according to history information. If the energy consumed by the coverage for the main objective is high, then this sensor will not be included in the calculation of the main objective in the future round. For example, the calculation for the coverage of the main objective can be based on a sub network by removing this sensor. 6.2 Energy Adjustment for NC In Neighborhood Cooperative Self-Protection (NC), the sensors negotiate with neighboring sensors. To estimate the self-protection correctly according to the energy consumption, the sensors include their remaining energy information in each outgoing message. Accordingly, every sensor receiving the energy information can make decisions on extending or shrinking its work time dur and sleep time dur. Let e remain be the remaining energy of a sensor and avg be the average energy remaining for the sensors in its neighborhood, we choose work time dur uniformly from [0, MAX WORK TIME] multiplying an adjustment factor of ( e remain )2 . On avg additional concern in this setting is that two active sensors might not go to sleep together; consequently, if one active sensor in a pair returns to sleep, the other one will wait and activate the next sensor that is in discovery state. It is worth noting that the active/sleeping commands from the two tiers could be conflict for individual sensors; A closer interaction and joint optimization between the two tiers would be superior in balancing energy consumption. Nevertheless, the overall system can be quite complex and the optimization might not universally fit to diverse main objectives; we thus leave it as a future work. 7. PERFORMANCE EVALUATION 7.1 Simulation Setups In our simulation, unless otherwise specified, we uniformly deploy 500 sensors into a square field of [40m, 40m]. The transmission range of each sensor is set to 3m. To remove randomness, each point in our figure represents an average of 50 random and independent experiments. Note that we have obtained bounded approximation algorithms for the centralized scenario, and the properties of the related problems have been well studied in the literature; hence, we focus on the evaluation of the distributed scenario. ACM Transactions on Sensor Networks, Vol. 2, No. 3, 09 2001.
Preparing Articles for the ACM Transactions on Sensor Networks
Fig. 7.
·
125
A Voronoi Diagram of a sensor network.
Weight of the Maximal Breach Path
8
7
6
5
4 After Attack Before Attack 3 0
Fig. 8.
5 10 15 20 25 Ratio of Active Sensors Attacked (%)
30
Weight of the maximal breach path as a function of ratio of active sensor attacked.
7.2 The Necessity of Self-Protection As an additional level of protection, self-protection has additional demands from the network, such as denser sensor deployment and higher energy consumption. It is therefore important to justify its necessity. In the first set of experiment, we use the maximal breach path [Meguerdichian et al. 2001], a typical protection scheme for the main objective, to show that the protection quality can be poor without self-protection. To find the maximal breach path, one can build an auxiliary graph based on the Voronoi Diagram induced from the topology of the sensor network (See Fig. 7). The weight of each edge in this auxiliary graph is the minimum distance of the edge to the nearest sensors. The problem can then be solved by finding the path with the highest minimum-weight-edge in this auxiliary graph. The deployment of sensor should minimize the weight of the maximal breach path. To attack this coverage, we selectively dismantle a few sensors that are not protected by others. The set of isolated sensors selected should maximize the profit, i.e., making the maximal breach path as wide as possible. This selection problem is NP-complete. ACM Transactions on Sensor Networks, Vol. 2, No. 3, 09 2001.
126
·
Dan Wang et al.
Number of Unprotected Sensors
500 Total Random Paired Random
450 400 350 300 250 200 150 100 50 0 5
Fig. 9.
10
15 20 25 30 Activation Probability(%)
35
40
Number of unprotected sensors as a function of activation probability.
Table I. Overhead of Self-protection Activation Probability p (%) Overhead (%) to achieve Self-Protection 10 44.2 15 30.0 20 19.8 25 12.7 30 9.07
In our implementation, we use a simple heuristic, which randomly selects a subset of sensors to remove and calculate the resultant maximal breach path, and repeats this process k = 8 times. We then pick the best subset, and compare the weight of the maximal breach path before and after the removal of the isolated sensors. We set the activation probability p = 0.1. In expectation, a total of 50 sensors will be in the active state. We attack isolated sensors only and the attack ratio is set from 0% to 30%. We can see from Fig. 8 that by attacking a few isolated sensors, the weight of the breach path is increased substantially. For example, in our experiment, if 25% of the isolated sensors, (5.86 on average, i.e. 1.17% of the total nodes and 10% of the active nodes) are attacked, the weight of the maximal breach path will increase by 39.4%. This degradation is remarkable; also note that a simple interference would achieve the same result of physical removal. Intuitively, this difference is because the coverage of the sensor network has to put on the whole area, while the attacks can target on some weak points of the sensor network. We thus conclude that self-protection is of great importance given that the sensors themselves can be attacked. As claimed, self-protection usually incurs additional activation of sensor nodes. This overhead depends on the definition of the cost of the main objectives of the application. In our paper, we draw an abstraction for the self-protection so as to avoid any specific main objective. Nevertheless, we quantify this overhead in maximal breach path. Notice that theoretically the overhead of self-protection is at most twice compared to without self-protection (for 2-self-protection). This is hardly reached as illustrated in Table I. In Table I, we evaluate the percentage of ACM Transactions on Sensor Networks, Vol. 2, No. 3, 09 2001.
Preparing Articles for the ACM Transactions on Sensor Networks
·
127
additional sensors needed for self-protection as compared to the activation probability. Notice that the more sensors are activated, the less possibility of the isolated sensors and thus the less overhead of the self-protection. 7.3 Performance of Pre-scheduled Independent Activation (PIA) We study the effectiveness of the two pre-scheduled random algorithms (Total Random and Paired Random) for PIA in Fig. 9. The activation probability for Total Random is from 5% to 40%; The activation probability for Pair Random is halved, so that the expected number of active sensors is the same as that in Total Random. We can see that Total Random performs worse than Paired Random if the activation probability is small, because, after activation, sensors might not find other active sensors in their neighborhood. When activation probability is high, the number of sensors unprotected by Total Random is less than Paired Random. One reason is that in Paired Random, sensors need to find a pair sensor before activation; Not all sensors, however, will find such a pair if all the neighbor sensors are paired by other sensors in advance. In addition, Total Random potentially enables to a better distribution of the active sensors, which will also contribute to its protection capability. We next evaluate the parameters that affect self-protection quality. In Fig. 10, we consider the change of the maximal breach paths before and after an attack for Total Random Activation. In particular, we are interested in the enlargement ratio of the weight of the maximal breach path. The base line corresponds to the default network setting, where the sensing range is 3m. Obviously, the higher the activation probability, the smaller the enlargement of the weight of the maximal breach path. To understand the impact of the sensor density and sensing range, we also show the results corresponding to 500 sensors with sensing range of 4m, and 670 sensors with sensing range 3m, respectively. That is, a respective increase of 13 for sensing range and density. We can see that the sensor network with the default setting are most vulnerable to the attack and the enlargement ratio is the highest. It follows our intuition that a denser deployment, or equivalently, larger sensing range, provides better protection. Note that the coverage of each sensor is a square function of the sensing range; hence, an increase of 31 for the sensing range has a higher impact (less enlargement ratio). In Fig. 11, we compare the Total Random Activation and Paired Random Activation in terms of the weights of the corresponding maximal breach paths. As before, the activation probability of Paired Random is half of the activation probability of Total Random, and the attacks focus on isolated active sensors only. We can see that Paired Random performs better than Total Random since our network is a fairly sparse network. As the activation probability increases, however, the differences become marginal. It is also clear that Paired random does not distribute the active sensors as good as Total Random because the weight of the maximal breach path is generally larger before attacks. All these observations are consistent with our analysis in Section 5.1. 7.4 Performance of Neighborhood Cooperative Self-Protection In neighborhood cooperation, we consider the energy consumption of sending, receiving, idling and sensing, and neglect the cost of sleeping, which is generally small ACM Transactions on Sensor Networks, Vol. 2, No. 3, 09 2001.
128
·
Dan Wang et al. 0.6 Base Sensor No.=670 Sensing Range=4
Enlargement Ratio
0.5 0.4 0.3 0.2 0.1 0 10
15 20 25 Activation Probability(%)
30
Fig. 10. The enlargement ratio of the maximal breach path as a function of activation probability.
Weight of the Maximal Breach Path
8 Total Random(Before Attack) Total Random(After Attack) Paired Random
7 6 5 4 3 2 10
Fig. 11.
15 20 25 Activation Probability(%)
30
The weight of the maximal breach path as a function of activation probability.
in practice. We adopt the parameters in [Mainwaring et al. 2002] as transmission, 20nAh (10−9 Ampere-hours) and receiving, 8nAh. The energy consumption for sensing is remarkably smaller than transmission, 1.447nAh. We assume packet transmission has a rate of 6 per idling time. Therefore, according to [Mainwaring et al. 2002] we set our costs, transmission : receiving : idling : sensing to 15:6:6:1. Similar energy consumption ratio is also observed in [Chen et al. 2001][Xu et al. 2001]. We assume that the sensors sensing the environment once per second. The total energy for a sensor is set to 80mAh and the duration of our experiment is 1500 seconds. We study the effect of different parameters in our simulations. We compare the difference between PIA and NC with different parameters. For the pre-scheduled independent activation, we set the interval time to 20 seconds, i.e., each sensor will randomly activate itself with probability p every 20 seconds. For neighborhood cooperation, to have a similar effect, the ratio work time dur : (sleep time dur + work time dur) is set to p. In our setting, p = 10%, work time dur = 10 seconds, and sleep time dur = 90 seconds. rN um is set to 2 and 5, respectively. ACM Transactions on Sensor Networks, Vol. 2, No. 3, 09 2001.
Preparing Articles for the ACM Transactions on Sensor Networks
·
129
Number of unprotected Sensors
500 450 400 350 300 250 200 150 100
Total Random rNum = 5 rNum = 2
50 0 0
200
400
600
800 time
1000
1200
1400
Fig. 12. Number of unprotected nodes during time for Total Random, Neighborhood Cooperation with rN um = 2 and rN um = 5 respectively. 90 Total Random rNum = 5 rNum = 2
Remaining Energy (mAh)
85 80 75 70 65 60 55 50 0
100
200 300 Node Id
400
500
Fig. 13. Energy consumption after 1500 seconds for Total Random, Neighborhood Cooperation with rN um = 2 and rN um = 5 respectively.
The initial protection ratio is set to be the same. The comparison is shown in Fig. 12. In PIA, the protection quality is relative stable over time. In NC, the protection is improved over time. This is because in PIA, each time the network rebuilds the active sensor set, the protection capability remains unchanged, which is, however, not the case for NC. In the latter, the sensors will know the next sleep time from other active sensors and awake at that point of time; this gradually increases the number of sensors needed for protection. Since the process stops according to the number of rejection messages, i.e., the value of rN um, rN um acts an indicator for the system to discourage (or encourage) future active sensors: If the rejection rate is high, then sensors will return to sleep more frequently; otherwise, the sensors will have a higher chance to go to waiting state and subsequently transfer to active state. Clearly, we can boost the protection capability of PIA by increasing p. As argued in our analysis before, this depends on the deployment of the sensor networks, which may not be easily controlled. ACM Transactions on Sensor Networks, Vol. 2, No. 3, 09 2001.
130
·
Dan Wang et al.
Number of unprotected Sensors
500 450 400 350 300 250 200 150 PIA:Biased PIA:Uniform 50 NC:Biased NC:Uniform 0 0 200 400
100
600
800 time
1000
1200
1400
Fig. 14. Total random self-protection for biased and uniform cases; neighborhood cooperative self-protection where rN um = 5 for biased and uniform cases.
100
Number of Sensors
80
NC (50%) NC (30%) TR (50%) TR (30%)
60
40
20
0 100
150 200 250 300 Energy usage for the Main Objective
350
Fig. 15. Number of sensors have low energy as a function of energy usage for the main objective.
The corresponding energy consumption can be seen in Fig. 13. Clearly, PIA is more energy effective, as it does not require extra message exchanges, a major energy consumption for sensor networks. In addition, the number of active nodes in use is less than NC as time progresses. We thus argue that PIA is more beneficial if the sensor network is well planed, e.g., the density is easy to control so that we can pre-estimate the activation probability more accurately, and NC is better for dynamic environments. We next consider the impact of sensor distributions. In Fig. 14, we introduce a biased distribution, where 14 sensors are uniformly distributed in one half of the sensor area, and the remaining 34 sensors are uniformly distributed in the other half of the sensor area; in other words, one part of the network is dense and the other part is sparse. We see that NC performs worse in this biased distribution than in uniform distribution since there are fewer sensors in the sparse area. PIA, however, shows an opposite trend, suggesting that PIA benefit more from the biased network, ACM Transactions on Sensor Networks, Vol. 2, No. 3, 09 2001.
Preparing Articles for the ACM Transactions on Sensor Networks
·
131
in particular, the dense part of the sensor network. 7.5 Binding with the Main Objectives Finally, we study the interactions between the self-protection and the main objectives. To have our self-protection algorithms universally applicable, we consider the main objectives as a black box, and the self-protection module can only estimate the energy consumption of the main objective module. We focus on the capabilities of PIA and NC in energy balancing. If the energy consumption for protecting the main objectives is balanced for each sensor, then the overall energy usage for each sensor will simply drop proportionally. Thus, we focus on the case where the energy consumption of the main objectives is not balanced for each sensor. We assume that 20% of sensors are heavy loaded by the main objectives while the remaining 80% of the sensors are light loaded. These sensors will periodically carry on a task which costs certain amount of energy from 100nAh to 350nAh. We set the period to 100 second, and after 1500 seconds, we calculate the average energy of the sensor and count the number of sensors with residual energy being lower than 30% and 50% of the average energy. The results are shown in Fig. 15. We can see that in NC, the increase of energy consumption for the main objectives does not noticeably affect the number of sensors with low residual energy, suggesting a good energy balancing. On the contrary, for PIA, unfortunately, the number of sensors with low residual energy linearly increases when increasing the energy spending for the main objectives. We can consider the the superiority of Neighborhood Cooperation (NC) in energy balancing from another point of view: There are certain sensors which are of “high value” for achieving the main objectives. Consequently, these sensors should not be burdened with self-protection, and other sensors should help protect these “high value” sensors, as NC does. We can generalize this where less valuable sensors provide protection to more valuable sensors, resulting in a more flexible and robust multi-tier protection architecture. 8. CONCLUSION AND FUTURE WORK In this paper, we pointed out that the sensors themselves can be the weakness in a wireless sensor network for protection applications. Through analysis and simulations, we showed that, by interfering a small set of sensors, the protection/coverage capability of a well-planned sensor network can be significantly damaged, and protections for the sensors themselves are thus necessary. We further demonstrated that the sensors can be effectively protected by themselves, to which we referred to as self-protection. We for the first time presented a formally study of the self-protection strategies. We showed that the problems are generally NP-complete, and developed efficient and bounded approximation algorithms for centrally-controlled sensors. We further presented fully distributed implementations for large-scale sensor networks. In our study, we consider the main protection objectives as a black box, and our self-protection algorithms are generally applicable with different field/object protection algorithms. We however conjecture that some main protection objects might be overlapping with and thus assist self-protection while others might introduce conflicts. Therefore, an interesting future work, as we stated in the paper, is ACM Transactions on Sensor Networks, Vol. 2, No. 3, 09 2001.
132
·
Dan Wang et al.
to joint optimize the self-protection and other protection objectives. ACKNOWLEDGMENT
The authors thank Dr. Peter Y. Chen for helpful discussions. REFERENCES Akyildiz, I., Su, W., Sankarasubramaniam, Y., and Cayirci, E. 2002. A survey on sensor networks. IEEE Communications Magazine 40, 8 (Aug.), 102–114. Al-Karaki, J. and Kamal, A. 2004. Routing techniques in wireless sensor networks: A survey. IEEE Wireless Communications 11, 6 (Dec.), 6–28. Cardei, M. and Du, D. 2005. Improving wireless sensor network life-time through power aware organization. ACM Wireless Networks 11, 3 (May), 333–340. Cardei, M., Thai, M., Li, Y., and Wu, W. 2005. Energy-efficient target coverage in wireless sensor networks. In Proc. IEEE INFOCOM’05. Miami, FL. Chen, B., Jamieson, K., Balakrishnan, H., and Morris, R. 2001. Span: An energy-efficient coordination algorithm for topology maintenance in ad-hoc wireless networks. In Proc. ACM MOBICOM’01. Rome, Italy. Elson, J. and Estrin, D. 2001. Time synchronization for wireless sensor networks. In Proc. IPDPS Workshop on Parallel and Distributed Computing Issues in Wireless Networks and Mobile Computing. San Francisco, CA. Estrin, D., Govindan, R., Heidemann, J., and Kumar, S. 1999. Next century challenges: Scalable coordination in sensor networks. In Proc. ACM MOBICOM’99. Seattle, WA. Garey, M. and Johnson, D. 1979. Computers and Intractability: A Guide to the Theory of NP-Completeness. W. H. Freeman and Company, San Francisco. Gui, C. and Mohapatra, P. 2004. Power conservation and quality of surveillance in target tracking sensor networks. In Proc. ACM MOBICOM’04. Philadelphia, PA. He, T., Krishnamurthy, S., Stankovic, J., Abdelzaher, T., Luo, L., Stoleru, R., Yan, T., Gu, L., Hui, J., and Krogh, B. 2004. Energy-efficient surveillance system using wireless sensor networks. In Proc. ACM MOBISYS’04. Boston, MA. Johnson, D. 1974. Approximation algorithms for combinatorial problems. Journal on Computing System Science 9, 256–278. Kumar, S., Lai, T., and Arora, A. 2005. Barrier coverage with wireless sensors. In Proc. ACM MOBICOM’05. Kumar, S., Lai, T., and Balogh, J. 2004. On k-coverage in a mostly sleeping sensor network. In Proc. ACM MOBICOM’04. Philadelphia, PA. Li, Q. and Rus, D. 2004. Global clock synchronization in sensor networks. In Proc. IEEE INFOCOM’04. Hong Kong. Mainwaring, A., Polastre, J., Szewczyk, R., Culler, D., and Anderson, J. 2002. Wireless sensor networks for habitat monitoring. In Proc. ACM WSNA’02. Atlanta, GA. Meguerdichian, S., Koushanfar, F., Gu, G., and Potkonjak, M. 2001. Exposure in wireless ad-hoc sensor networks. In Proc. ACM MOBICOM’01. Rome, Italy. Meguerdichian, S., Koushanfar, F., Potkonjak, M., and Srivastava, M. 2001. Coverage problems in wireless ad-hoc sensor networks. In Proc. IEEE INFOCOM’01. Anchorage, AK. Miluzzo, E., Lane, N., and Campbell, A. 2006. Virtual sensing range. In Proc. ACM Sensys’06. Boulder, CO. Motwani, R. and Raghavan, P. 1995. Randomized Algorithms. Cambridge University Press, New York, NY. Shakkottai, S., Srikant, R., and Shroff, N. 2003. Unreliable sensor grids: Coverage, connectivity and diameter. In Proc. IEEE INFOCOM’03. San Francisco, CA. Slijepcevic, S. and Potkonjak, M. 2001. Power efficient organization of wireless sensor networks. In Proc. IEEE ICC’01. Helsinki, Finland. ACM Transactions on Sensor Networks, Vol. 2, No. 3, 09 2001.
Preparing Articles for the ACM Transactions on Sensor Networks
·
133
Veltri, G., Huang, Q., Qu, G., and Potkonjak, M. 2003. Minimal and maximal exposure path algorithms for wireless embedded sensor networks. In Proc. ACM SENSYS’03. Los Angeles, CA. Wang, X., Xing, G., Zhang, Y., Lu, C., Pless, R., and Gill, C. 2003. Integrated coverage and connectivity configuration in wireless sensor networks. In Proc. ACM SENSYS’03. Los Angeles, CA. Xu, Y., Heidemann, J., and Estrin, D. 2001. Geography-informed energy conservation for ad-hoc routing. In Proc. ACM MOBICOM’01. Rome, Italy. Yan, T., He, T., and Stankovic, J. 2003. Differentiated surveillance of sensor networks. In Proc. ACM SENSYS’03. Los Angeles, CA. Ye, F., Zhong, G., Cheng, J., Lu, S., and Zhang, L. 2003. Peas: A robust energy conserving protocol for long-lived sensor networks. In Proc. IEEE ICDCS’03. Providence, RI. Zhang, W. and Cao, G. 2004. Optimizing tree reconfiguration for mobile target tracking in sensor networks. In Proc. IEEE INFOCOM’04. Hong Kong, China. Zou, Y. and Chakrabarty, K. 2005. A distributed coverage- and connectivity-centric technique for selecting active nodes in wireless sensor networks. IEEE Transactions on Computer 8 (Aug.), 978–991.
ACM Transactions on Sensor Networks, Vol. 2, No. 3, 09 2001.