The Stata Journal ()
, Number , pp. 1–12
The Simulation Extrapolation Method for Fitting Generalized Linear Models with Additive Measurement Error James W. Hardin Henrik Schmiediche Norman J. Arnold School of Public Health Department of Statistics MS-3143 University of South Carolina Texas A&M University Columbia, SC 29208 College Station, TX 77843-3143 Raymond J. Carroll Department of Statistics MS-3143 Texas A&M University College Station, TX 77843-3143 Abstract. We discuss and illustrate the method of simulation extrapolation for fitting models with additive measurement error. We present this discussion in terms of generalized linear models (GLMs) following the notation defined in Hardin and Carroll (2003). As in Hardin et al. (2003), discussion will include specified measurement error, measurement error estimated by replicate error-prone proxies, and measurement error estimated by instrumental variables. In addition, we will discuss and illustrate three extrapolant functions. Keywords: simulation extrapolation, measurement error, instrumental variables, replicate measures, generalized linear models
1
Introduction
his paper describes software for analyzing measurement error models. This software production was funded by a National Institutes of Health (NIH) Small Business Innovation Research Grant (SBIR) (2R44RR12435-02) which was managed by Stata Corporation. The goal of the work described in the grant is the production of software to analyze statistical models where one or more covariates are measured with error. The software development included two major features. The first development feature is the development of the Stata program to support communication to dynamically linked user-written computer code. Stata Corporation was responsible for this development and support for user-written code in the C language was added to Stata version 8. Stata refers to compiled user-written code as a plugins and maintains documentation on their website at http://www.stata.com/support/plugins. See Hardin and Carroll (2003) for an introduction. The project described was supported by Grant Number R44 RR12435 from the National Institutes of Health, National Center for Research Resources. Its contents are solely the responsibility of the authors and do not necessarily represent the official views of the National Center for Research Resources.
c Stata Corporation °
st0001
2
Simulation-Extrapolation
This paper introduces the simulation extrapolation (SIMEX) method for addressing measurement error in generalized linear models. This method shares the simplicity of the regression calibration method and is suitable for problems with additive measurement error. SIMEX is a simulation-based method aimed at reducing bias caused by the inclusion of error-prone covariates. Estimates are obtained by adding additional measurement error; a type of resampling approach. This resampling uncovers the trend of measurement error. Once the trend is estimated, final estimates are obtained by extrapolating back to the case of no measurement error.
2
The SIMEX method
Although the SIMEX method is applicable to a large class of models, it is easiest to understand in the context of simple linear regression where the predictor is measured with error. We assume a model Y = β0 + β1 XU + ². With measurement error, we do not observe XU , but instead XW where XW = XU + U (U has mean zero and variance σu2 ). In addition, we assume that U is independent of XU and Y. The initial step of the SIMEX algorithm is the simulation step. In this step, we use simulation to create additional datasets with increasingly larger amounts of measurement error (1 + θ)b σu2 ; θ is a discrete set of values typically taken to be {0.5, 1.0, 1.5, 2.0}. Let’s take a simple linear regression example in order to illustrate the main ideas of the algorithm. The following do-file generates some data for which we can use the associated Stata software. In so doing, we can look at the intermediate results as they relate to the SIMEX algorithm. clear set seed 12345 set obs 100 gen xu = 5*invnorm(uniform()) gen w = xu + .5*invnorm(uniform()) gen y = 0 + 1*xu + invnorm(uniform()) local suu = .25 mat uinit = (‘suu’) simex (y=) (xunknown: w), suuinit(uinit) seed(1)
The resulting estimated coefficients from running this do-file are given by . simex (y=) (xunknown: w), suuinit(uinit) seed(1) Simulation extrapolation No. of obs Residual df = 98 Wald F(0,98) Prob > F Variance Function: V(u) = 1 Link Function : g(u) = u y
Coef.
xunknown
1.013505
= = =
100 . .
[Gaussian] [Identity] Std. Err. .
t
P>|t| .
.
[95% Conf. Interval] .
.
Hardin & Carroll _cons
3 -.1889483
.
.
.
.
.
For the moment, we will ignore the fact that there are no estimated standard errors. One of the results that is returned is a matrix of the fitted coefficients. We can see these: . mat list e(theta) e(theta)[6,3] theta xunknown r1 -1 1.0135053 c1 0 1.0007818 c2 .5 .99797573 c3 1 .99244262 c4 1.5 .98341659 c5 2 .98346201
_cons -.1889483 -.1930212 -.19624396 -.19533214 -.20282188 -.20240457
Saved in the e(theta) results is a matrix. The first column is the scale factor for how much extra measurement error is added to the error-prone variable; in our case this is the w variable. Remaining columns show the average fitted coefficients for each scale factor. These are calculated by simulating the added measurement error a number of times, fitting the model, and then calculating the mean coefficient vector. The first row is the extrapolation results. The second row is the results of running the analysis where we ignore the measurement error. We can obtain these results by simply running the analysis of interest (a linear regression) where we simply substitute the error-prone covariate w for the unknown covariate x. . regress y w Source
SS
df
MS
Model Residual
2506.14071 134.25
1 98
2506.14071 1.36989796
Total
2640.39071
99
26.6706132
y
Coef.
w _cons
1.000782 -.1930212
Std. Err. .0233981 .1173708
t 42.77 -1.64
Number of obs F( 1, 98) Prob > F R-squared Adj R-squared Root MSE P>|t| 0.000 0.103
= 100 = 1829.44 = 0.0000 = 0.9492 = 0.9486 = 1.1704
[95% Conf. Interval] .954349 -.4259397
1.047215 .0398973
Regression calibration attempts to estimate the unknown covariate and then run the analysis of interest using this linear approximant in place of the unknown covariate. SIMEX, on the other hand, simulates data in order to see the effect of measurement error on the fitted coefficients so that we can extrapolate back to the results we would have if the covariate were known. There are several ways to model the trend. By default, the software fits a quadratic model. Using the results from our do-file, we would consider the data . list, table clean noobs
4
Simulation-Extrapolation theta 0 .5 1 1.5 2
xunknown 1.000782 .9979757 .9924426 .9834166 .983462
cons -.1930212 -.196244 -.1953321 -.2028219 -.2024046
For each of the fitted coefficients, we can model the trend over the theta variable. The default quadratic model is fit as . gen theta2 = theta*theta . reg xunknown theta theta2 Source SS
df
MS
Model Residual
.000242399 .000016459
2 2
.000121199 8.2294e-06
Total
.000258858
4
.000064714
xunknown
Coef.
theta theta2 _cons
-.0111026 .0006315 1.001771
Std. Err. .0063962 .0030668 .0026998
t -1.74 0.21 371.05
Number of obs F( 2, 2) Prob > F R-squared Adj R-squared Root MSE P>|t| 0.225 0.856 0.000
= = = = = =
5 14.73 0.0636 0.9364 0.8728 .00287
[95% Conf. Interval] -.0386234 -.0125638 .9901549
.0164182 .0138267 1.013387
. . local extrap = -1 . display _b[theta]*‘extrap’ + _b[theta2]*‘extrap’*‘extrap’ + _b[_cons] 1.0135053 . reg cons Source
theta theta2 SS
df
Model Residual
.000064325 .000013309
2 2
.000032163 6.6546e-06
Total
.000077634
4
.000019409
cons
Coef.
theta theta2 _cons
-.0044281 -.0003204 -.193056
MS
Std. Err. .0057518 .0027578 .0024278
t -0.77 -0.12 -79.52
Number of obs F( 2, 2) Prob > F R-squared Adj R-squared Root MSE P>|t| 0.522 0.918 0.000
= = = = = =
5 4.83 0.1714 0.8286 0.6571 .00258
[95% Conf. Interval] -.0291759 -.0121861 -.2035018
.0203197 .0115453 -.1826102
. display _b[theta]*‘extrap’ + _b[theta2]*‘extrap’*‘extrap’ + _b[_cons] -.18894829
These steps highlight the results returned in the e(theta) matrix. The method for obtaining the coefficients is straightforward for the row where the scale factor is zero. Likewise, given the collection of (mean) coefficients for each scale factor under consideration, and the form of the extrapolant function, it is easy to generate the results for the scale factor of negative one (no measurement error).
Hardin & Carroll
3
5
Simulated data example
The following example may be evaluated by interested readers following the data generation and model fitting commands outlined. Here we illustrate the techniques and results for measurement error analysis with multiple covariates measured with error. We generate the data in order to highlight the benefits of considering the measurement error in the analysis. Our generated data set includes 500 observations and multiple covariates. This approach allows us to illustrate the extrapolation techniques of the SIMEX algorithm. The data are generated and the analysis (with graph) is carried out with the following commands: set seed 1 set more off set obs 500 gen gen gen gen gen
x1 x2 x3 x4 x5
= = = = =
uniform() uniform() uniform() uniform() uniform()
gen err = 0.1*invnorm(uniform()) gen y =
1*x1 + 2*x2 + 3*x3 + 4*x4 + 5 + err
gen a1 = x3 + 0.1*invnorm(uniform()) gen a2 = x3 + 0.1*invnorm(uniform()) gen b1 = x4 + 0.1*invnorm(uniform()) gen b2 = x4 + 0.1*invnorm(uniform()) simex (y=x1 x2) (w3: a1 a2) (w4: b1 b2), mess(2) brep(99) seed(1) simexplot Simulation extrapolation
No. of obs Bootstraps reps
= =
500 99
Residual df
Wald F(4,495) Prob > F [Gaussian] [Identity]
= =
2285.65 0.0000
=
495
Variance Function: V(u) = 1 Link Function : g(u) = u
y
Coef.
x1 x2 w3 w4 _cons
.9288394 2.020262 3.037187 4.160283 4.937932
Bootstrap Std. Err. .0574475 .063705 .0735374 .0671723 .0571472
t 16.17 31.71 41.30 61.93 86.41
P>|t|
[95% Conf. Interval]
0.000 0.000 0.000 0.000 0.000
.8159683 1.895097 2.892703 4.028305 4.825651
1.04171 2.145428 3.181671 4.292261 5.050213
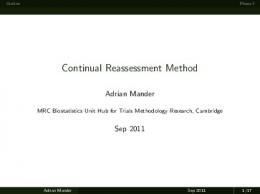
The last command, simexplot, graphs the estimated coefficients for the bootstrap samples generated for each size of measurement error. This command simultaneously shows the results and extrapolation for each of the SIMEX estimates.
6
Simulation-Extrapolation
The simexplot command will also take arguments where the user can specify one or more covariates of interest. In this way, the user can generate individual plots if they so desire.
Hardin & Carroll
7
Simulation Extrapolation SIMEX Estimate
Naive Estimate
2
SIMEX Estimate
w3 2.5 2.6 2.7 2.8 2.9
Naive Estimate
SIMEX Estimate 3
x2 2.005 2.01 2.015 2.02
x1 .92 .94 .96 .98
1 1.02
Extrapolant: Quadratic Type: Mean
−1
0
1
2
−1
0
Lambda
2
SIMEX: .9288393
Naive: 2.003686
−1
0
1
2
Lambda
SIMEX: 2.020262
Naive: 2.848433
SIMEX: 3.037187
5.6
4.2
Naive: .9684857
1 Lambda
Naive Estimate
4
_cons 5.2 5.4
SIMEX Estimate
Naive Estimate SIMEX Estimate
4.8
3.4
5
3.6
w4 3.8
Naive Estimate
−1
0
1
2
Lambda Naive: 3.896319
SIMEX: 4.160283
−1
0
1
2
Lambda Naive: 5.155825
SIMEX: 4.937932
Figure 1: SIMEX results for measurement error model. The model is for generated data following yi = x1 + 2xx + 3x3 + 4x4 + 5. In fitting the model, we have replicate error-prone measurements for the unobserved x3 and x4 variables. The graph illustrates the extrapolated point estimates for all covariates in the fitted model. The label w3 is for the unobserved x3 variable, and the label w4 is for the unobserved x4 . We have two error-prone replicate measures for each of the unobserved covariates in this fitted model. With multiple covariates, naive fitted covariates may be biased in either direction as illustrated.
4
NHANES example
Using data from the National Health And Examination Survey (NHANES), we investigate the presence of breast cancer qbc as a function of other covariates; qage is the age in years of the patient, pir is the poverty index ratio, qbmi is the body mass index, alcohol is indicator for whether the individual uses alcohol, famhist is an indicator of whether there is a family history of breast cancer, and agemen is the age at menarche. Two additional covariates qcalorie and qsatfat are measurements recorded as recalls for the individual on their saturated caloric fat intake. First, we fit a logistic regression ignoring the measurement error. In this model,
8
Simulation-Extrapolation
we simply include the replicate measures in qcalorie and qsatfat as two additional covariates and ignore the measurement error therein. Next, we fit a SIMEX model calculating bootstrap standard errors. In this model, we specify that qcalorie and satfat are replicate measures for an unknown covariate measure of the saturated fat intake of the individual. With 3145 observations, 50 replications per scale factor of measurement error (for 5 values), and 199 bootstrap replications, the model fitting takes some time to complete (approximately 27 minutes on our Linux system as listed in the output). . local y "qbc" . local z "qage pir qbmi alcohol famhist agemen" . local x "qcalorie qsatfat" . logit ‘y’ ‘z’ ‘x’, nolog Logit estimates Log likelihood = -278.47466 qbc
Coef.
qage pir qbmi alcohol famhist agemen qcalorie qsatfat _cons
.0659472 .123113 -1.237347 .4374029 .6615556 -.1589137 -.0135112 -.0237121 -5.649387
Std. Err. .01951 .0772283 2.499628 .287022 .4433177 .2700326 .0199884 .020104 1.126337
z 3.38 1.59 -0.50 1.52 1.49 -0.59 -0.68 -1.18 -5.02
Number of obs LR chi2(8) Prob > chi2 Pseudo R2
P>|z| 0.001 0.111 0.621 0.128 0.136 0.556 0.499 0.238 0.000
= = = =
3145 29.11 0.0003 0.0497
[95% Conf. Interval] .0277084 -.0282516 -6.136529 -.12515 -.2073311 -.6881679 -.0526878 -.0631153 -7.856966
.1041861 .2744776 3.661834 .9999557 1.530442 .3703405 .0256654 .015691 -3.441807
. simex (‘y’ = ‘z’) (w: ‘x’), fam(bin) brep(199) seed(12394) Estimated time to perform bootstrap: 27 minutes. Simulation extrapolation Residual df
=
No. of obs Bootstraps reps Wald F(7,3137) Prob > F [Bernoulli] [Logit]
3137
Variance Function: V(u) = u(1-u) Link Function : g(u) = log(u/(1-u))
qbc
Coef.
qage pir qbmi alcohol famhist agemen w _cons
.0649982 .1298667 -1.542769 .4492951 .6751815 -.1473869 -.0494433 -5.233584
Bootstrap Std. Err. .0156628 .0803848 2.651615 .275521 .4762267 .2937225 .0247267 1.073305
t 4.15 1.62 -0.58 1.63 1.42 -0.50 -2.00 -4.88
P>|t| 0.000 0.106 0.561 0.103 0.156 0.616 0.046 0.000
= = = =
3145 199 6.13 0.0000
[95% Conf. Interval] .0342878 -.0277454 -6.741844 -.0909245 -.2585659 -.7232946 -.0979254 -7.338036
.0957086 .2874788 3.656306 .9895147 1.608929 .4285209 -.0009612 -3.129132
Hardin & Carroll
9
Simulation Extrapolation: w
Coefficient −.03
−.02
Extrapolant: Quadratic Type: Mean
−.04
Naive Estimate
−.05
SIMEX Estimate −1
0
1
2
Lambda Naive: −.0372331
SIMEX: −.0494433
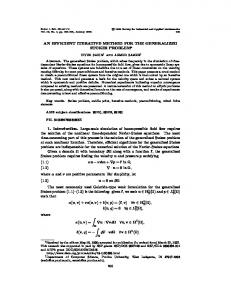
Figure 2: SIMEX results for measurement error model. The plot is for the covariate measured with error and shows the mean coefficient estimates along with the extrapolated value for no measurement error. The model assumes that qcalorie and qsatfat are replicate measures for the true saturated fat intake.
5
Formal Stata syntax
£ ¤ £ £ ¤ £ ¤ ¤ simex ( depvar varlist ) ( depvar varlist ) ... ( depvar varlist ) £ ¤ £ ¤ £ ¤ £ weight if exp in range , message(#) family(string) link(string) ltolerance(#) iterate(#) theta(matrixnum) srep(#) median linear rational nleps(#) nlrep(#) level(#) suuinit(matrixname) bstrap brep(#) btrim(#) seed(#) saving(string) replace
¤
General Options message(#) specifies the desired (observed) level of printed messages of the plugin
10
Simulation-Extrapolation module. Users can use this option to suppress or request warning and informational messages. 0) Display nothing, not even fatal error messages. 1) Display print fatal error messages only. 2) Display warning messages (default). 3) Display informational messages. 4) Display more informational messages. Note that the ADO code that handles the I/O to the plugin may still print error messages regardless of the message level setting. The message command can also be used to see intermediate details of the internal calculations of the code. These where used by the authors to debug the code. The notation and mnemonics used are not documented and may not correspond to anything in the printed documentation. Furthermore the numbers may be in a raw and unadjusted format that are difficult to interpret. 5, 6 & 7) Display details with increasing verbosity. Messages levels are cumulative.
family(string) specifies the distribution of the dependent variable. The gaussian family is the default. The choices and valid family and link combinations are the same as for Stata’s glm command. link(string) specifies the link function; the default is the canonical link for the cmd:family() specified. The choices and valid family and link combinations are the same as for Stata’s glm command. ltolerance(#) specifies the convergence criterion for the change in deviance between iterations. The default is 10− 6. iterate(#) specifies the maximum number of iterations allowed in fitting the model; The default is 100. It is rare that one needs to increase this. theta(matrixnum) specifies the thetas we will use for our simex. theta=(0, .5, 1, 1.5, 2).
The default is
srep(#) specifies the number of replications (simulations) for each theta. The default is 50. median specifies that the median extrapolant function should be used for extrapolating coefficient estimates. The default is the mean. linear specifies that the linear quadratic extrapolant function should be used for extrapolating coefficient estimates. The default is quadratic regression.
Hardin & Carroll
11
rational specifies that the rational extrapolant function should be used for extrapolating coefficient estimates. The default is quadratic regression. When using the rational extrapolant the options nlrep and nleps are also available. nleps(#) specifies the tolerance value to use in the optimization of the rational linear extrapolant. The default is 10− 4. nlrep(#) specifies the number of replications to allow in the optimization of the rational linear extrapolant. The default is 50. Standard Error Options level(#) specifies the confidence level, in percent, for confidence intervals of the coefficients. suuinit(matrixname) specifies the measurement error covariance matrix. This is calculated from the replications in the measurement error variables if it is not specified. Bootstrap Options bstrap specifies that bootstrap standard errors should be calculated. The bootstrap is internal to the code for the regression calibration command. The estimated time to perform the bootstrap will be displayed should the bootstrap require more than 30 seconds. brep(#) specifies the number of bootstrap samples generated to calculate the bootstrap standard errors of the fitted coefficients. The default is 199. btrim(#) specifies the amount of trimming applied to the collection of bootstrap samples prior to calculation of the bootstrap standard errors. The default is .02 meaning that 1% of the samples (rounded) will be trimmed at each end. When the bootstrap is run with mess(3) an informational message similar to this one will display: Average number Maximum number Minimum number Trimming total Maximum change
of of of of in
iterations per GLM call: 3.0 iterations for a GLM call: 3 iterations for a GLM call: 3 4 bootstrap replications (2.0%). standard errors due to trimming: 2.4%
indicating that 4 samples (2 on each end) where trimmed and that this trimming resulted in a 2.4% change in magnitude of one of the standard errors. All other standard errors changed less than 2.4%. This simple diagnostic gives an indication on how trimming influenced the bootstrap standard errors. seed(#) specifies a random number seed used in generating random samples for the bootstrap calculations. This option has no effect if bootstrapping is not specified. Its main purpose is to allow repeatability of bootstrap results. The default is 0 which will seed the random number generator using the system clock. saving(string) specifies the file to which the bootstrap results will be saved.
12
Simulation-Extrapolation
replace the existing ’bootstrap results’ file if it exists.
6
References
Hardin, J. W. and R. J. Carroll. 2003. Measurement Error, GLMs, and Notational Conventions. Stata Journal ??(??): ???–??? Hardin, J. W., H. Schmiediche, and R. J. Carroll. 2003. The Regression Calibration Method for Fitting Generalized Linear Models with Additive Measurement Error. Stata Journal ??(??): ???–??? About the Authors James W. Hardin (
[email protected]), is a Research Scientist in the Center for Health Services and Policy Research and an Associate Research Professor in the Department of Epidemiology and Biostatistics at the Norman J. Arnold School of Public Health, University of South Carolina, Columbia, SC 29208, USA. Henrik Schmiediche (
[email protected]), is a Senior Lecturer and Senior Systems Analyst, Department of Statistics, MS 3143, Texas A&M University, College Station, TX 77843-3143, USA. Raymond J. Carroll (
[email protected]) is a Distinguished Professor, Department of Statistics and Department of Biostatistics & Epidemiology, MS 3143, Texas A&M University, College Station, TX 77843-3143, USA. The authors’ research was supported by the National Institutes of Health (NIH) Small Business Innovation Research Grant (SBIR) (2R44RR12435-02) with Stata Corporation, 4905 Lakeway Drive, College Station, TX 77845, USA.