Microbiology (2003), 149, 2709–2717
DOI 10.1099/mic.0.26575-0
The staphylococcal saeRS system coordinates environmental signals with agr quorum sensing Richard P. Novick and Dunrong Jiang Correspondence Richard P. Novick
Molecular Pathogenesis Program, Skirball Institute and Department of Microbiology, New York University School of Medicine, New York, NY 10016, USA
[email protected]
Received 16 June 2003 Revised
10 July 2003
Accepted 11 July 2003
sae is a two-component signal transduction system in Staphylococcus aureus that regulates the expression of many virulence factors at the transcriptional level and appears to act synergistically with agr in some cases. In this study, the interactions between sae and agr have been characterized in some detail. It was found that the sae locus is larger and more complex than originally envisioned, in that it is expressed from several promoters, giving rise to four or five transcripts, at least three of which are initiated upstream of saeRS and contain two additional reading frames, here designated saeP and saeQ, which are likely to have important roles in sae function. The upstream transcripts are induced during exponential phase concomitantly with the onset of RNAIII synthesis and their induction requires the agr effector, RNAIII, but is blocked by several environmental signals that override the effects of RNAIII. saeR is also required for the induction of these transcripts, so that the sae locus contains an autoinduction circuit. It is suggested that sae is downstream of agr in the exoprotein activation pathway (and also epistatic with agr), that it coordinates the effects of environmental signals with the agr quorum-sensing system, and therefore that it is a key intermediary in the overall regulatory strategy by which S. aureus senses and responds to its environment.
INTRODUCTION Staphylococcus aureus strains produce a large number of extracellular proteins, including virulence factors, which enable the organisms to adapt to various external exigencies, especially the hostile in vivo environment. These extracellular proteins are accessory proteins – not required for the basic processes of growth and multiplication – and, like other accessory proteins, are produced conditionally. For staphylococci, two types of conditional regulatory inputs combine to determine the overall pattern of extracellular protein production: cell density, which activates the agr twocomponent signal transduction system, an extensive global regulon, and external stimuli, which affect defined sets of exoproteins, referred to as stimulons. These two types of regulatory inputs act through and are coordinated by intracellular regulatory mediators whose activities combine in a complex manner according to growth and environmental conditions, to generate the observed extracellular protein patterns. Pleiotropic mutations affecting the production of extracellular proteins have resulted in the identification of several other two-component systems, saeRS, srlRS, arlAB, an alternative sigma factor, sB, a family of winged-helix transcription factors, SarA and its homologues, and unrelated transcription factors including SvrA (Garvis et al., 2002). Readers are referred to several recent Abbreviation: SBCL, subinhibitory clindamycin.
0002-6575 G 2003 SGM
Printed in Great Britain
reviews of the activities and interactions of these various regulators, by Cheung & Zhang (2002), Arvidson & Tegmark (2001) and Novick (2003). It is noted that the synthesis of many cytoplasmic proteins is also controlled by these same regulators and these may also have a role in pathogenesis. For present purposes, however, the focus is on the extracellular accessory proteins. In our studies of the regulation of extracellular protein production, we have thus far concentrated on the agr system. The agr locus controls genes encoding most extracellular staphylococcal proteins, which constitute the agr regulon, and is conserved throughout the staphylococci. Regulation of the component genes is primarily at the level of transcription, though several of the genes are secondarily regulated at the translational level. Nearly all the currently available data on the regulation of extracellular protein genes are from studies on S. aureus; results with other staphylococci are consistent with these (Vuong et al., 2000). In general, during aerobic planktonic growth in vitro, genes encoding secreted proteins are up-regulated during the post-exponential phase, whereas genes encoding surface proteins are up-regulated very early in growth and downregulated shortly thereafter. The intracellular effector of both types of agr-determined regulation is a regulatory RNA, RNAIII. However, several of the environmental factors acting as external inputs into this regulatory system inhibit the production of protein A (a surface protein), as well as of 2709
R. P. Novick and D. Jiang
many secreted proteins, and act independently of agr, whereas others may interact with agr (Chan & Foster, 1998a; Lindsay & Foster, 1999). saeRS appears to be a key element in the regulatory cascade governing the staphylococcal virulon. saeRS was originally identified as a Tn551 insertion with an exoprotein-defective phenotype (Giraudo et al., 1994) and subsequently shown to be a two-component signal transduction module with the transposon insertion in saeR, the putative response regulator gene (Giraudo et al., 1999). In preliminary studies (Ross & Novick, 2001; Novick, 2003), we have observed that sae is a more complicated locus than originally envisioned (Giraudo et al., 1999) and that it has a complex transcriptional pattern that is profoundly influenced by agr and by certain environmental stimuli. In this report, we present a detailed study of the agr–sae interaction, the results of which suggest that sae may have a major role in the integration of cell density signalling with signalling through environmental stimuli and other regulatory elements.
volume – to 1?56108 ml21, diluted by 1 : 3 and grown again to a density of 1?56108 ml21. This represents T=0 h in all time-course experiments. Determination of exoprotein profiles. Samples (1–3 ml), repre-
senting equal numbers of growing bacteria, were centrifuged (Eppendorf, 2 min) and supernatants were trichloroacetic acid (TCA)-precipitated and analysed by SDS-PAGE as described by Laemmli (1970). Gels were stained with Coomassie brilliant blue and scanned. Northern blot hybridization. Culture samples representing equal
numbers of bacteria were centrifuged, washed in 2 ml TE (10 mM Tris/HCl, 1 mM EDTA, pH 7?5) and resuspended in the same buffer. RNA was prepared by the method of Kornblum et al. (1988), separated by agarose gel electrophoresis (1 % agarose in standard Tris/borate buffer), electroblotted to nitrocellulose filters and hybridized to probes prepared by PCR using [32P]dATP (Amersham). Blots were scanned with a Molecular Dynamics phosphorimager and analysed using IMAGEQUANT software (NIH). Sequences of the primers used in this study are listed in Table 2.
RESULTS METHODS
Comparison of exoprotein profiles
Bacterial strains and growth conditions. Strains and plasmids
As the Tn551 insertion in saeR had a profound defect in exoprotein production that was quite different from that seen with Agr2 mutants, we began by analysing exoprotein profiles through time. Fig. 1 shows comparative exoprotein profiles of agr, sae and double mutants in comparison with that of a standard wild-type strain, RN6734, using shakeculture supernatants obtained at several time points during standard growth in CYGP broth without glucose. Each of these samples represents the supernatant from 2?561010 cells. As can be seen, the two mutations have major, but considerably different, effects on exoprotein production. At T=3 h, the patterns are fairly similar for all four strains, with the major differences being the presence of several high molecular mass bands in the Agr2 and double mutant lanes
used in this study are listed in Table 1. Strain RC106 containing a Tn551 insertion was kindly provided by R. Nagel (CEFYBO, Serano 669, Buenos Aires 1414, Argentina). The inserted transposon was transduced to RN6734, giving strain RN9808, and to RN7206, giving RN9809. Throughout the text, ‘Sae2’ refers to saeR : : Tn551, and ‘Agr2’ refers to Dagr : : tetM, i.e. agr-null. Media and growth conditions were as described previously (Novick, 1991) except where noted. Chloramphenicol, tetracycline and erythromycin were each added to GL agar (Novick, 1991) at 10 mg ml21 for plasmid selection. Growth of cultures was in CYGP broth (Novick, 1991) without glucose except as noted, and without antibiotics. For time-course experiments, organisms from overnight GL plates were resuspended at a density of 56107 ml21 (Klett reading of 15), grown with vigorous aeration – 220 r.p.m. in a New Brunswick air shaker at 37 uC in Erlenmeyer flasks with culture volumes of 1/10 the flask
Table 1. Strains and plasmids used in this study Strain/plasmid Strain RN6734 RN7206 RN9388 RC106 RN9808 RN9809 RN9375 RN9360 Plasmid pI524 pRN5548 pRN6848 pRN7143 PRN7144
2710
Genotype/description w13 Lysogen of RN6390 w13 Lysogen of RN6911 (Dagr : : tetM)
Reference
RN6734 sarA : : Tn551 ISP479 saeR : : Tn551 RN6734 saeR : : Tn551; transductant of RC106 RN7206 Dagr : : tetM saeR : : Tn551; transductant of RC106, w13 lysogen Strain 8325-4 DsigB : : tetK Replacement of rsbU deletion in RN6734; adjacent tetracycline-resistance marker
Vojtov et al. (2002) Novick et al. (1993) Cheung et al. (1992) Giraudo et al. (1994) This work This work Nicholas et al. (1999) Kullik et al. (1998)
Naturally occurring b-lactamase plasmid; source of bla repressor PC194-based vector; pRN5543 : : Pbla pRN5548 : : agr–RNAIII (transcriptional fusion, Pbla driving RNAIII) pRN5548 : : saeRS (transcriptional fusion, Pbla driving saeRS) pRN6848 with KpnI site replacing RNAIII terminator loop
Novick & Richmond (1965) Novick et al. (1993) Novick et al. (1993) This work This work
Microbiology 149
agr–sae interactions in Staphylococcus aureus
Table 2. PCR primers used in this study Gene
Primer sequence (59R39)*
saeS
F: GGCTTCTGAAATTACGCAACAAATG R: GTTACAGTCACCGTAGTTCCCAC F: GACAACTAGCGGTAAAGAAGC R: GTATACTCGATACGACGCC F: GTTATGTTAATGCAAGGCTACG R: CATAACAAAGGCTCCAAAGAAAC F: GAAAGTTTTGTGTAGCGTTC R: GCCCTGGTGTTAATGATTGC F: GCATCCTTCTCATCATTTTCAAGAC R: GGGTTATTTGAATGGCTAGGC F: ATGATCACAGAGATGTGA R: CTGAGTCCTAGGAAACTAACTC F: TTAGCCTGGCCTTCAGCC R: TGCCATATACCGGGTTC F: GGCACTACTGCTGACAAAATTGCTGCAG R: GTTCGCGACGACGTCCAGCTAATAACGCTGC F: GACAACAGCGACACTTG R: CTGAATTACCACCAGTTG F: CCAAGAGGCTTATGAACTTGCAATG R: GCGCAGCTTCACTAGACACACG F: GTTCCGCTGCAGGGTCGTAAGAACAGAGGTGAAAAAATAGATG R: GTCGGAGAATTCAGTCTTGAAAATGATGAGAAGGATGGCC
saeR saeQ saeP csbB RNAIII hla spa ssp ssrA saeR csbB *F, forward; R, reverse.
that are absent from the wild-type and Sae2 and several bands in the wild-type that are absent or greatly diminished in the mutants. There is a rather dramatic change between T=3 h and T=6 h. Many bands disappear and several new bands appear in the wild-type lane but not in the mutants. It is noted that the agr system is activated shortly before T=3 h in this strain (Vandenesch et al., 1991) so that some of the changes seen in the wild-type pattern are attributable to agr, which down-regulates some proteins
and up-regulates others. Additionally, however, many bands present in the mutant supernatants at T=3 h disappear by T=6 h. As this is true for both Agr2 and Sae2, it obviously cannot be attributed to down-regulation by agr, and remains unexplained. By the 9 h sample, representing early-stationary phase, the patterns have become more complex; the agr and sae mutant patterns differ considerably from each other and from the wild-type, whereas the agr and double mutant patterns are very similar, suggesting that sae
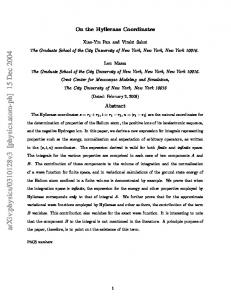
Fig. 1. Exoprotein profiles. CYGP broth cultures, without glucose, were sampled at 3, 6, 9 and 15 h and centrifuged. Supernatants, each representing 2?561010 cells, were TCA-precipitated and analysed by SDS-PAGE according to the method of Laemmli (1970). Lanes 1–4 represent strains RN6734 (wild-type), RN9808 (Sae”), RN7206 (Agr”) and RN9809 (Agr” Sae”), respectively. http://mic.sgmjournals.org
2711
R. P. Novick and D. Jiang
has little, if any, regulatory activity in the absence of a functional agr. The concurrence of agr and sae effects after T=3 h could indicate an interaction between these two regulators. At a later time point, T=15 h, several regulatory classes can be readily discerned. These will be detailed at a later date after the identities of the proteins have been determined. Note that these patterns are considerably different from those reported by Nagel and coworkers, who looked only at an 18 h time point and used a different growth medium (Giraudo et al., 1996). To carry this analysis one step further, we analysed transcription of some of the exoprotein genes. Results with hla, encoding a-haemolysin, sspA, encoding V8 serine protease, and spa, encoding protein A, are shown in Fig. 2. As can be seen in Fig. 2(a), at T=0 h, there is no detectable signal for either RNAIII or hla, whereas at T=5 h there is a
strong signal for RNAIII in the wild-type and Sae2 strains, but not in the Agr2 or double mutant. hla, however, is detectably transcribed only in the wild-type strain, suggesting that sae is downstream from agr in the regulatory pathway, or possibly the two are epistatic. This result is consistent with that previously reported by Giraudo et al. (1997). Fig. 2(b) shows the results for Agr+ and Agr2 strains with the saeR : : Tn551 mutant (Giraudo et al., 1994), complemented with pRN7143, which contains a Pbla : : saeRS transcriptional fusion, without induction of the Pbla promoter. As can be seen, spa is more strongly expressed in an sae agr double mutant than in a single sae mutant, and the same effect has been reported for an agr mutant (Giraudo et al., 1997). Furthermore, the saeRS clone can complement the sae mutant but not an agr mutant or a double mutant for spa repression; full down-regulation is seen only when both determinants are present. Similarly, sspA is not detectably activated in either of the single mutants or in the double, and is detectably expressed only in the Agr+ Sae2 mutant strain complemented by the saeRS clone. Since both regulatory determinants are individually required for each of these genes, sae is epistatic to agr as well as being downstream; if sae were purely downstream of agr, it would fully complement the effect of any agr mutant. Note that the upstream region of the sae locus is intact in the saeR : : Tn551 mutant and, as shown below, is induced by the sae two-component signal transduction system.
Effect of agr on sae transcription
Fig. 2. Northern blot analysis of the agr–sae interaction. Wholecell RNA prepared as described by Kornblum et al. (1988) was separated on formamide/agarose and blot-hybridized with the indicated probes. (a) Zero and 5 h (post-exponential phase) samples from RN6734 (Agr+ Sae+), RN7206 (Agr” Sae+), RN9808 (Agr+ Sae”) or RN9809 (Agr” Sae”) were hybridized with 32P-labelled hla and RNAIII probes, and the blots were analysed with a phosphorimager. (b) Strains RN9808 and RN9809, containing pI524, either with (+) or without (”) a second plasmid pRN7143, containing a Pbla : : saeRS fusion, were grown in CYGP broth to a cell density of 26109 ml”1 and samples were taken for the preparation and analysis of whole-cell RNA as above. Blots were hybridized with sspA (upper panel) or spa probes (lower panel). 2712
An analysis of sae transcription in an Agr+ strain (RN6734) through time is shown in Fig. 3(a). As can be seen, there is clearly a switch in the transcription pattern immediately after the onset of RNAIII synthesis, in that a 2?1 kb transcript (A) disappears and two larger ones (B and C) as well as a smaller one (D, which is not shown in this blot) appear. With the agr-null strain (RN7206), the 2?1 kb transcript is made at a diminishing rate throughout growth but at a much lower level, and the larger transcripts are hardly detectable. Similarly, in a sarA mutant, the larger transcripts are barely detectable and the 2?1 kb species behaves as in the wild-type strain. To determine whether RNAIII is responsible for the difference between the Agr+ and Agr2 strains, we analysed an agr-null strain complemented by pRN6848, which contains a transcriptional fusion of RNAIII to the inducible staphylococcal blactamase promoter, Pbla. As shown in Fig. 3(b), the upstream sae transcripts, B and C, appear following the induction of RNAIII in this strain. It must be pointed out, however, that variations in the sae transcription pattern occur in different strains and under differing growth conditions, such as under different conditions of aeration and with different batches of medium. For example, transcript C is sometimes seen throughout growth and in some experiments a fifth transcript, X, smaller than A, appears. An example of this is seen with the sB mutant strain in Fig. 6. Under all conditions, however, the switch Microbiology 149
agr–sae interactions in Staphylococcus aureus
Fig. 3. (a) Time course of sae expression in different strains. RN6734 (wild-type), RN7206 (agr-null) or RN9388 (SarA”) were grown in CYGP broth without glucose and sampled at the indicated times for the preparation of whole-cell RNA. RNA samples were blot-hybridized with either an saeS or an RNAIII probe and blots were analysed with a phosphorimager. (b) Effect of RNAIII induction on the expression of sae (upper panel), srrAB (middle panel) and spa (lower panel). Cultures of the agr-null strain RN7206 containing pRN6848 (Pbla : : RNAIII transcriptional fusion) were grown to earlyexponential phase (~108 cells ml”1) and then incubated for an additional 2 h with or without the b-lactamase inducer carboxyphenylbenzyl amino penicillanic acid (CBAP) at 5 mg ml”1. RNA samples were then prepared and analysed by Northern blot hybridization with the indicated probes. wt, Native RNAIII; m, mutant RNAIII with KpnI site replacing the terminator loop; v, vector without Pbla : : RNAIII fusion.
from A to B and the appearance of transcript D are RNAIII-dependent. Note that sae induction is weaker with an RNAIII mutant in which the terminator loop sequence has been replaced with a KpnI site (m), and is not seen with the vector alone (v) or without induction of the Pbla promoter. In contrast, spa and an unrelated response regulator, srrA (Yarwood et al., 2001), are down-regulated by RNAIII, even without induction (Fig. 3b). It is concluded that RNAIII (and not some other agr component) is required for sae activation but sae is not required for agr activation. Thus, sae is downstream from agr in the exoprotein activation pathway, even though RNAIII also acts independently of sae in the regulation of several target genes. The sae locus It is clear from these blots that the sae locus is larger and more complex than originally envisioned by Nagel and coworkers (Giraudo et al., 1999). Analysis of the sae transcription pattern at two different time points, T=1 h (representing early-exponential phase) and T=5 h (representing post-exponential phase), using different probes is shown in Fig. 4(b, c). Henceforth, the 2?1 kb sae transcript is referred to as A, the 2?6 kb sae transcript is referred to as B, http://mic.sgmjournals.org
the 3?1 kb sae transcript is referred to as C and the 0?5 kb sae transcript is referred to as D. These blots show that sae transcripts A, B and C all terminate at or near the end of saeS, and therefore have different 59 ends. The fourth transcript, D, is seen only with the upstream probe, P, and is therefore homologous to a region between the 59 ends of B and C. The directionality of this transcript is not known presently. One possibility is that B and C are transcribed from two different promoters and that D is transcribed independently from a third. Another possibility is that C is processed to give B+D. Transcript C includes two ORFs, of 146 and 157 codons, 59 to saeR, of which the latter is within B. Since the two upstream ORFs are within the sae operon, they are likely to be important for sae function and are here designated saeP and saeQ, respectively. There is a strong potential translational start within saeQ leading to a possible C-terminal protein, SaeQ9. Additionally, the potential secondary structure of the saeR transcript suggests that the translational start of SaeR is occluded, that the C-terminal end of the saeQ reading frame overlaps with the saeR start, and therefore that saeQ would have to be translated in order to permit translation of saeR. The predicted product of saeP has no significant match in the protein database, whereas that of saeQ appears to be a membrane protein that is closely related to a variety of 2713
R. P. Novick and D. Jiang
Fig. 4. Northern blots of sae transcripts. (a) Map of the sae locus. (b, c) Whole-cell RNA was prepared by the method of Kornblum et al. (1988), separated on formamide/agarose and blot-hybridized with the indicated probes. Probes were prepared by PCR using [32P]dATP. The probe ‘S’ samples were duplicated and exchanged to provide size comparisons. B, csbB probe; P, saeP probe; Q, saeQ probe; R, saeR probe; S, saeS probe.
transporters, especially an oligopeptide permease (OppA) of Bacillus subtilis. Experiments are in progress to determine whether these two have any role in sae function. sae autoregulation Examination of the transcription pattern seen with the saeR : : Tn551 mutation (Fig. 5, left-hand side) shows that transcript A is present (indicated as A*), is longer owing to the inserted transposon and its presence is prolonged
through the post-exponential phase, suggesting that it may be autorepressed by native SaeR. Furthermore, the upstream transcripts are absent (lower panel), suggesting that these may be autoinduced by SaeR. As expected, saeRS, cloned under Pbla control, restores the upstream transcripts in the saeR mutant (not shown). The right-hand part of Fig. 5, in which RNA prepared from the agr-null, the wild-type and the saeR : : Tn551 strains was blotted with a combination of upstream probes P and Q (Fig. 4a), demonstrates both the agr requirement and the saeR requirement for the expression Fig. 5. sae autoregulation. Left-hand side, time course of saeR expression in strain RN9808 (saeR : : Tn551). RNA samples prepared from hourly time points were blot-hybridized with an saeR probe (see R Fig. 4) or with an RNAIII probe. Note that the saeR transcript is greatly elongated owing to the insertion of the 5?2 kb transposon. Note that the upstream transcripts B and C are not present in the lower half of the left panel. Right-hand side, whole-cell RNA prepared from 2 and 5 h samples of cultures of RN7206 (Agr”), RN6734 (wild-type) and RN9808 (Sae”) were blothybridized with a combined probe specific for saeP and saeQ (see Fig. 4).
2714
Microbiology 149
agr–sae interactions in Staphylococcus aureus
of the upstream transcripts B, C and D. This result confirms the autoinduction of these transcripts and the cooperation between sae and agr for their activation. Effects of sB and rsbU The alternative sigma factor sB has an important role in exoprotein gene regulation, is generally antagonistic to agr and is essentially inactive in strains of the NCTC 8325 lineage owing to an 11 bp deletion in rsbU (Kullik et al., 1998), which is required for sB activation. As shown in Fig. 6, replacement of the defective rsbU with a functional copy of the gene (Nicholas et al., 1999) results in considerable attenuation of the sae transcripts, but does not eliminate the transition. Moreover, inactivation of the sB gene itself appears to increase sae expression in comparison to the wild-type (RsbU2). Also, Fig. 6 shows a direct comparison of the sizes and levels of the sae transcripts seen with different strains at T=3 h.
usual switch in transcription pattern occurs at T=2 h but as soon as the pH drops below 6, at T=4 h, sae transcription is turned off. We have observed independently that TSST-1 and other agr-regulated exoproteins, previously considered to be catabolite repressed (Hallis et al., 1991; Iandolo & Shafer, 1977; Coleman, 1983), are produced in the presence of glucose but are not produced below pH 6 (B. Weinrick, H. F. Ross & R. P. Novick, unpublished data). This result suggests that sae may mediate the effects of a moderate decline in pH and that a considerable proportion of the apparent catabolite repression of exoprotein synthesis may actually be a pH effect. Similarly, as seen in the NaCl and SBCL blots, both 1 M NaCl and SBCL eliminate the temporal switch in sae transcription, consistent with their
Effects of environmental stimuli It has been observed by several investigators that certain environmental stimuli profoundly affect the expression of certain exoprotein genes through sB and SarA independently of agr (Chan & Foster, 1998a, b; Chan et al., 1998; Cheung et al., 1999; Cheung & Zhang, 2002). Accordingly, we analysed the transcription pattern of sae under the influence of certain environmental stimuli. Fig. 7(a) shows a series of Northern blots of whole-cell RNA samples prepared during growth in CYGP broth with the addition of 28 mM glucose, 1 M NaCl or subinhibitory clindamycin (SBCL). In cultures of this type grown with 28 mM glucose, the glucose is used up by the beginning of the stationary phase, by which time the pH has fallen to 5–5?5 (R. P. Novick & D. Jiang, unpublished data). As can be seen in the glucose panel, in which pH was monitored, the
Fig. 6. sae transcripts in different mutant strains. RNA samples prepared at the indicated time points were analysed by Northern blot using the saeS probe (S). Sig”, RN9375; Rsb+, RN9360; Sar”, RN9388; Sae”, RN9808; Agr”, RN7206; wt, RN6734. http://mic.sgmjournals.org
Fig. 7. Effect of external stimuli on sae transcription patterns. (a) RNA samples were prepared from RN6734 (Agr+ Sae+) cultures and analysed as in Fig. 4. Gluc, 28 mM glucose; NaCl, 1 M NaCl; SBCL, 0?02 mg clindamycin ml”1. Probe S (see Fig. 4a) was used. Note that glucose does not block induction of the B (2?6) and C (3?1 kb) sae transcripts; rather, these disappear as soon as the pH drops below 6. The other cultures were grown without glucose. (b) RNA samples were prepared from cultures of RN7206 (agr-null) containing pRN6848 (Pbla : : RNAIII fusion) that had been incubated for 2 h with the b-lactamase inducer CBAP, for 4 h with SBCL, with both or with neither. Samples were blot-hybridized with an saeS probe (S). 2715
R. P. Novick and D. Jiang
observed effects on overall exoprotein synthesis (Chan & Foster, 1998a; Herbert et al., 2001). Since the experiments were performed with an Agr+ strain, and since these stimuli do not affect agr activation, it is clear that the observed effects override the agr induction of the sae switch. This was confirmed for SBCL in an experiment with the Pbla : : RNAIII fusion in an agr-null background. As can be seen in Fig. 7(b), SBCL prevented the switch despite the induction of RNAIII. Note that, even without induction in this strain, transcript A is not detectable and there is a weak band representing transcript B. This seems inconsistent with results shown in Fig. 3 and is probably owing to a difference in growth conditions and the earlier time at which the samples shown in Fig. 3 were collected.
DISCUSSION In this report, we have shown that sae is a key element in the regulatory network that governs the expression of exoprotein (and very likely other) genes. sae affects the production of a variety of exoproteins throughout the growth cycle and it acts at the level of transcription. It does not, however, affect the transcription of any of the other known regulatory genes, including agr, sB and sarA, whereas these genes all affect the level of transcription of sae, placing sae downstream of all three in the regulatory network. However, no regulatory target for sB or sarA has been identified within the sae locus, suggesting that sB and sarA affect sae transcription indirectly (for agr, no regulatory target has yet been identified). The sae transcription pattern is complex and undergoes a critical change during the growth cycle. This change involves the disappearance of a 2?1 kb transcript (A) that is present from the outset and the appearance of three new ones, of ~0?5 kb (D), 2?6 kb (B) and 3?1 kb (C), coincident with the onset of agr RNAIII synthesis. Partial confirmation of this has recently been reported by Giraudo et al. (2003). The new transcripts contain two additional reading frames, upstream of saeR, here designated saeP and saeQ, which are likely to be translated. The transcriptional switch is effected by sae, indicating that the locus is autoregulated. It is not affected by sB, but is blocked in agr and sarA mutants. Since SarA enhances RNAIII production, the effects of a sarA mutation on sae may be related to this. Whether other regulatory determinants also affect the sae switch is presently under investigation. The sae transcription pattern suggests that the sae locus is more complex than originally envisioned and suggests that the upstream ORFs P and Q, or the transcripts B, C and D may play a role in the regulation by sae of at least some of the exoprotein genes. Other genes may be regulated by the sae two-component system, consisting of SaeR and S, alone. The potentially different roles of the sae upstream and downstream regions in the regulation of different exoprotein genes may explain the different classes of exoproteins in the exoprotein profiles in Fig. 1, and may also explain the 2716
paradox of sae appearing to be both epistatic to and downstream of RNAIII. Activation of the sae system can be envisioned as starting (in vitro) with the activation of SaeS by an unknown ligand, possibly external, followed by the activation of SaeR, presumably by phosphorylation, though de-phosphorylation is certainly possible. Somewhat later, in mid-exponential phase in vitro, there is a critical regulatory transition in which agr–RNAIII, in conjunction with activated SaeR (or, much less likely, SaeS), and possibly other regulatory elements, induces the three upstream transcripts, leading to production of SaeP and SaeQ. Concomitantly with induction of the upstream promoters, SaeR down-regulates (autorepresses) transcript A. Since transcripts B and C read through saeRS, the continuing transcription of SaeR is ensured. Translation of saeQ, however, is likely to be required for translation of saeR, and would therefore be an important feature of the sae autoregulation mechanism. Thus, the key regulatory transition must be a function of the upstream transcripts, presumably through SaeP and SaeQ, though possibly through an RNA-mediated effect. The alternative possibility that SaeR is the sole effector of saemediated regulation and that the upstream transcripts/ products affect the production or activity of SaeR has not been ruled out. Remarkably, the switch in sae transcription is blocked by diverse environmental signals, including 1 M NaCl, pH below 6 and SBCL. These stimuli have been shown to act downstream of agr and not through it; it is not presently known, however, whether they act directly or through other regulatory genes. Thus, sae may be a key intracellular coordinator of the agr quorum-sensing system with a variety of environmental signals that are well known to have profound effects on exoprotein synthesis (Chan & Foster, 1998a; Lindsay & Foster, 1999). It is concluded that, although the overall regulatory network governing the staphylococcal virulon seems to involve reciprocal interactions among various regulatory determinants (Novick, 2003), a central linear pathway in which saeRS is directly downstream from agr is beginning to take shape. At this stage, critical unknowns are the putative ligand for SaeS, and the mechanisms by which RNAIII induces and environmental stimuli block the mid-exponential regulatory transition responsible for activation of the sae system. Future studies will address these mechanisms and will also investigate the questions of translational and posttranslational regulation of sae, the activity of SaeR and the role of its phosphorylation, and the regulatory role(s) of the upstream sae region.
REFERENCES Arvidson, S. & Tegmark, K. (2001). Regulation of virulence
determinants in Staphylococcus aureus. Int J Med Microbiol 291, 159–170. Microbiology 149
agr–sae interactions in Staphylococcus aureus Chan, P. F. & Foster, S. J. (1998a). The role of environmental factors in the regulation of virulence-determinant expression in Staphylococcus aureus 8325-4. Microbiology 144, 2469–2479. Chan, P. F. & Foster, S. J. (1998b). Role of SarA in virulence
determinant production and environmental signal transduction in Staphylococcus aureus. J Bacteriol 180, 6232–6241. Chan, P. F., Foster, S. J., Ingham, E. & Clements, M. O. (1998). The Staphylococcus aureus alternative sigma factor sB controls the
Iandolo, J. J. & Shafer, W. M. (1977). Regulation of staphylococcal enterotoxin B. Infect Immun 16, 610–616. Kornblum, J. S., Projan, S. J., Moghazeh, S. L. & Novick, R. P. (1988). A rapid method to quantitate non-labeled RNA species in
bacterial cells. Gene 63, 75–85. Kullik, I., Giachino, P. & Fuchs, T. (1998). Deletion of the alternative sigma factor sB in Staphylococcus aureus reveals its function as a
global regulator of virulence genes. J Bacteriol 180, 4814–4820.
environmental stress response but not starvation survival or pathogenicity in a mouse abscess model. J Bacteriol 180, 6082–6089.
Laemmli, U. K. (1970). Cleavage of structural proteins during the
Cheung, A. L. & Zhang, G. (2002). Global regulation of virulence
Lindsay, J. A. & Foster, S. J. (1999). Interactive regulatory pathways
determinants in Staphylococcus aureus by the SarA protein family. Front Biosci 7, d1825–1842. Cheung, A. L., Coomey, J. M., Butler, C. A., Projan, S. J. & Fischetti, V. A. (1992). Regulation of exoprotein expression in Staphylococcus
aureus by a locus (sar) distinct from agr. Proc Natl Acad Sci U S A 89, 6462–6466. Cheung, A. L., Chien, Y.-T. & Bayer, A. S. (1999). Hyperproduction
assembly of the head of bacteriophage T4. Nature 227, 680–685. control virulence determinant production and stability in response to environmental conditions in Staphylococcus aureus. Mol Gen Genet 262, 323–331. Nicholas, R. O., Li, T., McDevitt, D., Marra, A., Sucoloski, S., Demarsh, P. L. & Gentry, D. R. (1999). Isolation and characterization
of a sigB deletion mutant of Staphylococcus aureus. Infect Immun 67, 3667–3669.
of alpha-hemolysin in a sigB mutant is associated with elevated SarA expression in Staphylococcus aureus. Infect Immun 67, 1331–1337.
Novick, R. P. (1991). Genetic systems in staphylococci. Methods
Coleman, G. (1983). The effect of glucose on the differential rates of extracellular protein and a-toxin formation by Staphylococcus aureus
Novick, R. P. (2003). Autoinduction and signal transduction in the
Enzymol 204, 587–636.
(Wood 46). Arch Microbiol 134, 208–211.
regulation of staphylococcal virulence. Mol Microbiol 48, 1429– 1449.
Garvis, S., Mei, J. M., Ruiz-Albert, J. & Holden, D. W. (2002).
Novick, R. P. & Richmond, M. H. (1965). Nature and interactions
Staphylococcus aureus svrA: a gene required for virulence and expression of the agr locus. Microbiology 148, 3235–3243. Giraudo, A. T., Raspanti, C. G., Calzolari, A. & Nagel, R. (1994).
Characterization of a Tn551-mutant of Staphylococcus aureus defective in the production of several exoproteins. Can J Microbiol 40, 677–681. Giraudo, A. T., Rampone, H., Calzolari, A. & Nagel, R. (1996).
Phenotypic characterization and virulence of a sae2 agr2 mutant of Staphylococcus aureus. Can J Microbiol 42, 120–123. Giraudo, A. T., Cheung, A. L. & Nagel, R. (1997). The sae locus of
of the genetic elements governing penicillinase synthesis in Staphylococcus aureus. J Bacteriol 90, 467–480. Novick, R. P., Ross, H. F., Projan, S. J., Kornblum, J., Kreiswirth, B. & Moghazeh, S. (1993). Synthesis of staphylococcal virulence
factors is controlled by a regulatory RNA molecule. EMBO J 12, 3967–3975. Ross, H. F. & Novick, R. P. (2001). sae is a key intermediary in the
activation by agr of the staphylococcal virulon. In Cell–Cell Communication. Edited by S. Winans & B. Bassler. Snowbird, UT: American Society for Microbiology.
Staphylococcus aureus controls exoprotein synthesis at the transcriptional level. Arch Microbiol 168, 53–58.
Vandenesch, F., Kornblum, J. & Novick, R. P. (1991). A temporal
Giraudo, A. T., Calzolari, A., Cataldi, A. A., Bogni, C. & Nagel, R. (1999). The sae locus of Staphylococcus aureus encodes a two-
signal, independent of agr, is required for hla but not for spa transcription in Staphylococcus aureus. J Bacteriol 173, 6313–6320.
component regulatory system. FEMS Microbiol Lett 177, 15–22.
Vojtov, N., Ross, H. F. & Novick, R. P. (2002). Global repression of
Giraudo, A. T., Mansilla, C., Chan, A., Raspanti, C. & Nagel, R. (2003). Studies on the expression of regulatory locus sae in
exotoxin synthesis by staphylococcal superantigens. Proc Natl Acad Sci U S A 99, 10102–10107.
Staphylococcus aureus. Curr Microbiol 46, 246–250.
Vuong, C., Gotz, F. & Otto, M. (2000). Construction and
Hallis, B. A., Thurston, C. F. & Mason, J. R. (1991). Glucose control
characterization of an agr deletion mutant of Staphylococcus epidermidis. Infect Immun 68, 1048–1053.
of staphylococcal enterotoxin A synthesis and location is mediated by cyclic AMP. FEMS Microbiol Lett 64, 247–251. Herbert, S., Barry, P. & Novick, R. P. (2001). Subinhibitory
clindamycin differentially inhibits transcription of exoprotein genes in Staphylococcus aureus. Infect Immun 69, 2996–3003.
http://mic.sgmjournals.org
Yarwood, J. M., McCormick, J. K. & Schlievert , P. M. (2001).
Identification of a novel two-component regulatory system that acts in global regulation of virulence factors of Staphylococcus aureus. J Bacteriol 183, 1113–1123.
2717