A life âannuityâ based on individual's account balance and cohort (unisex) life expectancy at retirement. - NDC â annuities indexed to real per capita wage ...
THE SWEDISH ANNUITY MARKET: WHERE IT IS AND WHERE IT’S HEADED Edward Palmer Uppsala University & Swedish Social Insurance Agency 1
Overview of the Talk n n n
n
n n n
Swedish Pension Landscape D t Determinants i t off th the Demand D d for f Annuities A iti Development of the Financial Market and Household Financial Investment Sophistication Pension Benefit Profile among g Today’s y Pensioners The Market for Annuities The Changing Profile of Products and Risk Th Future The F t Direction Di ti off the th Swedish S di h Market M k t 2
Overview of the Pension Landscape in Sweden
3
Reform of the Public System – 1994 Legislation n
Created two autonomous, mandatory, earningsrelated, l t d defined d fi d contribution t ib ti old ld age pension i schemes: - Non-financial defined contribution (NDC) payas you go as-you-go - Financial defined contribution (FDC)
n
Disability and survivor benefits → general budget
n
Guarantee → general budget
n
Non-contributory rights → general budget
NDC and FDC – The General Set-up p n
Individual contributions are noted on individual accounts. - NDC – contributions pay for benefits of current pensioners - FDC – contributions t ib ti are prefunded f d d
n
Accounts earn a rate of return: - NDC – based on covered per capita wage & covered labor force growth - FDC – financial market rate of return
n
n
Retirement from any y age g after the minimum age g (61). ( ) A life “annuity” based on individual’s account balance and cohort (unisex) life expectancy at retirement. - NDC – annuities indexed to real per capita wage growth and inflation. inflation - FDC – adopts the Danish/Swedish method with a guarantee & a bonus, which resembles indexation; unit-link alternative.
5
Conversion of Occupational S h Schemes to t FDC n
n
n
n
Private blue-collar blue collar employees employees, 1996 (industry, commerce, etc.) - 43 % of employees County council and municipal employees, 1998 (including medical medical, educational educational, care professionals) - 20 % of employees E l Employees off the th S Swedish di h state, t t 2003 (including higher education, social insurance) - 6 % off employees l Private white-collar workers, 2007 - 16.5 % of employees 6
Post-reform Overview
Occupational Benefit Ceiling
Occupational Benefits
Pension
Ceiling for Public Benefit e e t
Earnings-related g Benefits: Public Mandatory NDC+ FDC
Guarantee ”top-up” - Means tested vis only NDC & FDC
Life earnings
Post-reform Post reform contribution rates n
Public Earnings Earnings-related related System Universal, mandatory system that covers earnings up to a ceiling of all employees and self-employed. Ceiling (2008) 360 000 SEK or 60 000 USD.
- NDC C – 16 % - FDC – 2.5 % n
Occupational Earnings-related Schemes
n
– 3.5-4.5 % (under ceiling for public schemes; more over) Cover ca 90 % of all employees. - FDC: Supplement below public benefit ceiling - FDC: Whole Wh l benefit b fit above b ceiling, ili private i t sector t workers k - FDC, NDB: Above ceiling, public sector workers
n
I di id l voluntary Individual l t insurance i
Replacement Rates
Determinants D t i t off th the D Demand d for f Annuities
10
Individual Voluntary Insurance and Annuitization of Savings – Constraints on Demand
n
n
n n
n n
Extensive public + occupational commitment – pensions and health care Inflated perception of the sufficiency of public + occupational coverage g Desire to remain liquid to leave bequests Poor understanding of the potential advantages of annuities Time preference for consumption in the present Absence of products which cover the elder elderly 11
Recent Structural Changes of Importance n
n n n
n
1988 – Legislation abolishing the widows’ benefit f persons b for born 1945 and d llater t 1993 – Unit-linked insurance introduced 1994 - Individual retirement saving (IRS) accounts 1994 – Legislation of NDC & FCD public schemes -- Put a limit on the public commitment -- Increased financial market literacy 1995 – Tax deductible amount halved (9 000 → 4 500 USD) 12
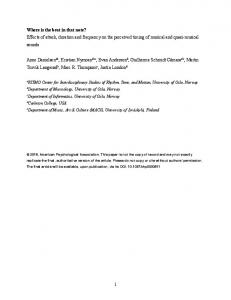
Figure 1. Persons utilizing a tax deduction for voluntary insurance. Percent of the population 20-64, 1980-2005. 50 40 30
Women
20
Men
10 10 0 1980 1982 1984 1986 1988 1990 1992 1994 1996 1998 2000 2002 2004
Year 13
Development of the Financial Market and Household Financial I Investment t t Sophistication S hi ti ti
14
Financial Market Development n
n
n
Comprehensive financial market restrictions were lifted lift d and d the th market k t was “free” “f ” by b the th mid-1980s. From the mid-1980s the market grew in scope and depth. By the mid-1990s over half of all Swedes 2070 y years old had invested money y directly y in the stock-market or in market funds. 15
Table 1. The Financial Portfolio of Households 1980 Per cent Billions of of total SEK assets Individual insurance 34 9 % Equities 36 10 % Mutual funds ** ** Bank deposits 182 50 % B d Bonds 43 12 % 12 % Currency 28 8 % Other 44 12 % Total financial assets assets 367 100 % 100 % All financial assets as a percent of GDP 67 %
Sources. Palmer 2008.
2005 Per cent Billions of of total SEK assets 657 26 % 565 22 % 484 19 % 619 25 % 107 4% 4 % 87 3 % 2 0 %
2521
100 % 100 %
94 %
16
Pension Benefit Profile among Today´ss Pensioners Today
17
18
19
Voluntary Pension Benefits among Today´s Pensioners n
n
n
n n
Pensioners 55-59 - No o public. pub c Occupational Occupat o a o or p private ate voluntary, o u ta y, seldom both Pensioners 60-64 - Small number of public recipients. Mainly occupational or private voluntary voluntary, seldom both both, Pensioners 65-69 - Normal public + occupational & large voluntary Pensioners 70+ - Normal public + occupational & small voluntary 20
The Market for Annuities
21
Structure of the Market n
n n
n
44 insurance companies: p 95 % life and pensions; p ; 5 % is health and accident. Over 800 registered investment funds Seven insurance companies - hold 97 % of all insurance assets - receive 95 % of premium payments - manage 45 % of the mandatory public FDC schemes accounts T Two additional dditi l insurance i companies i specialized i li d in management of the white-collar and public employee l occupational ti l schemes, h respectively. ti l 22
Table 4. Assets and premium payments to occupational, 4 Assets and premium payments to occupational individual voluntary and PPM plans, 2006 Assets Premiums All occupational and individual voluntary su a ce, b o s o 2 2700 93* insurance, billions of 193 kronor Percent of GDP 80 % 6.8 %* PPM 267 26 Percent of GDP 9 % 0.9 % * Voluntary individual insurance accounted for about 15 %. 15 %. Source. Palmer (2008), based on data from the PPM and Financial Supervisory Authority 23
Ch i Profile Changing P fil off Products P d t andd Risk
24
Overview of products by category of provision Lump‐sums Phased Phased withdrawals Annuities
PPM No No
Occupational No Yes
Individual Yes Yes
Yes
Yes
Yes
25
Forms of Insurance in the Swedish Market and Risk Bearing Forms of Insurance in the Swedish Market and Risk Bearing Type of plan
Who bears the investment Who bears the longevity risk?
risk?
1. Financial defined benefit
The insurer
2. Financial defined
The insurer
contribution a. Accumulation phase a Accumulation phase
‐ Traditional
The insured
The insured
‐ Unit‐linked
The insured
The insured
b. Payout phase
The insured
The insured
‐ Traditional
The insured
The insured
‐ Unit‐linked
The insured
The insured
26
The Future Direction of the Swedish Market
27
What’ss Holding Back Annuity Demand? What n
n
n
n
Annuitization is rational from age 75-80, e.g. Milevsky (2001) (2001), but there are no products offered with this perspective. P Presently, l Swedes S d have h a very myopic i view i off insurance and utilize predominantly 5-10 year withdrawals ithd l when h they th can. What will the public care commitment be in the future? Will income inequality & demographic pressure on public finances create private care insurance for disability in old age? Elder elderly y Swedes,, especially p y single g women, are bound to be relatively poor. A reason to shirt consumption/annuity patterns?
The End
29
Coverage Rules – Mandatory E i Earnings-related l t d NDC & FDC n n
n
n
n n
Minimum Mi i age for f coverage 16 Mandatory coverage of all income from employment and/or self-employment, above a minimum threshold and up to a ceiling. Minimum threshold: Annual income above minimum for tax declaration ((~1 000 Euro)) Ceiling: Wage indexed ceiling on Annual income of (2009) ~400 400 000 SEK (~36 ( 36 000 Euro) Minimum pension age – 61 years No upper age limit for retirement 30