In Silico Biology 2(3):415-426, 2002
The system architecture of the BioPath system* Michael Forster1, Andreas Pick1, Marcus Raitner1, Falk Schreiber2 and Franz J. Brandenburg1
1
Fakultät für Mathematik und Informatik, Universität Passau, 94030 Passau, Germany E-mail:
[email protected] 2
School of Information Technologies, University of Sydney, Madsen Building (F09), Sydney, NSW 2006, Australia *Supported in part by the German Ministry of Education and Research (BMBF)
Edited by E. Wingender; received November 30, 2001; revised and accepted January 28, 2002 ; published April 18, 2002
Abstract BioPath is a prototype system for the interactive exploration of biochemical pathways. It has been developed as an electronic version of the famous Boehringer Biochemical Pathways map and offers various ways to access information on substances and pathways and to navigate through pathways. This paper describes the main features and the software architecture of BioPath. The companion paper [Schreiber, 2002] focuses on the advanced visualization incorporated into BioPath. Key words: biochemical pathways, metabolic pathways, visualization, exploration
Introduction Cellular processes form large and complex nets such as gene regulatory networks, signal transduction pathways, and biochemical pathways. The understanding of these nets is important, since they help to explain mechanisms of life. Today the knowledge of biochemical pathways is more detailed and structured than the information about gene regulation and signal transduction. The data on biochemical pathways is available in printed and in electronic form. There are excellent books [Stryer, 1988; Michal, 1999], the Boehringer map on biochemical pathways [Michal, 1993], online databases such as KEGG [Kanehisha and Goto, 2000], UM-BDD [Ellis et al., 2000], and WIT/MPW [Selkov et al., 1998], and other commercial databases. The net of biochemical reactions is large and very complex, and far from being complete. Even small portions are hard to read and understand, in particular for beginners. Biochemists are familiar with visual representations of structural formulas, relations, and biochemical pathways. Consequently, most information systems on biochemical reactions offer visualizations of pathways. However, the focus of these systems is providing data of high detail and actuality for experts. High quality visualization and a convenient interactive navigation through pathways seem less important. This scenario is hard for beginners. They need an information system which supports an easy exploration of the biochemical pathways net, where they can
navigate from overview diagrams to detailed data, and back. Such a system must support different levels of abstraction from high-level views to detailed reaction mechanisms. Moreover, the system should support all relevant user requests. This includes requests on substances, pathways between two substances and even parts of the entire net, which must be computed and visualized for the response. Such a system would be a great help, both for beginners studying pathways, and for scientists, who can check and interpret their research results in the context of the whole net of pathways. There are many databases on biochemical reactions, which have been built with much effort and high cost. Less work has been spent on the development of mechanisms for the interactive exploration of biochemical pathways. A deficit of many systems is the inability to produce images of reactions and pathways as a response to the users' requests. ExPASy [Appel et al., 1994] has scanned pictures of the Boehringer map and provides links between the occurrences of enzymes in the diagrams and additional information, but no further navigation like abstract overview diagrams. Systems such as KEGG, WIT/MPW, and UM-BBD use links between listings of pathway classes (e. g. carbohydrate metabolism, lipid metabolism) and single pathway diagrams. Sometimes also clickable overview pictures are provided, but they are restricted to only two abstraction levels (overview and pathway diagram) without further refinement of reactions. Moreover, these systems do not support the visualization of arbitrary reaction nets because they use static visualization. The drawings of biochemical pathways are produced in advance and represent the knowledge at the time of generation. For advanced features such as the computation of reaction nets between given substances or arbitrary abstraction levels a dynamic visualization is essential. There are already some information systems and algorithms for the dynamic visualization of reaction networks. They combine standard graph-drawing algorithms [Karp and Paley, 1994; Becker and Rojas, 2001] or use labeling techniques, where the enzymes and co-substances are considered as edge labels and placed separately (PathDB). However these algorithms do not satisfy the common criteria for good visualizations of biochemical pathways. See [Schreiber, 2002] for a discussion. BioPath uses a model for the comprehensive representation of hierarchically structured reaction nets, which supports several levels of detail for reactions ranging from single reactions to complex pathways. Based on the model and the data from the Biochemical Pathways map and the atlas, BioPath is an online exploration tool for biochemical pathways. It is a web application that demonstrates the flexibility of the model and the quality of the visualization from a particular layout algorithm. It explores all the advantages of an electronic version over a printed one, such as an update of data, and interactive browsing through biochemical pathways. Moreover, the system can deal with incomplete and fragmented information. The ability to dynamically browse through biochemical reaction nets and a convenient search for information is useful in all applications.
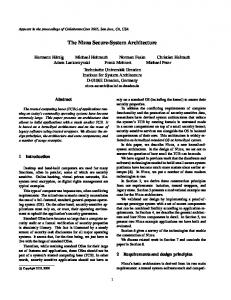
System architecture Overview BioPath is a classical 3-tier web application. See Figure 1 for an architecture overview. Figure 1: The BioPath system architecture.
Client Tier Users access the BioPath service using a web browser like Netscape Navigator or Microsoft Internet Explorer. They enter their queries into HTML forms. The browser passes the query data to the BioPath application server by sending a HTTP request. When the application server has finished query processing, the browser displays the returned query results. Clicking on pathway images or on internal links triggers another HTTP request. Application Tier The main part of BioPath is the application server. It accepts queries, retrieves the corresponding data from the database, computes the result and delivers it to the client tier. Data Storage Tier The data of BioPath is stored in a relational database management system (currently IBM DB2) using an object oriented schema. The application server The heart of the BioPath system is the application server. It consists of several components, some of which are implemented in Java, some in C++ for execution speed. The communication between the Java and C++ components is done via the Java Native Interface (JNI). The application server has been developed mainly on Linux and Windows in an operating system independent manner, and therefore should be easily portable to any platform for which Java and a recent C++ compiler are available. Web Interface The web interface is responsible for the communication with the client tier. It receives the query in terms of a HTTP request with associated parameters. It parses the request and triggers the corresponding functionality of the query engine which processes the query and returns the result as a graph. The web interface uses the layout and graphics engine to transform the graph into a picture and delivers it to the client as a GIF or PNG image with a corresponding image map and a HTML page. The web interface is implemented in Java based on the Java Servlet Technology. Query Engine The query engine executes the user queries. It extracts the required information from the database and builds a pathway, represented as a graph with attributed nodes and edges. A description is given in the query engine section. The query engine is implemented in C++ using the "Graph Template Library" (GTL), a C++ library providing a data structure for graphs. Database Interface The communication between the query engine and the database is done via the database interface. This encapsulation simplifies adapting BioPath to other data sources. The database interface is written in C++. Layout Engine The graphs generated by the query engine do not have a geometric representation. For the display an image of the graph must be computed. As a prerequisite, coordinates for the nodes and edges must be calculated. This is done by the layout engine. In the area of graph visualization there are several general purpose algorithms for the layout of graphs [Di Battista et al., 1999]. But these algorithms are not sufficient for the particular visualization requirements of biochemical pathways [Schreiber, 2002]. Therefore a new graph layout algorithm has been developed. The layout engine is implemented in C++ using Graphlet [Himsolt, 2000], a toolkit for graph editors and graph algorithms. Graphics Engine The graphics engine generates images and image maps from the attributed graphs computed by the layout engine. It is implemented in Java using the Java interface of GTL and Graphlet.
Query engine The query engine processes the queries from the web interface, issues database queries, transforms the result and returns the answer to the web interface. Database schema The BioPath database features an elaborate schema designed by Kanne [Kanne, 2000]. It consists of about 115 entities and 70 relations. We concentrate only on the part relevant to the query process. The biochemical reactions are the main components of the database schema. Each reaction has a set of attributes including the participants, i. e., the substances involved in the reaction. These are classified into enzymes, reactants and products. Reactants and products are further classified into primary and non-primary. Primary reactants and products are used to compose pathways. Non-primary participants have a rank which specifies their relative order in the reaction and is used by the layout engine. Reaction graphs In terms of graphs a biochemical pathway is an arbitrary graph with many branches and not just a path. In BioPath each reaction and reaction net is represented as a directed graph with labeled nodes and edges. In general, a directed graph consists of a set of nodes and a set of edges, which is a binary relation. A reaction, however, is a complex relation with many reactants and products. Formally it can be described by a hyperedge or an n-ary relation. It is common practice to represent a hyperedge as a bipartite graph, which looks like a star with the distinguished reaction node as a center and the reactants, products,and enzymes as satellites, see Figure 2. Figure 2: Modeling a reaction hyperedge as a bipartite graph.
The nodes of this bipartite graph are labeled by the name of the substances, their role in the reaction (enzyme, substance or co-substance), and their rank. The edge labels include information about the occurrence of a reaction in a species. The labels are used for the generation of the image of the reaction or reaction net and are translated into associated text, colors, and layout constraints. A layout constraint describes a left-to-right or top-to-bottom relationship and means for example that an enzyme should appear to the left of the reaction arrow. Query processing There are several types of queries. A search query on substances is a standard query for information on a substance, which is passed on directly to the database. The answer is a text or a structural formula as it is stored in the database. A query on reactions and reaction nets shall return an image. Then the task of the query engine is building a reaction graph. A search-reaction query first collects all participants of the reaction from the database. For each participant the query engine creates a node and a node for the reaction itself, and labels the nodes with the name of the substance, the role and the rank. Then it adds
directed edges between the reaction node and the participant nodes. These are directed from the reactant nodes to the reaction node and from there to the product nodes. The search of a reaction net from a source substance to a target substance is finding a sequence of reactions of a predefined maximal length. In BioPath two reactions are combined, if a primary product of the first is a primary reactant of the second. This is the common notion of connectivity in such graphs. Biopath uses a recursive query to build all sequences starting from the source substance up to a predefined length. It then selects those reaching the target substance. In more detail, this query returns a collection of reactions, which are transformed into labeled graphs as described above. Nodes of primary participants are identified, if they represent the same substance. The so obtained directed graph is returned to the web interface.
Results BioPath has a convenient web-interface for user interaction. It offers several ways to explore the biochemical data: Start page The start page (Figure 3) presents general information about the BioPath project and the partners, a short introduction, a user guide and a starting point for the exploration of the biochemical data. Figure 3: Start page of BioPath.
Overview diagram The overview diagram has been derived from the overview diagram of the Biochemical Pathways atlas (Figure 4) [Michal, 1999]. It shows a selection of important biochemical pathways. All colored substances and reactions in the diagram can be clicked to receive more information. In contrast to all other images in BioPath the layout of this diagram was made manually to ensure similarity to the overview diagram of the atlas. Figure 4: The overview diagram is a starting point for exploration of the pathways.
Search substances Substances can be searched by their name or a part of it, see Figure 5. The result shows biochemical data such as structural and empirical formula, weight, enzyme classification number and charge. Additionally all reactions in which the substance participates as a reactant, a product or an enzyme are listed. Figure 6 is an example for Chlorophyll. Figure 5: Searching a substance.
Figure 6: Information about Chlorophyll.
Search pathways and reactions As shown in Figure 7, pathways can be searched by their name or a part of it. BioPath computes a graphical representation containing information like participating enzymes and substances of the reaction or pathway and also shows all pathways the reaction belongs to. As in the overview diagram, displayed substances and reactions can be clicked to receive detailed information (Figure 7 and Figure 8). Figure 7: Searching for the biosynthesis of the Side Chain of Chlorophyll a.
Figure 8: Biosynthesis of the Side Chain of Chlorophyll a.
Search reaction net The most interesting feature of BioPath is the search for a reaction net between two substances. The query panel is shown in Figure 9. BioPath searches all sequences of reactions between two substances up to a given length. Figure 10 shows the result of the query "Search the reaction net between Maltose and D-Gluconate up to length 10". Figure 9: Searching a reaction net.
Figure 10: A reaction net. This view contains structural formulas for substances. The image is automatically produced by the layout algorithm of BioPath.
Discussion Our prototype system BioPath has demonstrated the usefulness and appropriateness of the approach. However, for a broader use it needs more data and the access to other databases. The visualization components will be made available for the integration into other systems. We are working on the dynamic visualization of signal transduction pathways and gene regulatory networks.
References Appel, R. D., Bairoch, A. and Hochstrasser, D. F. (1994). A new generation of information retrieval tools for biologists: the example of the ExPASy WWW server. Trends. Biochem. Sci. 19, 258-260. Becker, M. Y. and Rojas, I. (2001). A graph layout algorithm for drawing metabolic pathways. Bioinformatics 17, 461-467. Di Battista, G., Eades, P., Tamassia, R. and Tollis, I. G. (1999). Graph Drawing: Algorithms for the Visualization of Graphs. Prentice Hall, New Jersey.
Ellis, L. B., Hershberger, C. D., and Wackett, L. P. (2000). The University of Minnesota Biocatalysis/Biodegradation Database: Microorganisms, Genomics and Prediction. Nucleic Acids Res. 28, 377- 379. Himsolt, M. (2000). Graphlet: Design and Implementation of a Graph Editor. Software - Practice and Experience 30, 1303-1324. Kanehisa, M. and Goto, S. (2000). KEGG: Kyoto Encyclopaedia of Genes and Genomes. Nucleic Acids Res. 28, 27-30. Kanne, C.-C. (2000). BioPath database scheme. Internal documentation. Karp, P. and Paley, S. (1994). Automated Drawing of Metabolic Pathways. In: Proceedings of the 3rd International Conference on Bioinformatics and Genome Research, 225-238. Michal, G. (1993). Biochemical Pathways (Poster). Third edition, Boehringer Mannheim. Michal, G. (1999). Biochemical Pathways. Spektrum Akademischer Verlag, Heidelberg. Schreiber, F. (2002). High Quality Visualization of Biochemical Pathways in BioPath. In Silico Biology 2, 0006. Selkov, Jr., E., Grechkin, Y., Mikhailova, N. and Selkov, E. (1998). MPW: The Metabolic Pathways Database. Nucleic Acids Res. 26, 43-45. Stryer, L. (1988). Biochemistry. W. H. Freeman and Company. New York.