flow field manifested itself between the two branches of the hysteresis with increasing ... lift coefficient would influence blade loading, manifesting itself in.
Kevin A. Kaupert Turbomachinery Laboratory, ETH Swiss Federal Institute of Technology, CH-8092 Zurich, Switzerland
Thomas Staubli Professor; Now at HTA Luzern, CH-6048 Horw, Switzerland.
The Unsteady Pressure Field in a High Specific Speed Centrifugal Pump Impeller— Part II: Transient Hysteresis in the Characteristic Hysteresis in a pump characteristic results from instability phenomena involving complex three dimensional flow with recirculation. The unsteady flow field on the top and bottom branches of a hysteresis loop in a high specific speed (v S 5 1.7) centrifugal pump characteristic was experimentally evaluated. A hypothesis for recirculation zones and prerotation as power dissipaters is proposed for explaining the discrepancy in the pressure and shaft power hysteresis. The experimental investigation was performed in both the rotating and stationary frame. In the rotating frame 25 miniature pressure transducers mounted in an impeller blade passage were sampled with a telemetry system. In the stationary frame a fast response probe was implemented. The changing impeller flow field manifested itself between the two branches of the hysteresis with increasing stochastic pressure fluctuations. Using this information the position, size, and strength of the impeller recirculation was quantitatively determined. Theoretically the rate of change of useful hydraulic power in the hysteresis regime during transient pump operation was found to be a function of throttling rate. Quasi-steady behavior existed for slow throttling, |df/dt| , 0.005 s 21. A second-order nonlinear dependence on the throttle rate was determined for the change of useful flow power during the commencement/cessation of the impeller recirculation.
Introduction The hysteresis in pump characteristics provides an operating regime containing complex flow field changes. Interest in this regime exists because this operational regime often has: ● ● ● ●
positive slope characteristics which can lead to system instability (Greitzer, 1981), a significant discontinuity in pump efficiency (3% for the pump investigated here), increased pressure fluctuations (Stoffel 1991), an increased danger of cavitation (Pfleiderer and Petermann, 1990).
The unsteady flow field in the flow regime of the hysteresis is influenced by transient volume flux changes within the pump introducing significant flow field changes. Exact reasons for the abrupt unsteady flow field changes lie in the complex interaction between Coriolis, inertia, viscous, and pressure forces acting on the relative flow. The v S 5 1.7 pump impeller has a relatively small outlet tip solidity s t 5 1.4 implying lesser flow guidance, greater secondary flow development, and greater susceptibility to flow recirculation zones often accompanied by characteristic discontinuities. The latter has been previously demonstrated (Hergt and Starke, 1985) with an emphasis on diffuser selection and the dip in the pump characteristic. In striving to obtain increasing efficiencies the volume flux at which these discontinuities occur may move closer to the best efficiency point (bep) (Fraser, 1982). Pump designers and users must evaluate the risks (i.e., dynamic loading, cavitation, flow induced vibrations) involved in the Contributed by the Fluids Engineering Division for publication in the JOURNAL OF FLUIDS ENGINEERING. Manuscript received by the Fluids Engineering Division April 9, 1998; revised manuscript received May 17, 1999. Associate Technical Editor: B. Schiavello.
Journal of Fluids Engineering
changing unsteady flow field caused by recirculation zones (Makay, 1980) against the cost savings in higher efficiencies. Since recirculation zones are unavoidable over the entire pump operational regime, pump manufactures must design pumps with predictable recirculation zones and a resistance (Stanmore, 1988) to the produced unsteady flow field. In aerodynamics hysteresis effects in both the steady and unsteady lift coefficients with regard to static and dynamic stall are recognized (McCroskey, 1982) on two-dimensional profiles. This is attributed to flow separation and reattachment occurring at different angles of incidence. Flow separation may also occur within the investigated impeller here also. Hysteresis in the blade lift coefficient would influence blade loading, manifesting itself in the pump characteristics. The three dimensionality, rotation, geometry, and unsteadiness of the pump flow field coupled with transient pump operational load adds to the complexity of the flow making local separation an enlightening interpretation but in an oversimplifying context.
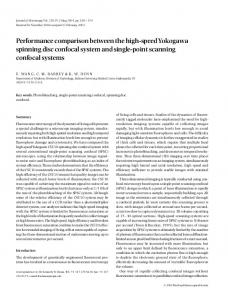
Test Facility and Instrumentation The single stage pump under investigation was designed to transport slurry inhomogeneous substances. The impeller, depicted in Fig. 1, had an outlet diameter D 2 5 324 mm and operated within a double spiral volute to minimize radial forces. Experiments were performed at a rotational speed of 750 rpm (u 2 5 12.7 m/s), having a bep volume flux of 0.196 m 3/s (f 5 0.174) and a pump head of 5.8 m (c 5 0.704). The test facility is the same as described in Part I of the article. Along with standard test rig instrumentation (Kaupert et al., 1996) devices for evaluation of the unsteady flow field were installed. In the stationary system unsteady flow field data were collected using a one hole fast response cylindrical probe. The probe was calibrated in an air free jet facility (Kupferschmied and
Copyright © 1999 by ASME
SEPTEMBER 1999, Vol. 121 / 627
Fig. 1
Test impeller and geometric specifications
Gossweiler, 1992) at the appropriate Reynolds numbers. The probe diameter at the head was 3 mm with a hole of 1 mm being 0.5 mm deep to reach the face of the shaft mounted pressure transducer. The eigenfrequency of the pressure transducer in air was near 100 kHz and was calculated to be near 20 kHz in water which was well above the frequencies of interest, a maximum of 1 kHz. The small cavity in front of the probe pressure transducer revealed no resonance problems near the frequencies of interest. Flush mounted pressure transducers at the pump inlet and outlet measured the transient pump head during throttling. Their positions were at distances of 2D 2 upstream and 2D 2 downstream of the pump. They correspond to the positions of P 1 and P 2 , respectively, for the determined pump pressure rise DP 221 . In the rotating system 25 piezoresistive pressure transducers were strategically mounted in an impeller blade passage, Fig. 2. Their location was selected to follow the path of two “wall streamlines” on the blade passage pressure side, Pressure Side Hub (PSH) and Pressure Side Shroud (PSS), and two “wall streamlines” on the blade passage suction side, Suction Side Hub (SSH) and Suction Side Shroud (SSS). Transducers were also placed along the blade suction side leading edge with the anticipation that this region undergoes interesting unsteady flow field changes in the hysteresis loop of the pump characteristic. The transducers were described in Part I of the article. As in Part I of the article measurement of unsteady quantities in the impeller frame are presented in nondimensionalised form as the unsteady pressure coefficient,
Fig. 2
Pressure transducer positions in impeller passage
˜ Cp 5
˜ Pi . 0.5 r u 22
Phase averaging of unsteady measured signals is common practice in turbomachinery applications to eliminate the part of the signal often linked to stochastic (i.e., turbulence) effects and to reduce the data size for signal interpretation of the rotational harmonics. However, the remaining signal information after phase averaging not only has the stochastic part of the signal removed but rather everything which is not periodic with the machine rotational speed such as stochastic or transient behavior. This implies a possible loss of valuable signal information in flow instability zones (i.e., recirculation) or any subharmonics (i.e., subsynchronus whirl) the signal may be providing. This is illustrated in Fig. 3 by considering a time domain signal h(t) written as
Nomenclature A 5 top branch f operating point without recirculation B 5 bottom branch f operating point with recirculation B 2 5 impeller outlet height C p 5 pressure coefficient based on absolute pressure c u1 5 impeller inlet tangential velocity, absolute c u2 5 impeller outlet tangential velocity, absolute D 1 5 impeller inlet diameter D 2 5 impeller outlet diameter D 3 5 volute tongue inlet diameter f o 5 pump shaft frequency f bp 5 blade passing frequency g 5 gravitational acceleration H 5 pump head i 5 index for ith pressure transducers K 1 5 constant throttling rate, d f /dt* K 2 5 constant, f A or f B at stability limit in hysteresis K 3 5 constant for inhomogeneous equation 628 / Vol. 121, SEPTEMBER 1999
5 5 5 5 DP 221 5 Q5 S2 5 s5 L L1 M N
t5 t* 5 T* 5 u2 5 u1 5 h5
hh 5 l5 r5
useful hydraulic power impeller leading edge length pump shaft torque rotations per minute pressure difference across pump volume flux impeller outlet area ( p D 2 B 2 ) distance along impeller leading edge (s 5 0 at hub) time time dimensionless, t/T* transition time in hysteresis regime impeller outlet tip velocity impeller inlet tip velocity shaft input efficiency, (QDP 221 )/(M v ) hydraulic efficiency power coefficient, (M v )/ (0.5 r u 22 B 2 D 2 u 2 ) fluid density
s t 5 tip solidity, blade chord/( p D 2 / No. blades) j 5 constant, K 1 /K 2 5 (d f /dt*)/ f f 5 discharge coefficient (Q/S 2 u 2 ) f A 5 discharge coefficient, 0.1213 (69.7% bep) f B 5 discharge coefficient, 0.1225 (70.3% bep) c 5 pump pressure rise coefficient, DP 221 /(0.5 r u 22 ) v 5 pump shaft angular frequency v s 5 specific speed dimensionless, v Q 0.5 /( gH) 0.75 Acronyms bep 5 best efficiency point ISO 5 international standards organization PSS 5 pressure side shroud PSH 5 pressure side hub SSS 5 suction side shroud SSH 5 suction side hub
Transactions of the ASME
Fig. 5 Unsteady pressure magnitude in the hysteresis loop for the leading edge transducers on the suction side. Uncertainty estimate is 60.01 for C p .
Fig. 3
The results of phase averaging measured signals
the sum of two Fourier series, The lost signal information could be of great value to study unsteady flow fields. In this Part II article signal analysis was performed with no phase averaging on the raw signal data.
Pump Performance The results of the stationary measured pressure, power, and efficiency coefficient are displayed in Fig. 4 to the right. A zoom of the hysteresis regime in the characteristics is seen to the left. Discontinuities are seen to be found in all three characteristics occurring at the same volume fluxes. Movement from the top to bottom branch of the hysteresis is accompanied by flow field changes consisting of inlet prerotation and impeller inlet and outlet recirculation resulting in flow contraction as the impeller recirculation blocks the larger radius portions of the impeller inlet (Gu¨lich, 1995). For the case of recirculation commencing the impeller experiences a partially blocked inlet flow area at larger radius portions and the resulting through flow experiences a sudden path change resulting in a different energy transfer path. To provide a physical understanding of the changing flow field in the hysteresis regime the concept of changing power is applied. Along the top branch of the hysteresis for decreasing f at the c discontinuity near f 5 0.121 the output power (product QDP 221 , interpreted as the useful hydraulic power transferred to the flow) drops 340W, the l coefficient (the input power on the pump shaft M v ) drops 250W meaning that after dropping down the discon-
tinuity the flow receives 340W less useful output power for 250W less input power on the pump shaft. Missing are 90W of shaft power not transferred to the useful flow power. Generalizing this case for a 2 l d discontinuity in shaft power a 24/3 l d discontinuity in the useful flow power occurred. For increasing f a l d discontinuity in shaft power results in an 4/3 l d increase of transferred useful flow power. To heuristically explain this lost power paradox consider the definition of the shaft efficiency,
h5
˙ ~u 2 c u2 2 u 1 c u1 ! QDP h h m 5 Mv Mv
where the hydraulic efficiency with the Euler turbomachinery equation has replaced the useful flow output power. Implementation of the Euler equation allows an over simplified though intuitive physical interpretation for the case at hand (i.e., unsteady, three-dimensional, viscous flow). At a characteristic discontinuity h is measured to change and the term u 2 c u2 2 u 1 c u1 changes appropriately with the change in M v shaft power. The hydraulic efficiency h h however also changes. The commencement/cessation of the impeller driven recirculation and prerotation produces a change in the flow field which influences both the input power transferred to the fluid from the impeller and the internal flow losses meaning a change in h h . In fact the recirculation and prerotation can be considered as power dissipation mechanisms. The fluid rotation of these zones gives rise to viscous stresses and mixing. Once the rotation is established the energy fed into the fluid cells is in equilibrium with dissipation. Thus the discontinuity in the output power QDP 221 can be larger than the input power M v discontinuity through a discontinuity in h h . An order of magnitude approximation and numerical calculations for power dissipation due to the recirculation and prerotation (Kaupert, 1997) revealed the plausibility of this statement.
The Rotating Frame
Fig. 4 Steady measured hysteresis in a zoom of the characteristics. Uncertainty estimate is 60.3% for c, l, h.
Journal of Fluids Engineering
Concentrating firstly on the inlet transducers along the blade suction side leading edge the unsteady flow field changes are evaluated for the two branches of the hysteresis. The pressure signal fluctuation magnitude is presented in Fig. 5 (statistically evaluated as two standard deviations of the measured signal magnitude C˜ p ) as a function of dimensionless transducer position s/L 1 at 4 values of f in the hysteresis loop. For f values on the top branch of the hysteresis ( f $ f A ) a fairly uniform unsteady pressure magnitude is seen across the leading edge. For f values on the bottom branch ( f # f B ) the outer two transducers (large s/L 1 ) were effected by the inlet recirculation with a near doubling of magnitude. The change in the unsteady inlet flow field is further examined for the tip transducer in Fig. 6 with a Daubechies 8 coefficient wavelet magnitude spectrum (Kaupert, 1996). The ordinate in the time frequency plane is semi log-linear. The top spectrum with no inlet recirculation ( f A ) shows a strong pump shaft and second harmonic frequency. The bottom spectrum with inlet recirculation ( f B ) shows both the pump shaft and the second harmonic were SEPTEMBER 1999, Vol. 121 / 629
Fig. 6 Unsteady flow field experienced by tip transducer (SS). Uncertainty estimate is 63 Hz for frequency.
present but a frequency band higher (40 to 70 Hz) is seen to exist. This is the frequency band in the vortex arising from modulation of impeller inlet recirculation, influencing the unsteady flow field within the pump. The coupling of the impeller recirculation behavior with the inlet and outlet influencing each other is examined with the aid of Fourier magnitude spectra shown in Fig. 7. All the Fourier spectra are chopped at a value of 0 to 0.015 to qualitatively compare the stochastic portions of the spectra over a frequency band from 0 to 100 Hz, the f o 5 12.5 Hz being the pump shaft frequency and f bp 5 87.5 Hz the blade passing frequency. Table 1 summarizes the observations. In terms of the frequency spectra and stochastic levels it can thus be stated that the recirculation near the inlet was more intense than near the outlet. It is put forth here that the impeller outlet recirculation was highly transient. In contrast the inlet recirculation was a strong stable flow structure. Perhaps the two recirculations were connected through the impeller but in a highly transient manner (i.e., the two recirculation zones may in fact be one zone of recirculation). This hypothesis has been previously reported with flow visualization tests (Weiß, 1995) on a centrifugal pump of medium specific speed. It implies that the inlet recirculation penetrated downstream to a minimum depth of transducer 8 and fluctuated deeper to transducer 10 and 12. This penetration downstream was enough to register as steady measured impeller outlet recirculation in a previous investigation (Kaupert et al., 1996). Hereto the pressure distribution in the volute of the pump has an upstream influence on the impeller flow which can act on the recirculation zones depth of impeller penetration. In diffuser pumps the selection of a diffuser is known to have a significant influence on the impeller outlet recirculation (Stachnik, 1991, Hergt and Stark, 1985) but lesser on the inlet recirculation.
The Stationary Frame To qualitatively evaluate the transient behavior of the hysteresis a fast response probe was inserted into the flow near the impeller leading edge tip, Fig. 8 sketch. A link between the transient occurrence of impeller recirculation with prerotation and the c discontinu630 / Vol. 121, SEPTEMBER 1999
Fig. 7 Fourier magnitude spectra in the rotating impeller without recirculation (A), and with recirculation (B). Notice the increasing stochastic components on the suction side near the impeller shroud side. Uncer˜ p. tainty estimate is 60.001 for C
ity in the hysteresis loop of the pump characteristic was sought. Figure 8 shows the Haar wavelet transform magnitudes of two unsteady pressure signals acquired by the fast response probe while slowly decreasing (top) and increasing (bottom) f over 40 impeller rotations. The observations for the spectra are summarized in Table 2. The good f localization provided by a Haar function mother wavelet establishes that f A Þ f B . The impeller transient recirculation with prerotation commences at near the location of c discontinuity f A and ceases near the location of c discontinuity f B .
Transient Operation Typically a pump will not remain at a constant operational point but rather be subjected to transient operation. A connection beTable 1
Impeller recirculation observations in rotating frame
operating point
f A 5 0.1213 (69.7%) • f without inlet recirculation
f B 5 0.1225 (70.3%) • f with inlet recirculation
observations in rotating impeller spectra suction side • shaft frequency f o and multiples • near leading edge (2A, 3A, 4A, 5A) lower shaft harmonics weak pressure side • shaft frequency and multiples suction side • increased stochastic level in 3B, 4B, 5B, 8B, 10B, 12B generated by the recirculation zone • 2B shows little change, revealing shroud to hub influence of recirculation • 10B and 12B show decrease in stochastic level compared with 5B, 8B. Deemed the recirculation zones transient area • 11B on hub side shows little change pressure side • 15B, 16B, 17B, 18B no significant change
Transactions of the ASME
Fig. 9 Transient behavior of c at hysteresis discontinuity. Uncertainty estimate is 60.5% for c, f.
Fig. 8 Determination of the transient inlet recirculation during a slow throttling from unsteady signals. Uncertainty estimate is 63 Hz for frequency.
tween the transient pump head and the throttling rate in the hysteresis, as recirculation commences/ceases, was sought. For this several tests were performed at various throttling rates. The quantitative transient behavior of the pump c characteristic for increasing f is revealed in Fig. 9, retaining the shape of the steady measured c characteristic in Fig. 4 but with points measured along the c discontinuity, not possible in the steady case because of the unstable c behavior. This is the path c takes for increasing f as the impeller recirculation with prerotation ceases. The individual time history of c and f is also shown, Fig. 9, within the hysteresis flow regime. The constant T* is introduced as the hysteresis regime transition time. The sudden transition ( jump) in c at the stability limit has been quantitatively evaluated with a best fit linear interpolation providing a slope of d c /dt 5 0.034 s 21 when d f /dt 5 0.0025 s 21. This evaluation determines the transient behavior of the useful output power transferred to the fluid, proportional to fc, during the cessation of impeller recirculation and prerotation. The behavior is similar, not shown, for the case of decreasing f as flow recirculation with prerotation commences. The mathematical description of the change in useful hydraulic
Table 2
Transient impeller recirculation observations
decreasing f
increasing f
• stability limit at point f A • above f A , f bp dominant • below f A , f bp is smeared, more stochastic signal content • below f A , transient impeller recirculation and prerotation commence
• stability limit at point f B • above f B , f bp dominant • below f B , f bp is smeared, more stochastic signal content • above f B , transient impeller recirculation and prerotation cease
Journal of Fluids Engineering
output power transferred to the flow within the c transition regime is, d~QDP 221 ! dL 5 dt dt Taking the derivative with the dimensionless coefficients and introducing t* 5 t/T* provides,
S
D
S 2r 3 d f dc dL u c1 f 5 2 2 dt* dt* dt*
(1)
at constant rotational speed. This is a quantifying linear differential equation to describe a single aspect of the hysteresis in the c transition regime. It appears contradictory since hysteresis is a nonlinear phenomenon in general but for the single quantity, hydraulic output power in the discontinuity it was found to be suitable. For all the test cases here throttling was performed at a constant rate meaning d f /dt* 5 K 1 within the c transition regime, having a linear correlation coefficient greater than 0.97. Note that K 1 is however not the same for each test, rather a constant for a given test. The f at which the c transition begins is the stability limit f A or f B 5 K 2 , also a constant so that for a series of tests performed at various K 1 for increasing and decreasing f within the c transition regime equation (1) becomes, dc dL 2 1 jc 5 dt* S 2 r u 32 K 2 dt*
(2)
where j 5 K 1 /K 2 5 (d f /dt*)/ f A(orB) and K 2 is taken to be constant over the transition regime (it varies less than 1% depending on increasing or decreasing f). The t* 5 0 is defined as the start point of the c transition regime. For the case dL/dt constant (assumed here for simplicity to be 340 W/1.5 s from Fig. 4 and Fig. 9) this equation becomes linear and first order, dc 1 jc 5 K 3 dt* where SEPTEMBER 1999, Vol. 121 / 631
Fig. 10 Results from equation 3 and measurements within the c transition regime at t* 5 1.5 s. Uncertainty estimate is 60.001 for df/dt, 60.002 for dc/dt.
K3 5
dL 2 3 S 2 r u 2 K 2 dt*
and may be integrated to obtain,
c 5 ~ c o 2 K 3 ! exp~2j t*! 2 j 21 @T* sgn ~ j ! c o exp~2j t*! 2 K 3 # dc 5 @T* sgn ~ j ! c o 2 jc o 1 K 3 j # exp~2j t*! dt*
(3)
where c o is the steady value of the c discontinuity magnitude for an infinitely slow change in f (i.e., d f /dt* ' 0) and sgn (j) is the algebraic sign of j, positive or negative. For all tests performed |d f /dt*| ! f A and the c transition regime time satisfies the condition T* , 2s meaning the exponential in Eqs. (3) satisfies j t* ! 1 and further for a given test d c /dt* depends primarily on j and only weakly on t*. This predicts well the nearly constant value for d c /dt in the transition regime of Fig. 9. The results from Eq. (3) revealing the behavior of the pump head during the c transition regime are plotted in Fig. 10 for the case t* 5 1.5 (as mentioned the model is only weakly dependent on time). The model reveals that as |d f /dt*| increases the |d c /dt*| decreases. The results of various tests are also shown in Fig. 10 as points revealing for small |d f /dt*| , 0.005 the model and experiments are in agreement. The experiments show a greater nonlinearity than found in Eq. (3) which becomes significant for larger df/dt*. Reason for the discrepancy lies in the assumed constant dL/dt*, which implies that as the impeller recirculation and prerotation commences/ceases the pump useful output power is changing at a constant rate. A parameter variation on the inhomogeneity of Eq. (2) for the case dL/dt* 5 dL/dt*[(df/dt*) 2, df/dt*] was performed numerically to quantitatively obtain better agreement and permit physical interpretation. The results are plotted in Fig. 10. The rate of change of useful output power in the hysteresis transient regime during the commencement/ cessation of recirculation and prerotation has a nonlinear dependence, due to the exponent 2, on the throttling rate. This characterizes the lost useful hydraulic power due to recirculation and prerotation with a path dependency on df/dt* (i.e., the throttling rate).
Conclusions The discontinuities in the pump c, l, h characteristics occur at the same f, resulting in a near 3% change in h, to form a hysteresis loop. The concept of impeller driven recirculation and prerotation as pump power dissipaters was hypothesized to explain the magnitude difference between the characteristic discontinuity in l and c. The inlet recirculation was shown to commence/cease transiently at the exact f values where the c discontinuity exists, useful for the interpretation of the transient behavior of c. 632 / Vol. 121, SEPTEMBER 1999
The recirculation zone at the inlet was a strong phenomenon and its global structure was deemed stable. For the highest f of its existence strong stochastic pressure fluctuations extend through approximately the first half of the impeller passage on the suction side shroud retaining a strong circulating behavior. In the later half of the impeller the recirculation takes on a highly transient form with considerably weaker stochastic pressure fluctuations than at the inlet. Based on the pressure measurements the inlet and outlet recirculation zone are considered one recirculation zone connected transiently through the impeller and are not separable. The outlet recirculation is known to be influenced by the volute configuration and is test configuration dependent. The behavior of the pump c discontinuity in transient operation was experimentally and theoretically evaluated. In particular c was found not to undergo a discontinuity but rather had a definite d c /dt. This was related to the d f /dt during increasing and decreasing f tests. The theoretical development bases itself on the change in useful output power the flow receives in the hysteresis flow regime, as the impeller flow recirculation and prerotation was commencing/ceasing. The faster the throttle is opened the greater the influence on the hysteresis regime of the characteristic. The hysteresis can be viewed as quasi steady for slow changes in f with respect to time (i.e., |d f /dt| , 0.005 s 21). For faster changes in f a quasi steady approach to understanding the behavior of the characteristic in the hysteresis regime is no longer suitable.
Acknowledgments This work was made possible by funding from Sulzer Pumps Ltd. in Winterthur, the Swiss Commission for the Promotion of Applied Research and the precision mechanical work of Mr. H. Suter.
References Fraser, W. H., 1982, “Recirculation in Centrifugal Pumps,” World Pumps, pp. 227–235. Gossweiler, C., 1993, “Sonden und Messsystem fu¨r schnelle aerodynamische Stro¨mungsmessungen mit piezoresistiven Druckgebern,” ETH Zurich Dissertation Nr. 10253. Greitzer, E. M., 1980, “The Stability of Pumping Systems—The 1980 Freeman Scholar Lecture,” ASME JOURNAL OF FLUIDS ENGINEERING, Vol. 103, pp. 193–242, June. Gu¨lich, J. F., 1995, “Untersuchung zur sattelfo¨rmigen Kennlinien-Instabilita¨t von Kreiselpumpen,” Forschung im Ingenieurwesen Bd. 61, Nr 4. Hergt, P., and Starke, J., 1985, “Flow Patterns Causing Instabilities in the Performance Curves of Centrifugal Pumps with Vaned Diffusers,” Proceedings of the Second International Pump Symposium, Houston, pp. 67–75. Hureau, F., Kermarec, J., and Foucher, D., 1993, “Etude de l’Ecoulement Instationnaire dans une Pompe Centrifuge Fonctionnant a Debit Partiel,” Pump Noise and Vibrations, 1st International Symposium, Clamart France, July. ISO 1987:5198, International Organization for Standardization, Centrifugal, mixed flow and axial pumps—Code for hydraulic performance test—Precision grade, Edition 1. Kaupert, K. A., Holbein, P., and Staubli, T., 1996, “A First Analysis of the Flow Field in the Hysteresis of a Pump Impeller Characteristic,” ASME JOURNAL OF FLUIDS ENGINEERING, Dec., pp. 685– 691. Kaupert, K. A., 1997, The Unsteady Flow Field in a High Specific Speed Centrifugal Pump, Dissertation #12068 ETH Zurich, to be published. Kaupert, K. A., 1996, “Quasi Joint Time Frequency Analysis in Turbomachinery,” Sixth International Conference on Vibrations in Rotating Machinery, St. Catherine’s College, Oxford, England, 9 –12 Sept. Kupferschmied, P., and Gossweiler, C., 1992, “Calibration, Modeling and Data Evaluation Procedures for Pressure Probes,” 10th Symposium on Measuring Techniques in Turbomachines, Mu¨nchen. Makay, E., 1980, “Centrifugal Pump Hydraulic Instability,” Electric Power Research Institute Report EPRI CS-1445. McCroskey, W. J., 1982, “Unsteady Airfoils,” Annual Review of Fluid Mechanics, Vol. 14, pp. 285–309. Pfleiderer, C., and Petermann, H., 1991, Stro¨mungsmaschinen, Springer-Verlag, Heidelberg, 6th edition. Stachnik, P., 1991, “Experimentelle Untersuchungen zur Rezirkulation am Einund Austritt eines radialen Kreiselpumpenlaufrades in Teillastbetrieb,” Dissertation D17, Technische Hochschule Darmstadt. Stanmore, L. K., 1988, “Field Problems Relating to High-Energy Centrifugal Pumps Operating at Part-Load,” IMechE Conference C343/88 Pumps in Part Load. Stoffel, B., 1989, “Experimentelle Untersuchung zur ra¨umlichen und zeitlichen Struktur der Teillast-Rezirkulationen bei Kreiselpumpen,” Forschung im Ingenieurwesen Bd. 55 Nr 5. Weiß, K., 1995, “Experimentelle Untersuchungen zur Teillaststro¨mung bei Kreiselpumpen,” Dissertation D17, Technische Hochschule Darmstadt.
Transactions of the ASME