Materials Science Forum Vols. 505-507 (2006) pp 835-840 Online available since 2006/Jan/15 at www.scientific.net © (2006) Trans Tech Publications, Switzerland doi:10.4028/www.scientific.net/MSF.505-507.835
The use of the Taguchi-Grey based to optimize high speed end milling with multiple performance characteristics S. J. Hwanga
Y. L. Hwangb
B. Y. Leec
Department of Mechanical Design Engineering a ,b Department of Mechanical Manufacture Engineering c 64 Wen-Hua Road, Huwei Yunlin, Taiwan 63201 National Formosa University a
[email protected],
b
[email protected],
c
[email protected],
Keywords: Optimization; High speed machining; Tool life; Surface roughness Abstract. This paper presents a new approach for the optimization of the high speed machining (HSM) process with multiple performance characteristics based on the orthogonal array with the grey relational analysis has been studied. Optimal machining parameters can then be determined by the grey relational grade as the performance index. In this study, the machining parameters such as cutting speed, feed rate and axial depth of cut are optimized under the multiple performance characteristics including, tool life, surface roughness, and material removal rate(MMR). As shown experimental results, machining performance in the HSM process can be improved effectively through this approach. Introduction High speed machining technology is one of the important aspects of advanced manufacturing technology, it’s a cost effective method of machining hardened steels for moulds and dies to obtain a precise surface and high productivity [1-4]. Machining parameters such as cutting speed, feed rate, and depth of cut deeply affect both dimensional precision and surface quality, Therefore, an optimal selection of these machining parameters is very important in order to obtain high precision parts and to reduce the manual fit operations and the manufacturing cost. The grey relational analysis based on the grey system theory can be used to solve the complicated interrelationships among the multiple performance characteristics effectively [5-7]. As a result, optimization of the complicated multiple performance characteristics can be converted into optimization of a single grey relational grade. It is shown by this study that the use of the Taguchi method with the grey relational analysis can greatly simplify the optimization procedure for determining the optimal HSM parameters with the multiple performance characteristics in the HSM process. Experiment design Experiments were carried out on a high speed machining center (Papars B8) using 10mm diameter end mill with TiAlN coated for machining of SKD61 Tool Steel blocks. The cutting tools were 10 mm diameter four teeth corner-radius end-mill. The helical angle is 45 ° and the All rights reserved. No part of contents of this paper may be reproduced or transmitted in any form or by any means without the written permission of the publisher: Trans Tech Publications Ltd, Switzerland, www.ttp.net. (ID: 140.130.17.62-16/09/10,11:02:40)
836
Progress on Advanced Manufacture for Micro/Nano Technology 2005
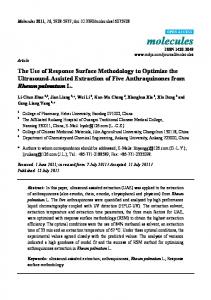
corner-radius is 0.5 mm. The schematic diagram of the experimental set-up is shown in Fig.1. According to Taguchi method, a robust design [8] and an L 27 (313 ) orthogonal array table was
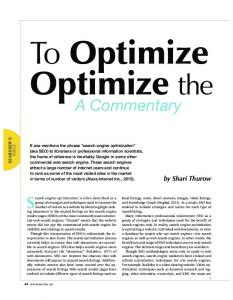
chosen for the experiments (table 1). Three machining parameters are considered as controlling factors (Cutting speed, feed rate and axial depth of cut) and the radial depth of cut (Ae) was kept constant for all cutting tests at 0.5mm. The machining results after HSM process were evaluated in terms of the following measured machining performance: (1) Tool life (L, min); (2) surface roughness (Ra, µm ); and (3) metal removal rate (MRR, mm 3 ). The Tool life obtained with a flanked wear threshold of Vb≦0.2mm is used as a criterion (ISO 3002/1).The features of the flank wear land on the end-mill is shown in Fig.2. In Fig.2, the value of A、B、C、D is the end cutting edge of end-mill, the value of E、F、G、H is the peripheral cutting edge of end-mill. In the experiments, the flank wear land was measured by both cutting edges of the end-mill using a tool microscope (OLYMPUS STM5-BDZ). HKF UF440A-4ENSR-D10-R0.5 tools were used in the experiments.
Fig 1. The schematic of experimental setup of high speed machining
Fig 2. Features of the flank wear land on the end-mill.
Results and Analysis of Experiments
The first step of parameter design is to switch the quality characteristic to S/N ratio (signal-to-noise ratio). To obtain the optimal machining performance, the minimum surface roughness and the maximum tool life and material removal rate are desired. The first criterion selects the-smaller-the-better characteristic of the surface roughness. The calculation of the S/N ratio η ij for the ith experiment at the jth test is as follows:
η ij = −10 log(
1 n 2 ∑ yij ) n j =1
(1)
where y ij is the ith experiment at the jth test and n is the number of tests. The second criterion selects the-large-the-better characteristic for the tool life and material removal rate. The equation of the S/N ratio is as follows:
η ij = −10 log(
1 n 1 ∑ ) n j =1 yij2
Table 2 shows the Experimental results and its corresponding S/N ratio.
(2)
Materials Science Forum Vols. 505-507
837
Table 1 Machining parameters and their levels Machining parameter
Unit
Range and levels 1
2
3
v: Cutting speed
m/min
314
471
628
f:
m/min
6
3
0.6
Feed rate
d: Axial depth of cut mm 1.5 1 0.5 Table 2 Experimental layout using L 27 Orthogonal array and Experimental results and its S/N ratio L No
v
f
Ra
d (min)
( µm )
MRR (mm 3 )
S/N (L)
S/N
S/N MRR
(Ra)
1
1
1
3
208
0.62
0.1125
46.36127
4.15217 -18.9770
2
1
1
2
218
0.61
0.075
46.76913
4.29340 -22.4988
3
1
1
1
223
0.34
0.0375
46.96610
9.37042 -28.5194
4
1
2
3
203
0.35
0.05625
46.14992
9.11864 -24.9976
5
1
2
2
213
0.24
0.0375
46.56759 12.39577 -28.5194
6
1
2
1
224
0.2
0.01875
47.00496 13.97940 -34.5400
7
1
3
3
228
0.09
0.01125
47.15870 20.91515 -38.9770
8
1
3
2
243
0.07
0.0075
47.71212 23.09804 -42.4988
9
1
3
1
364
0.05
0.00375
51.22203 26.02060 -48.5194
10
2
1
3
103
0.45
0.075
40.25674
6.93575 -22.4988
11
2
1
2
122
0.42
0.05
41.72720
7.53501 -26.0206
12
2
1
1
138
0.4
0.025
42.79758
7.95880 -32.0412
13
2
2
3
110
0.3
0.0375
40.82785 10.45757 -28.5194
14
2
2
2
130
0.29
0.025
42.27887 10.75204 -32.0412
15
2
2
1
152
0.25
0.0125
43.63687 12.04120 -38.0618
16
2
3
3
101
0.09
0.0075
40.08643 20.91515 -42.4988
17
2
3
2
129
0.08
0.005
42.21180 21.93820 -46.0206
18
2
3
1
175
0.08
0.0025
44.86076 21.93820 -52.0412
19
3
1
3
53.5
0.26
0.05625
34.56707 11.70053 -24.9976
20
3
1
2
64.5
0.29
0.0375
36.19119 10.75204 -28.5194
21
3
1
1
72
0.28
0.01875
37.14665 11.05684 -34.5400
22
3
2
3
54
0.23 0.028125
34.64788 12.76544 -31.0182
23
3
2
2
68
0.22
0.01875
36.65018 13.15155 -34.5400
24
3
2
1
80
0.24 0.009375
38.06180 12.39577 -40.5606
25
3
3
3
53
0.11 0.005625
34.48552 19.17215 -44.9976
26
3
3
2
85
0.12
38.58838 18.41637 -48.5194
27
3
3
1
141
0.00375
0.1 0.001875
42.98438
20 -54.5400
838
Progress on Advanced Manufacture for Micro/Nano Technology 2005
Grey relational analysis In the grey relational analysis method, experimental data (tool life, surface roughness and metal removal rate) are first normalized in the range between zero and one, which is also called the grey relational generation. The normalized SN ratio xIJ for the i th experiment results in the j th
experiment can be expressed as x IJ =
y ij − min j yij
(3)
max j y ij − min j y ij
Table 3 The data preprocessing of the each Performance characteristic. Next, the Grey relational coefficients are calculated to express the relationship between the ideal and the actual normalized SN ratio. The grey relational coefficient ξ ij can be expressed as:
ξ ij =
min i min j xi0 − xij + ζ max i max j xi0 − xij
(4)
xi0 − xij + ζ max i max j xi0 − xij
where xi0 is the ideal normalized results for the ith performance characteristics and ζ is the distinguishing coefficient which is defined in the range 0 ≤
ζ ≤ 1. After averaging the grey
relational coefficients, the grey relational grade can be obtained, that is: 1 m γ j = ∑ ξ ij m i =1
(5)
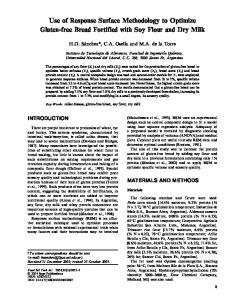
where m is the number of performance response. Table 4 presents the overall grey relational coefficient and the corresponding grey relational grade values for all the experimental runs. The mean of the grey relational grade for each level of the process parameters is calculated (Table 5). The larger the mean of the grey relational grade, the better is the multiple process response. The ANOVA is performed to determine which parameters significantly affect the performance characteristic. The results of ANOVA for grey relational grade values with v, f and d are shown in table 6. Results show that the cutting speed is the most significant parameter and feed rate the significant factor for affecting the multi-response characteristics. The larger the grey relational grade, the better is the multiple process response. Therefore, the optimal high speed machining parameters level combination is v1f 3 d 3 . The final step is to predict and verify the improvement of the performance characteristic using the optimal level of the machining parameters. The estimated grey relational grade of the optimal machining parameters combination can be calculated as: q
η opt = η m + ∑ (ηi − η m )
(6)
i =1
where η m is the total mean of the grey relational grade, ηi is the Grey relational grade at the optimal level and q is the number of the machining parameters that significantly affects the multiple response characteristics. Table 7 shows the results of the confirmation experiment using the optimal machining parameters. As shown in Table 7, the tool life is increased from 152 to 228 min, the material removal rate is decrease from 0.0125 to 0.01125 mm 3 and the surface roughness is
Materials Science Forum Vols. 505-507
839
improved from 0.25 to 0.09 µm . It is clearly shown that the multiple performance characteristics in the HSM process are greatly improved. Table 3 The data preprocessing of the each Performance characteristic Ra L MRR N
Table 4 The Grey relational coefficient and Grey relational grade N
Grey relational coefficient L
o
1 2 3 4 5 6 7 8 9 10 11 12 13 14 15 16 17 18 19 20 21 22 23 24 25 26 27
Ra
MRR
0.3333 0.3348 0.3964 0.3928 0.4452 0.4759 0.6817 0.7891 1 0.3642 0.3717 0.3771 0.4126 0.4173 0.4389 0.6812 0.7281 0.7281 0.433 0.4173 0.4222 0.452 0.4593 0.4452 0.6149 0.5898 0.6449
1 0.8347 0.6508 0.747 0.6508 0.5333 0.4706 0.4305 0.3757 0.8347 0.7162 0.5764 0.6508 0.5764 0.4823 0.4305 0.3967 0.3497 0.747 0.6508 0.5333 0.5962 0.5333 0.4517 0.4059 0.3757 0.3333
o
0.70957 0.73394 0.74571 0.69694 0.72189 0.74803 0.75721 0.79028 1 0.34482 0.43268 0.49664 0.37895 0.46565 0.54679 0.33465 0.46164 0.61991 0.00487 0.10191 0.15900 0.00970 0.12933 0.21368 0 0.24514 0.50780
0 0.00646 0.23862 0.22711 0.37696 0.44938 0.76654 0.86636 1 0.12728 0.15469 0.17406 0.28833 0.30179 0.36074 0.76653 0.81331 0.81331 0.34517 0.30179 0.31573 0.39386 0.41152 0.37696 0.68683 0.65227 0.72468
1 2 3 4 5 6 7 8 9 10 11 12 13 14 15 16 17 18 19 20 21 22 23 24 25 26 27
0.6326 0.6527 0.6629 0.6226 0.6426 0.6649 0.6731 0.7045 1 0.4328 0.4685 0.4983 0.446 0.4834 0.5245 0.4291 0.4815 0.5681 0.3344 0.3576 0.3729 0.3355 0.3648 0.3887 0.3333 0.3984 0.5039
Grey relational grade 0.6553 0.6074 0.5700 0.5875 0.5795 0.558 0.6085 0.6414 0.7919 0.5439 0.5188 0.4839 0.5032 0.4924 0.4819 0.5136 0.5354 0.5487 0.5048 0.4752 0.4428 0.4613 0.4525 0.4286 0.4514 0.4547 0.4941
0.7 0.6 0.5 0.4 v1 v2 v3
Mean value of the grey relational grade = 0.5630
f1 f2 f3
d1 d2 d3
Fig 3. Grey relational grade graph
840
Progress on Advanced Manufacture for Micro/Nano Technology 2005
Table 6 Results of the analysis of variance for the grey relational grade Symbol Machining parameter
Degrees of freedom
Sum of square
Mean square
F
Contribution (%)
V
Cutting speed
2
0.119290
0.059645
32.67
89.55
f
Feed rate
2
0.013609
0.006804
3.73
10.22
d
Axial depth of cut
2
0.000293
0.000146
0.08
0.23
Error
20
0.036509
0.001825
Total
26
0.169701
Table 7 Results of HSM performance using the initial and optimal HSM process parameters Initial process parameters
Optimal process parameters Prediction v 1f 3 d 3
Experiment v 1f 3 d 3
Level
v 2 f 2 d1
Tool life
152
228
Surface roughness
0.25
0.09
material removal rate
0.0125
0.01125
Grey relational grade.
0.4819
0.5646
0.6085
Improvement of grey relational grade=0.1266 Conclusions The use of the Taguchi-Grey based method to determine the HSM parameters with
consideration of multiple performance characteristics has been reported in this paper. A grey relational analysis of the S/N ratios can convert the optimization of the multiple performance characteristics into the optimization of a single performance characteristic called the grey relational grade. By grey relational analysis, the optimal machining parameters’ setting can be obtained for the simultaneous consideration of the maximum tool life, material removal rate and minimum surface roughness. References [1] J. Tlusty, Int. J. CIRP, 42, 733 (1993).
[2] S. Smith, J. Tlusty, ASME J. Eng. Ind. 119, 664 (1997) [3] H. Schulz and T. Moriwaki, CIRP Ann. 41(2), 637 (1992) [4] J. Vivancos, C.J. Luis, L. Costa, J.A. Ortiz, J. Mater. Process. Technol. 155–156, 1505 (2004) [5]. J. L. Deng, J. Grey Syst. 1 (1), 1 (1989) [6] Z. Wang, L. Zhu, J. H. Wu, J. Grey Syst, 8 (1), 73 (1996) [7] N. Logothetis, A. Haigh, Quality Reliabil, Int, 4 (5), 159 (1988) [8] D. C. Montgomery, “Design and Analysis of Experiments,” 6th ed., Wiley, New York, (2005).
Progress on Advanced Manufacture for Micro/Nano Technology 2005 doi:10.4028/www.scientific.net/MSF.505-507 The Use of the Taguchi-Grey Based to Optimize High Speed End Milling with Multiple Performance Characteristics doi:10.4028/www.scientific.net/MSF.505-507.835