May 15, 2008 - The VIMOS-VLT Deep Survey: The dependence of clustering on galaxy ... dark-matter halos in which they are embedded, as predicted, e.g., ...
arXiv:0805.2319v1 [astro-ph] 15 May 2008
The VIMOS-VLT Deep Survey: The dependence of clustering on galaxy stellar mass at z ∼ 1 B. Meneux Max Planck Institut f¨ ur extraterrestrische Physik, D-85741, Garching, Germany Universit¨ ats-Sternwarte M¨ unchen, Scheinerstrasse 1, D-81679 Munich, Germany L. Guzzo INAF-Osservatorio Astronomico di Brera - Via Bianchi 46, I-23807 Merate (LC), Italy and the VVDS collaborationa We have investigated the dependence of galaxy clustering on their stellar mass at z∼1, using the data from the VIMOS-VLT Deep Survey (VVDS). We have measured the projected twopoint correlation function of galaxies, wp (rp ) for a set of stellar mass selected samples at an effective redshift < z >= 0.85. We have control and quantify all effects on galaxy clustering due to the incompleteness of our low mass samples. We find that more massive galaxies are more clustered. When compared to similar results at z ∼ 0.1 in the SDSS, we observed no evolution of the projected correlation function for massive galaxies. These objects present a stronger linear bias at z ∼ 1 with respect to low mass galaxies. As expected, massive objects at high redshift are found in the highest pics of the dark matter density field.
1
Introduction
In the currently accepted scenario, galaxies are thought to form within extended dark-matter halos1 , which grow through subsequent mergers in a hierarchical fashion. A major challenge in testing this general picture is to connect the observable properties of galaxies to those of the dark-matter halos in which they are embedded, as predicted, e.g., by large n-body simulations2 . Recent theoretical works seem to indicate that a fairly direct relationship indeed exists between global galaxy properties (e.g. their stellar or total baryonic mass, or their luminosity) and the halo mass, before it is accreted by a larger dark-matter halo12,13,14 . At the current epoch and at high redshift, the observed clustering of galaxies is found to depend significantly on their specific properties, such as luminosity3,4,5,6 , color or spectral type7,8 , morphology9,10 and stellar mass11 . The dependence of clustering on stellar mass in the local Universe has been shown in the Local Universe, from a large sample of galaxies of the Sloan Digital Sky Survey11 . Galaxies of larger mass are seen to be more clustered than low-mass ones, with the effect increasing above the characteristic knee value M ∗ of the Schechter mass a B. Garilli, O. Le F`evre, A. Pollo, J. Blaizot, G. De Lucia, M. Bolzonella, F. Lamareille, L. Pozzetti, A. Cappi, A. Iovino, C. Marinoni, H.J. McCracken, S. de la Torre, D. Bottini, V. Le Brun, D. Maccagni, J.P. Picat, R. Scaramella, M. Scodeggio, L. Tresse, G. Vettolani, A. Zanichelli, U. Abbas, C. Adami, S. Arnouts, S. Bardelli, A. Bongiorno, S. Charlot, P. Ciliegi, T. Contini, O. Cucciati, S. Foucaud, P. Franzetti, I. Gavignaud, O. Ilbert, B. Marano, A. Mazure, R. Merighi, S. Paltani, R. Pell` o, M. Radovich, D. Vergani, G. Zamorani, E. Zucca
function. Using the VIMOS-VLT Deep Survey (VVDS), we have investigated for the first time the evolution with redshift of the galaxy clustering as a function of stellar mass at z ∼ 115 . The VVDS is performed with the VIMOS multi-object spectrograph at the ESO Very Large Telescope16 and complemented with multi-color imaging data obtained at the CFHT and NTT telescopes17,18,19,20 . We have used the so-called “first epoch” data, collected in the VVDS-02h “Deep” field. This is a purely magnitude limited sample to IAB = 24, covering an area of 0.49 square degrees with a mean sampling of ∼ 23%. The full sample includes ∼ 11000 redshifts. Details about observations, data reduction, redshift measurement and quality assessment can be found elsewhere21 . We use a Concordance Cosmology with Ωm = 0.3 and ΩΛ = 0.7. The Hubble constant is normally parametrised via h = H0 /100 to ease comparison with previous works. Stellar masses are quoted in unit of h = 1. All correlation length values are quoted in comoving coordinates.
2
Stellar mass and incompleteness
Stellar masses for all galaxies in the VVDS catalogue were estimated by fitting their Spectral Energy Distribution, as sampled by the VVDS multi-band photometry, with libraries of stellar population models22 . The robustness of the method and intrinsic errors have been fully tested23 . The typical error on stellar mass is ∼O.1 dex. We concentrated our study of the dependence of galaxy clustering on stellar mass in the redshift range [0.5-1.2]. Such a sample includes 3218 galaxies more massive than 109 M⊙ . However, the VVDS is a flux limited survey, and even if the luminosity is correlated to the stellar mass, this relation has some scatter and then, some faint galaxies might be missed in a given stellar mass range. We investigated the completeness limit using the data themselves and 40 mock catalogues complete in stellar mass built from the Millennium run dark-matter outputs24 coupled to semi-analytical models25 .
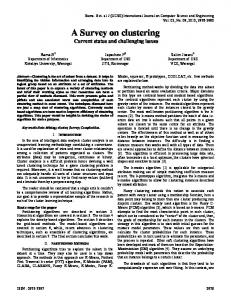
Figure 1: Stellar mass completeness at IAB = 24 as a function of redshift estimated from 40 mock catalogues. The green area indicates regions where all galaxies are fainter than the apparent luminosity thresold. The blue area shows region where no galaxy was found in the mock at any IAB apparent magnitude. The red points correspond to the VVDS data.
As an illustration, Fig. 1 shows the stellar mass vs. redshift relation of the mock catalogues, with, coded in grey scales, the fraction of galaxies brighter than IAB = 24 in narrow redshift (∆z = 0.01) and stellar mass (∆ log(M ) = 0.01) bins. According to these numerical simulations, we miss ∼ 30% of galaxies in the stellar mass range log(M/M⊙ ) = [9.5 − 10] between redshift z=0.5 and z=1.2. Samples of galaxies more massive than 1010 M⊙ are almost complete. It is interesting to note that, rather realistically, the typical galaxies producing the incompleteness at faint fluxes in the mock samples are red objects with high mass-to-light ratio. 3
Galaxy clustering as a function of stellar mass
We measure the two-point correlation function ξ(rp , π) and its projection along the line of sight wp (rp )26 using standard estimator27 . We take into account the complex observing strategy of the survey. We checked using the mock catalogues the effect of stellar mass incompleteness on the clustering measurement, comparing the projected correlation function for mock samples complete in stellar mass and selected at IAB ≤ 24. We concluded that, when incompleteness is the strongest (i.e. for log(M/M⊙ ) = [9 − 9.5]), the amplitude of the correlation function is underestimated on small scales by a factor up to 215 . Taking into account these effects in our conclusions, we measured the projected correlation function for several stellar mass samples from the real data at z ∼ 1. We observed for the first time at this redshift that more massive galaxies are more clustered than low mass galaxies, the +0.43 −1 −1 correlation length r0 increasing from 2.76+0.17 −0.15 h Mpc for log(M/M⊙ ) ≥ 9 to 4.28−0.45 h Mpc for log(M/M⊙ ) ≥ 10.5. This dependence on stellar mass was predicted by hydrodynamical simulations28 and is also observed in the mock catalogues we have been using15 . We then compared our measurement to similar analysis made at z ∼ 0.1 with SDSS data11 . Figure 2 shows a faster evolution of the correlation function wp (rp ) for galaxy less massive than 1010.5 M⊙ , while the clustering properties of massive galaxies do not appear to evolve with time.
Figure 2: Comparison of the projected correlation function wp (rp ) from SDSS data at z∼0.15 (black cross) to VVDS measurement at z∼0.85 (magenta filled dots and solid lines) in 3 ranges of stellar masses. The green dashed line is a power-law reference line drawn with r0 = 5 h−1 .Mpc and γ = 1.8. Error bars on VVDS measurement have been estimated from the variance among 40 mock catalogues. Blue open circles indicate VVDS measurements corrected for stellar mass incompleteness.
Thereby, the most massive galaxies display an evolution of their linear bias factor (from bL = 1.62 ± 0.18 at z∼1 to bL = 1.40 ± 0.03 at z∼0.1), while it remains roughly constant for lower mass objects (bL ∼ 1.3). Massives galaxies are found at z ∼ 1 in the highest peaks
of the density field15 . This finding is expected in a hierarchical scenario in which the most massive peaks of the mass density field collapse earlier and evolve faster29 . This interpretation qualitatively supports a scenario in which the stellar mass of a galaxy is essentially proportional to the mass of the dark-matter halo in which it was last the central object, consistent with recent simulations12,13 . 4
Acknowledgments
BM thanks the organisers of the conference for the financial support. LG gratefully acknowledges the hospitality of MPE, MPA and ESO. This research program has been developed within the framework of the VVDS consortium and has been partially supported by the CNRS-INSU and its Programme National de Cosmologie (France), and by Italian Ministry (MIUR) grants COFIN2000 (MM02037133) and COFIN2003 (num.2003020150). The VLT-VIMOS observations have been carried out on guaranteed time (GTO) allocated by the European Southern Observatory (ESO) to the VIRMOS consortium, under a contractual agreement between the Centre National de la Recherche Scientifique of France, heading a consortium of French and Italian institutes, and ESO, to design, manufacture and test the VIMOS instrument. References 1. 2. 3. 4. 5. 6. 7. 8. 9. 10. 11. 12. 13. 14. 15. 16. 17. 18. 19. 20. 21. 22. 23. 24. 25. 26. 27. 28. 29.
White, S. D. M., & Rees, M. J. 1978, MNRAS, 183, 341 Springel, V., Frenk, C. S., & White, S. D. M. 2006, Nature, 440, 1137 Guzzo, L., et al. 2000, A&A, 355, 1 Norberg, P., et al. 2002, MNRAS, 332, 827 Pollo, A., et al. 2006, A&A, 451, 409 Coil, A. L., et al. 2006, ApJ, 644, 671 Zehavi, I., et al. 2005, ApJ, 630, 1 Meneux, B., et al. 2006, A&A, 452, 387 Giovanelli, R., Haynes, M. P., & Chincarini, G. L. 1986, ApJ, 300, 77 Guzzo, L., et al. 1997, ApJ, 489, 37 Li, C., et al. 2006, MNRAS, 368, 21 Conroy, C., Wechsler, R. H., Kravtsov, A. V. 2006, ApJ, 647, 201 Wang, L., Li, C., Kauffmann, G., & De Lucia, G. 2006, MNRAS, 371, 537 Wang, L., Li, C., Kauffmann, G., & De Lucia, G. 2007, MNRAS, 377, 1419 Meneux, B., et al. 2008, A&A, 478, 299 Le F`evre, O., et al. 2003, Proc. SPIE, 4841, 1670 McCracken, H.J., Radovich, M., Bertin, E. et al. 2003, A&A, 410, 17 Le F`evre, O., Mellier, Y., McCracken, H.J. et al. 2004, A&A, 417, 839 Iovino, A., McCracken, H. J., Garilli, B. et al. 2005, A&A, 442, 423 Radovich, M., Arnaboldi, M., Ripepi, V., et al. 2004, A&A, 417, 51 Le F`evre, O., et al. 2005a, A&A, 439, 845 Bruzual, G., & Charlot, S. 2003, MNRAS, 344, 1000 Pozzetti, L., et al. 2007, A&A, 474, 443 Springel, V., White, S. D. M., Jenkins, A. et al. 2005, Nature, 435, 629 De Lucia, G., & Blaizot, J. 2007, MNRAS, 375, 2 Davis, M., & Peebles, J.P.E. 1983, ApJ, 267, 465 Landy, S.D. and Szalay, A.S. 1993, ApJ, 412, 64 Weinberg, D. H., Dav´e, R., Katz, N., Hernquist, L. 2004, ApJ, 601, 1 Mo, H. J., & White, S. D. M. 1996, MNRAS, 282, 347