The Visualization of Large Database in Stock Market Li Lin, Longbing Cao, Chengqi Zhang Faculty of Information Technology, University of Technology, Sydney, Australia Capital Market CRC, NSW 2000, Australia E-mail:
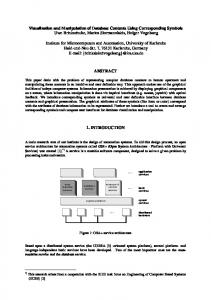
[email protected] Abstract In stock market, foreign currency exchange market, or any other asset trading system, there are high-density data, which is a typical data streams. And the trading rules are often the functions of many variables. The visualization of these systems is very important for users to do analysis and trading. So the problem is how to show the graph of the large data and multiple-variable functions. The usual approaches for visualization of this type of data cannot show us a picture with targeted both local details and global information. In this paper, we show the graph both in details and global trend with fisheye technology. Second, for the result graph, there are many parameters, so we use dynamic dimension selection technology to show the graph. Keywords: Large database visualization; Fish-eye view; Local details; Global trends; Dimension reducing 1. Introduction In stock market or foreign currency exchange data stream [1], the number of real-time transactions is normally very large and distributed in high-density, for instance, more than 20,000 records in a day in Australian Stock Exchange. However, the width of display window is limited, usually from 600 to 1024 or so. So, it is necessary for us to decide how to distribute so many points into a very small limited window efficiently and effectively on a very density graph. For instance, brokers and retailers are interested in browsing the price movement trend in a long-term period (as shown in Figure 1, which shows about 99,990 trading transactions from 1 January 1998 to 31 December 2000 in Australian Stock Exchange (ASX). The width of the window is 640, so in each pixel there are at least about 15 transactions inside). However, they also want to watch what has happened in details on some specific time points. In some other applications like back-test system of stock trading strategies [1,2], even in an hour, there may be many transactions collectively triggered around some specific time. But, sometimes, the brokers and users want to know the global trend and some time point details at the same time.
If we use the Zoom in/Zoom out technology, we can only get one graph for global trend or local details.
Figure 1 High-density stock data stream (x-coordinate is the order number of trades). For the technical trading rules, they often consider many parameters (4-10), so one rule can be treated as a multiple variable function. So the visualization of the function is also another problem for a trading system. In the paper, we have resolved the two problems with fisheye and dimension-selection methods. 2. Fish-eye with Gradual Distortion (FGD) We know the fish-eye is to show the graph with different distortion, as shown in Figure 2.
Figure 2 Cartesian fish-eye view (distortion scale is 4)
The advantage of data visualization based on fish-eye technology is on that specifically local details can be enlarged in a fish eye, while the global trend can still be kept in the limited window. This is very helpful in showing large amount of stock trading stream in heavydensity in a limited picture. The basic idea of fish-eye-based visualization of stock trading stream is as follows. Only a part captured from a graph is enlarged in details in the fish eye view, while all other parts outside the window are still shown normally. When we want to check details of some specific section on a graph, we just move the fish eye focus to that specific position (technically, moving the mouse and triggering a fish-eye view automatically). We divide the graph into three parts: a section before fish-eye view, the fish-eye view, and a section after fisheye view. Here, we only consider the x-coordinate distortion. Figure 3 shows the effect of FGD in the horizontal coordinate in the Cartesian system.
Figure 3 Fish-eye distortion on one dimension (distortion factor is 4) From the focus of the fish-eye view to the boundary far away, the width of grid is getting smaller and smaller gradually. However, the number of data points shown in every grid is exactly the same. Graphically, it keeps changing smoothly from focus to the boundaries. For each grid, the strategy of point distribution can be defined flexibly, for instance, the FFD. The application of fish-eye view with gradual distortion in stock stream visualization is shown in Figure 4 and Figure 5, respectively. In both of the Figures, there are 80 records which are distributed into each grid. As a result, the graph of the fish-eye view changes smoothly and continuously when we move the mouse interactively. As seen in the figures, FGD shows both regional details and global trend in different granularities at the same time. Furthermore, fish-eye view shows targeted focal area in details with movement of the mouse on the graph smoothly.
Figure 4 FGD for stock transactions.
Figure 5 FGD for Channel Break-outs. 3. Dimension Selection For almost every trading rule, there are many parameters. Figure 6 shows the two parameters.
Figure 6 A trading rule with two parameters (the others are discarded).
Form Figure 6, we cannot get the relationship between the Sharpe Ratio (SR) and “Fix band”, only “Long Run” and “Short Run”. If we reduce some dimension, we can not get the influence from those parameters, so we just select the user interesting two parameters dynamically. As shown in Figure 6. 4. Performance Evaluation The Interactive Zooming works very well when it is only used for showing specific details or browsing the global trends of high-density stock stream. However, it cannot be used to show both local details and global trends at the same time in one window. Fortunately, the fish-eye-based visualization can overcome shortages of both Zooming. It can show both local details and global trends of high-density data stream at the same moment in a limited window without losing information. This is very suitable for dealing with highdensity stock stream. On the other hand, fish-eye view can present much userfriendly human computer interaction for flexible positioning and enlargement of targeted sections in details. In our online agent-based stock trading support system---F-TRADE [3]----for trading back-testing, stock data mining, and stock trading support with online connectivity to real data of Australian Stock Exchange, we are integrating the fish-eye technology into it for visual outputs of stock trading signals, technical analysis, and data mining. 5. Conclusions and Future Work In stock data analysis both in data mining and technical analysis, the transaction stream is usually very large and of heavy density. The visualization of both local details of some specific transactions and global trends in the whole watch time period is very important for stock traders like brokers and retailers. By comparison, even though the complexity of coding and computation of fish-eye views may be flexibly high for some unique effects and breakthrough in visualization, web-based fish-eye views do present unique flexibility and user friendliness for visualization of very large and heavy density stream like stock transactions in a limited space. Besides studies in reducing complexity of computation and providing high performance fish-eye algorithms, a more practical strategy is to integrate fish-eye with other technologies like Sampling, achievements of query and processing of data stream, which will reduce complexity of computation in visualization of data stream, and provide visual functionality for watching high speed, real time data stream continuously. Therefore, a lot of research will be done in visualization of stock stream processing,
stock data mining, and stock trading and support system by integration of fish-eye technology. Acknowledgments The authors would like to thank JQ Wang, WL Chen and JR Ni for their helpful discussion, and Capital Market Cooperated Research Center [4, 15], AC3 [16], and SIRCA [17] for funding this project and providing large realistic data of ASX for this research. All supports and feedbacks from financial Prof. Mike Aitken in UNSW, Prof. Alex Frino in Sydney Uni. Australia and others are much appreciated. 6. References [1] Jiawei H., Mining dynamics of data streams in MultiDimensional space. www-sal.cs.uiuc.edu/ ~hanj/ slides/icdm02keynote.ppt [2] http: // www.tradestation.com [3] http: // datamining.it.uts.edu.au: 8080/tsap [4] http: // www.cmcrc.com [5] Sullivan, R., Allan T., et al. Data-Snooping, technical trading rule performance, and the bootstrap. Journal of Finance, 54, pp: 1647-1692, 1999. [6] Basu, A., Licardie, S., Modeling fish-eye lenses. Intelligent Robots and Systems '93, IROS '93. Proceedings of the 1993 IEEE/RSJ International Conference on Computer Visualization, Volume: 3, pp: 1822 – 1828, 1993. [7] Yonggao Y., Chen, J.X., Woosung K., et al. Nonlinear projection: using deformations in 3D viewing. Computing in Science & Engineering [see also IEEE Computational Science and Engineering], Volume: 5, Issue: 2, pp: 54 – 59, 2003. [8] Keim, D.A., Information visualization and visual data mining. Visualization and Computer Graphics, IEEE Transactions on visualization and computer graphics, Volume: 8, Issue: 1, pp 1-8, 2002. [9] Ivan H., Guy M., M. Scott M., Graph visualization and navigation in information visualization: a survey. IEEE Transaction on Visualization and Computer graphics. (6) 1, pp 24-43, 2000. [10] Szymon R., Marc L.. QSplat: A multi-resolution point rendering system for large meshes. In Siggraph 2000 Proceedings, pp: 343–352, 2000. [11] Baoquan C., Minh X. N., POP: A hybrid point and polygon rendering system for large data. In IEEE Visualization, 2001.
[12] Hillol K., Byung-Hoon P., Sweta P., et al. MobiMine: Monitoring the stock market from a PDA. SIGKDD Explorations. Vol. 3, Issue 2, pp 1-10 2001. [13] Lamping J., Rao R., Pirolli P. A., Focus+content technique based on hyperbolic geometry for viewing large hierarchies. In Proceedings of the ACM SIGCHI Conference on Human Factors in Computing Systems, Denver, May 1995.
[14] Li L., Longbing C., Chengqi Z., The Fish-eye Visualization of Foreign Currency Exchange Data Streams. Asia Pacific Symposium on Information Visualization. Sydney, Australia. January 27-29, 2005. [15] http: // www-staff.it.uts.edu.au/~linli [16] http: // www.ac3.com.au [17] http: // www.sirca.org.au