Hindawi Publishing Corporation Mathematical Problems in Engineering Volume 2015, Article ID 707269, 12 pages http://dx.doi.org/10.1155/2015/707269
Research Article Theoretic Framework and Finite Element Implementation on Progressive Collapse Simulation of Masonry Arch Bridge Weibing Peng,1 Ruodan Pan,1 and Fei Dai2 1
Zhejiang University of Technology, Hangzhou, Zhejiang 310014, China Department of Civil and Environmental Engineering, West Virginia University, P.O. Box 6103, Morgantown, WV 26506, USA
2
Correspondence should be addressed to Weibing Peng;
[email protected] Received 31 December 2014; Accepted 7 April 2015 Academic Editor: Stefan Balint Copyright © 2015 Weibing Peng et al. This is an open access article distributed under the Creative Commons Attribution License, which permits unrestricted use, distribution, and reproduction in any medium, provided the original work is properly cited. The capacity that computer can solve more complex design problem is gradually increased. Progressive collapse simulation of masonry arch bridge needs a breakthrough in the current development limitations and then becomes more accurate and integrated. This paper proposes a theoretic framework and finite element implementation on progressive collapse simulation of masonry arch bridge. It is intended to develop a new large deformation element in OpenSees, which can be used for analyzing the collapse process of masonry arch bridge. A mathematical method for large deformation element is put forward by large deformation element. The feature model for bridge structure allows families of bridge components to be specified using constraints on geometry and topology. Geometric constraints are established in bridge components by feature dependence graph in the feature model for bridge. A bridge collapse simulation software system was developed according to such combined technologies. Results from our implementation show that the method can help to simulate the progressive collapse process of masonry arch bridge.
1. Introduction The masonry arch bridges, a conventional bridge type, are widely used throughout the world because of their low cost and beautiful appearance. However, there were a lot of arch bridges collapsed due to deficiencies in design, detailing, construction, maintenance, use of materials, and inadequate consideration of external events. The first four deficiencies represent integral roles in the building of a bridge [1]. Furthermore, the deficiencies in construction are concerned more because of complicated construction operation needs and relative collapsed cases. A masonry arch bridge Dixituojiang Bridge under construction over the Dixituojiang River in Hunan, China, suddenly collapsed on the 13st of August 2007 and there were many victims in this disaster [2]. The report about the collapse of the Dixituojiang Bridge clarified improper installation and inadequate temporary structure to support the bridge components were the main reasons. Stresses redistributing in the remaining structures are triggered by the local deficiencies because of improper installation and inadequate temporary structure and then lead to the failure of
the adjacent parts. As the chain destruction carries on, it will eventually lead to the loss of bearing capacity of the masonry arch bridge and then result in partial collapse or even a progressive collapse. American Society of Civil Engineer (ASCE) defines progressive collapse as “the spread of an initial local failure from element to element, eventually resulting in the collapse of an entire structure or a disproportionately large part of it” [3]. Taciroglu et al. developed an arbitrary Lagrangian Eulerian method for regressing solid domains and interface tracking [4]. Marjanishvili [5] presented four successively more sophisticated analysis procedures for evaluating the progressive collapse hazard, linear-elastic static; nonlinear static; linear-elastic dynamic; and nonlinear dynamic, and discussed the advantages and disadvantages of each method. Szyniszewski [6] from Florida University presented physics based collapse simulations of moment resisting steel frame buildings, with an emphasis on the development of energy flow relationships. Based on the background of Schoharie Creek Bridge collapse, Lebeau and Wadia-Fascetti [7] offered a detailed review of the events that resulted in this bridge
2
Mathematical Problems in Engineering
failure through the use of fault tree analysis. An accelerated Newton algorithm based on Krylov subspaces was applied to solving nonlinear equations of structural equilibrium by Scott and Fenves [8]. Lau and Wibowo [9, 10] carried out nonlinear analyses of reinforced concrete bridges by the Applied Element Method (AEM), studying the progressive collapse phenomenon of structures during earthquakes. Based on a sufficient investigation for the reason of the Mississippi River steel truss bridge collapsing on August 1, 2007, Astaneh-Asl et al. [11, 12] established three analytical models to simulate the collapse process of this bridge. Accurate stress analysis on steel box girder of long span suspension bridges based on multiscale submodeling method in order to decrease computational complexity of complicated bridges was proposed [13]. In China, there are many aging masonry arch bridges as well and they need prompt inspection, reinforcement, and maintenance. Many studies focused on the progressive collapse and clarified that local deficiencies may trigger collapse [2]. However, there are few researches on how to simulate the progressive collapse process of the masonry arch bridges. There are also few researches about how to use large deformation elements to simulate geometric nonlinearity properties during bridge collapse. In this research, it is intended to develop a new large deformation element, which can be used for analyzing the collapse process of masonry arch bridge. A mathematical method for large deformation element was put forward by large deformation element. Meanwhile, computer-graphics technology, feature modeling, and finite element method were combined to develop Bridge Collapse Software System (BCSS) for the progressive collapse process simulation.
2. The Mathematical Methods for Dynamic Calculation for the Collapse Process of Masonry Arch Bridge 2.1. The Large Deformation Equation 2.1.1. Strain under Large Deformation. Object in Cartesian Coordinates will continuously change its configuration under an external force, as shown in Figure 1. At time 𝑡0 , the coordinate of 𝑃 is 0 𝑥𝑖 ; the coordinate of 𝑄 0 is 𝑥𝑖 + 𝑑0 𝑥𝑖 . At time 𝑡, the coordinate of 𝑃 is 𝑡 𝑥𝑖 ; the coordinate of 𝑄 is 𝑡 𝑥𝑖 + 𝑑𝑡 𝑥𝑖 , 𝑖 = 1, 2, 3. Regard the change of object configuration as a mathematic change from 0 𝑥𝑖 to 𝑡 𝑥𝑖 . For a certain time 𝑡, this transformation can be defined by 𝑡
𝑥𝑖 = 𝑡 𝑥𝑖 (0 𝑥1 , 0 𝑥2 , 0 𝑥3 ) .
(1)
According to the deformation continuity requirements, the change must be in one-to-one correspondence, namely, the transformation is single-valued continuous. Meanwhile this transformation should have unique inverse transformation;
namely, it has single-valued continuous inverse transformation, which can be shown as follows: 0
𝑥𝑖 = 0 𝑥𝑖 (𝑡 𝑥1 , 𝑡 𝑥2 , 𝑡 𝑥3 ) .
(2)
In the view of the definition above, 𝑑0 𝑥𝑖 and 𝑑𝑡 𝑥𝑖 can be written as 𝜕0 𝑥𝑖 𝑡 𝑑 𝑥𝑗 = 0𝑡 𝑥𝑖,𝑗 𝑑𝑡 𝑥𝑗 , 𝜕𝑡 𝑥𝑗
𝑑0 𝑥𝑖 =
𝜕𝑡 𝑥 𝑑 𝑥𝑖 = 0 𝑖 𝑑0 𝑥𝑗 = 0𝑖 𝑥𝑖,𝑗 𝑑0 𝑥𝑗 . 𝜕 𝑥𝑗
(3)
𝑡
Using the formula above, the distance of 𝑃 and 𝑄 at time 𝑡0 and time 𝑡 is 2
(0 𝑑𝑠) = 𝑑0 𝑥𝑖 𝑑0 𝑥𝑖 = 0𝑡 𝑥𝑖,𝑚 0𝑡 𝑥𝑖,𝑛 𝑑𝑡 𝑥𝑚 𝑑𝑡 𝑥𝑛 , 2
𝑡
𝑡
𝑡
( 𝑑𝑠) = 𝑑 𝑥𝑖 𝑑 𝑥𝑖 =
𝑡 𝑥 𝑡 𝑥 𝑑0 𝑥𝑚 𝑑0 𝑥𝑛 . 0 𝑖,𝑚 0 𝑖,𝑛
(4)
After deformation, the distance of the two points changed into 2
2
(𝑡 𝑑𝑠) − (0 𝑑𝑠) = (0𝑡 𝑥𝑘,𝑖 0𝑡 𝑥𝑘,𝑗 − 𝛿𝑖𝑗 ) 𝑑0 𝑥𝑖 𝑑0 𝑥𝑗 = 2 0𝑡 𝜀𝑖𝑗 𝑑0 𝑥𝑖 𝑑0 𝑥𝑗 , 2
2
(𝑡 𝑑𝑠) − (0 𝑑𝑠) = (𝛿𝑖𝑗 − 0𝑡 𝑥𝑘,𝑖 0𝑡 𝑥𝑘,𝑗 ) 𝑑𝑡 𝑥𝑖 𝑑𝑡 𝑥𝑗
(5)
= 2 𝑡𝑡 𝜀𝑖𝑗 𝑑𝑡 𝑥𝑖 𝑑𝑡 𝑥𝑗 . Equation (5) can be rewritten as 1 𝑡 ( 𝑥 𝑡 𝑥 − 𝛿𝑖𝑗 ) , 2 0 𝑘,𝑖 0 𝑘,𝑗
𝑡 𝜀 0 𝑖𝑗
=
𝑡 𝜀 𝑡 𝑖𝑗
1 = (𝛿𝑖𝑗 − 0𝑡 𝑥𝑘,𝑖 0𝑡 𝑥𝑘,𝑗 ) , 2
(6)
where 0𝑡 𝜀𝑖𝑗 is the Green-Lagrange strain tensor, which is defined by coordinate before, and 𝑡𝑡 𝜀𝑖𝑗 is the Almansi strain tensor, which is defined by coordinate after deformation. To obtain the relation between strain and displacement, the displacement field 𝑡 𝑢𝑖 is given by 𝑡
𝑢𝑖 = 𝑡 𝑥𝑖 − 0 𝑥𝑖 ,
(7)
where 𝑡 𝑢𝑖 is the displacement from configuration before deformation to configuration after deformation. We then have 𝑡 𝑥 0 𝑖𝑗
= 𝛿𝑖𝑗 + 0𝑡 𝑢𝑖,𝑗 ,
𝑡 𝜀 0 𝑖𝑗
= 𝛿𝑖𝑗 − 𝑡𝑡 𝑢𝑖,𝑗 .
(8)
Using (6) and (8) yields the relation between strain and displacement: 1 𝑡 ( 𝑢 + 𝑡𝑢 − 𝑡𝑢 𝑡𝑢 ) , 2 𝑡 𝑖,𝑗 𝑡 𝑗,𝑖 𝑡 𝑘,𝑖 𝑡 𝑘,𝑗
𝑡 𝜀 𝑡 𝑖𝑗
=
𝑡 𝜀 0 𝑖𝑗
1 = (0𝑡 𝑢𝑖,𝑗 + 0𝑡 𝑢𝑗,𝑖 + 0𝑡 𝑢𝑘,𝑖 0𝑡 𝑢𝑘,𝑗 ) . 2
(9)
Mathematical Problems in Engineering
3 P(t+Δt xi ) 0
x2 , t x2 , t+Δt x2
P(t xi ) t+Δt
P(0 xi ) 0
t
S t
S 0
V
S
t+Δt
V
t+Δt xi + dt+Δt xi ) V Q(
Configuration on t1 + Δt Q(t xi + dt xi )
Q(0 xi + d0 xi ) Configuration on t1
Configuration on t0 0
0
x1 , t x1 , t+Δt x1
x3 , t x3 , t+Δt x3
Figure 1: Geometrical nonlinear configuration.
0
x2 , t x2
0
t
R 0
0
S
t
Q
d x3
Q
t
P
P 0
0
dT
t
d t x1 0
t
S
d t x2 ( t x1 , t x2 , t x3 ) 0
( 0 x1 , 0 x2 , 0 x3 )
t
dT
R
x1 , t x1
x3 , t x3
Figure 2: Geometrical nonlinear strains.
When the displacement is very small, the quadratic term of displacement derivative can be ignored. This equation reduces to 𝑡 𝜀 0 𝑖𝑗
= 𝑡𝑡 𝜀𝑖𝑗 = 𝜀𝑖𝑗 .
(10)
Since (𝑡 𝑑𝑠)2 − (0 𝑑𝑠)2 = 0, we further obtain 𝑡 𝜀 0 𝑖𝑗
= 𝑡𝑡 𝜀𝑖𝑗 = 0.
(11)
Therefore, we conclude that the necessary and sufficient condition of an object doing rigid motion is that the components of the Green strain tensor and the Almansi strain tensor to be zero. 2.1.2. Stress under Large Deformation. In the large deformation problem, it is by cutting off a microelement from the deformed object that the equilibrium equation and its equivalent virtual work principle to be established. Accordingly we should cut off an element from the deformed object to define the stress tensor, that is, Euler stress tensor 𝑡 𝜏𝑖𝑗 , as shown in Figure 2.
If the Green strain tensor is defined by coordinates before deformation, then its corresponding stress tensor before deformation is required to be defined. Stress on the plane 𝑡 𝑡 𝑡 𝑡 𝑡 𝑡 𝑃 𝑄 𝑅 𝑆 after deformation is 𝑑𝑇/ 𝑑𝑆; and assume virtual 0 0 0 0 stress on the plane 𝑃 𝑄 𝑅 𝑆 before deformation is 0 𝑑𝑇/0 𝑑𝑆. In order to maintain the consistency of mathematics, there are usually two kinds of provisions for expressing the relationship between 0 𝑑𝑇 and 𝑡 𝑑𝑇, the schematic diagram is shown in Figure 3. (1) Lagrange Provision. The internal force on area element before deformation is equal to the internal force after deformation and reads 0
(𝐿) 𝑡 𝑑𝑇𝑖 = 𝑑𝑇𝑖 .
(12)
(2) Kirchhoff Provision. The transformation of internal force on area element before and after deformation is consistent with coordinate transformation and reads 0
(𝐾) 0 𝑡 𝑑𝑇𝑖 = 𝑡 𝑥𝑖,𝑗 𝑑𝑇𝑗 .
(13)
4
Mathematical Problems in Engineering 0
x2 , t x2
0
t
x2 , t x2 t
dT t
0
dT
dT = t dT
0
Lagrange provision
0
dT
dT
Kirchhoff provision
x1 , t x1
0
x1 , t x1
Figure 3: Geometrical nonlinear stresses.
Because 𝑡 𝜏𝑖𝑗 is the stress component of the configuration after deformation, define 𝑡
Using superelasticity representing such material properties in continuous medium mechanics yields
𝑡 𝑡 𝑑𝑇𝑖 = 𝜏𝑖𝑗 ]𝑗 𝑑𝑆, 0
Lagrange provision:
𝑑𝑇𝑖
(𝐿)
(𝐾)
= 0𝑡 𝑆𝑗𝑖 0 ]𝑗 0 𝑑𝑆 = 0𝑡 𝑥𝑖,𝑗 𝑡 𝑑𝑇𝑗 ,
=
𝑡 𝑇 0 ] 0 𝑑𝑆 0 𝑗𝑖 𝑗
𝑡 𝑆 0 𝑖𝑗 𝑡
= 𝑑𝑇𝑖 ,
(14)
Kirchhoff provision: 0
𝑑𝑇𝑖
where 𝑡 ]𝑗 is the direction cosine on area element before deformation; 0𝑡 𝑇𝑗𝑖 is the Lagrange strain tensor; 0𝑡 𝑆𝑗𝑖 is the Kirchhoff strain tensor; the left superscript 0 means that it is measured on configuration before deformation; and the left subscript 𝑡 means that it is measured on configuration after deformation. 2.1.3. Material Constitutive Relation under Large Deformation. As for small deformation and linear elasticity problem under isothermal and adiabatic conditions, the relationship between stress and strain can be described by the following three kinds of equivalent methods: 𝜎𝑖𝑗 = 𝐷𝑖𝑗𝑘𝑙 𝜀𝑘𝑙 , 𝜕𝑊 , 𝜕𝜀𝑖𝑗
1 𝑊 = 𝐷𝑖𝑗𝑘𝑙 𝜀𝑖𝑗 𝜀𝑘𝑙 , 2
(15)
𝑡 𝑆 0 𝑖𝑗
𝜕𝜀 = 𝐷𝑖𝑗𝑘𝑙 𝑘𝑙 . 𝜕𝑡 𝜕𝑡
𝑡 𝑆 0 𝑖𝑗
= 0𝑡 𝐷𝑖𝑗𝑘𝑙 0𝑡 𝜀𝑘𝑙 .
𝐷𝑖𝑗𝑘𝑙 = 𝐷𝑒 𝑖𝑗𝑘𝑙 − 0 𝐷𝑝 𝑖𝑗𝑘𝑙 .
𝑡+Δ𝑡 𝑉
=∫
(16)
= 0 𝐷𝑖𝑗𝑘𝑙 0𝑡 𝜀𝑘𝑙 ,
(18)
(19)
2.1.4. The Formation of the Control Equation of Geometric Nonlinearity and Virtual Displacement Principle. The coordinates and displacement of each point on the object at time 0: 0 𝑥𝑖 , 0 𝑢𝑖 . The coordinates and displacement of each point on the object at time 𝑡: 𝑡 𝑥𝑖 , 𝑡 𝑢𝑖 . The coordinates and displacement of each point on the object at time 𝑡 + Δ𝑡: 𝑡+Δ𝑡 𝑥𝑖 , 𝑡+Δ𝑡 𝑢𝑖 . The virtual displacement principle corresponding to the equilibrium condition of the configuration at time 𝑡 + Δ𝑡 can be written as 𝑡+Δ𝑡
For the small strain elastic problem, the stress and strain is a corresponding relation. In the condition of small strain, the relationship is linear; in the condition of large strain, the relation is nonlinear. That is,
(17)
where 0 𝐷𝑖𝑗𝑘𝑙 is tangent constitutive tensor on time 𝑡, referring to configuration on time 𝑡0 :
∫
𝜕𝜎𝑖𝑗
𝜕2𝑡 𝑊
, 𝜕0𝑡 𝜀𝑖𝑗 𝜕0𝑡 𝜀𝑖𝑗
where 0𝑡 𝑆𝑖𝑗 is Kirchhoff stress tensor, namely, the engineering stress; 0𝑡 𝜀𝑖𝑗 is Green strain tensor, namely, the engineering strain; 0𝑡 𝐷𝑖𝑗𝑘𝑙 is constant and elastic constitutive tensor; 𝑡 𝑊 is the strain energy function. If the materials are plastic, then
0
𝜎𝑖𝑗 =
= 0𝜌
𝑡+Δ𝑡
𝜏𝑖𝑗 𝛿𝑡+Δ𝑡 𝑒𝑖𝑗 𝑡+Δ𝑡 𝑑𝑉
𝑉
+∫
𝑡+Δ𝑡 𝑡+Δ𝑡 𝑑𝑆 𝑡+Δ𝑡 𝑡𝑘 𝛿𝑢𝑘
𝑡+Δ𝑡
𝑉
(20)
𝑡+Δ𝑡 𝑡+Δ𝑡 𝜌 𝑡+Δ𝑡 𝑑𝑉, 𝑡+Δ𝑡 𝑓𝑘 𝛿𝑢𝑘
where 𝛿𝑢𝑘 is the variation of the real displacement; 𝛿𝑡+Δ𝑡 𝑒𝑖𝑗 𝑡+Δ𝑡 is the variation of the strain; 𝑡+Δ𝑡 𝑡+Δ𝑡 𝑡𝑘 is the surface load
Mathematical Problems in Engineering
5 One element snap through
(a) A snap through element in abutment
One element snap through
(b) A snap through element in deck
Figure 4: Collapse simulations by small strain elements in BCSS.
measured in the real configuration; 𝑡+Δ𝑡 𝑡+Δ𝑡 𝑓 is volume load measured in the real configuration; 𝑡+Δ𝑡 𝜌 is the mass density of the real configuration. For total Lagrange Formulation, we have ∫
0𝑉
𝑡+Δ𝑡 𝑡+Δ𝑡 𝑆 𝛿 0 𝜀𝑖𝑗 0 𝑑𝑉 0 𝑖𝑗
(21)
=∫
0𝑆
0 𝑡+Δ𝑡 0 𝑡𝑘 𝛿𝑢𝑘 𝑑𝑆
+∫
0𝑉
0 𝜌𝑡+Δ𝑡
𝑓𝑘 𝛿𝑢𝑘 0 𝑑𝑉.
Notes: because OpenSees (the Open System for Earthquake Engineering simulation, is an object-oriented, open source software framework) uses the total Lagrange Formulation, the updated Lagrange formulation will not be discussed in detail. Disperse the solution domain by using isoparametric element; then the coordinates 0 𝑥𝑖 and displacement 𝑡 𝑢𝑖 of each element can be obtained by nodal value interpolation: 0
𝑛
𝑥𝑖 = ∑ 𝑁𝑘 0 𝑥𝑖 𝑘 , 𝑘=1
𝑡
𝑛
𝑥𝑖 = ∑ 𝑁𝑘 𝑡 𝑥𝑖 𝑘 ,
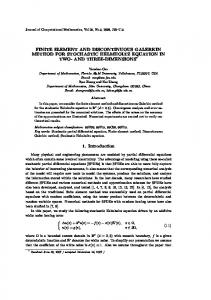
where 𝑢 is the displacement vector of the node; 0𝑡 𝐵𝐿 is the transformation matrix of the linear strain displacement; 𝑡 0 𝐵𝑁𝐿 is the transformation matrix of the nonlinear strain displacement; 0 𝐷 is the material constitutive matrix; 0𝑡 𝑆 is the Kirchhoff strain matrix. 2.2. Geometric Nonlinear Finite Element Theory and Its Realization 2.2.1. Tentative Simulation of Small Strain Elements. Considering the computational cost, bbarBrick Element in OpenSees was applied to simulate the progressive collapse of bridge based on reduced integration. bbarBrick does not work because it cannot be applied under large deflection or large rotation, such as “snap through.” The process of bridge progressive collapse is the geometrically nonlinear problems with large rotation. On Figures 4(a) and 4(b), an element in the abutment at the beginning of collapsing and another element in deck at the end of collapsing have large rotation and “snap through,” which leads to the calculation results being distorted. We conclude that using small strain element cannot simulate geometrical nonlinear problems in the process of bridge collapse.
𝑘=1
𝑡+Δ𝑡
𝑛
𝑥𝑖 = ∑ 𝑁𝑘 𝑡+Δ𝑡 𝑥𝑖 𝑘 ,
(22)
𝑘=1
𝑡
𝑛
𝑢𝑖 = ∑ 𝑁𝑘 𝑡 𝑢𝑖 𝑘 , 𝑘=1
𝑡+Δ𝑡
𝑛
𝑢𝑖 = ∑ 𝑁𝑘 𝑘=1
𝑡+Δ𝑡
3. Feature Modeling Method of Bridge Components
𝑘
𝑢𝑖 .
Then analyze an element by using the total Lagrange Formulation, so that we finally obtain (0𝑡 𝐾𝐿 + 0𝑡 𝐾𝑁𝐿 ) 𝑢 = 𝑡+Δ𝑡 𝑄 − 0𝑡 𝐹, 𝑡 0 𝐾𝐿
= ∑∫
𝑡 𝑇 𝑡 0 0 𝐵𝐿 0 𝐷 0 𝐵𝐿 𝑑𝑉,
𝑡 0 𝐾𝑁𝐿
= ∑∫
𝑡 𝑇 𝑡 𝑡 0 0 𝐵𝑁𝐿 0 𝑆 0 𝐵𝑁𝐿 𝑑𝑉,
𝑡 0𝐹
= ∑∫
𝑡 𝑇 𝑡 ̂0 0 𝐵𝐿 0 𝑆 𝑑𝑉,
0𝑉
0𝑉
0𝑉
2.2.2. Collapse Simulation of Large Strain Elements. By using the mathematical methods mentioned in Section 2.1 and doing a secondary development of TLFD8nBrick element in OpenSees, a finite element that can calculate large deformation problems is established, as shown in Figure 5.
(23)
The feature modeling provides a rapid method for parameterization of bridge models, through which a parametric model for bridges can be set up; and influencing factors analysis of bridge collapse can be carried out easily. The Object Oriented Program (OOP) was used to represent bridge elements. 3.1. Sections Organized by Feature Parameters. An arch bridge can be regarded as a collection of various types of components, and every component can be stretched by one or more bridge sections. A section can be defined by changing the characteristic parameters which are familiar to engineers, such as the roof thickness of box-type section, web thickness, and floor thickness and flange length. Engineers can input
6
Mathematical Problems in Engineering
(a) Initial failure
(b) No snap through element during collapsing
W2
=
−
H6
H5
a, b
CL
H
DL
H4
DS H3
H1
H2
Figure 5: Collapse simulations by large strain elements in BCSS.
CR
DR
Section class
−
−
=
c, d B1
DX
W1 −
BW
B2
=
Figure 7: Definition of hollow sections with Boolean operation.
Figure 6: A single-box dual-room section using feature parameter methods.
few relevant parameters to complete fast the modeling of typical section, as shown in Figure 6. And so the map between feature parameters and geometry coordinates has been created. There are many component section types in actual project. Each section has its unique mapping relationship from feature parameters to three-dimensional coordinate. Moreover, each section class has public functions or the methods, such as area calculation, reasonable judgment, section translation, section rotation, and eccentric conversion. And so a base class (parent class) supporting public functions or methods are established. Each section class (child class) of different types may call the methods and functions of the base class conveniently. 3.2. Geometric Graphics Description Based on Binary SpacePartitioning (BSP) Trees. A section is encircled by several directed edges, according to which its binary spacepartitioning (BSP) tree can be constructed. The commonly used method to construct a BSP tree for a section is to create a series of nodes, making each node represent a partition line that contains an edge of the section. Other polygon edges are separated by the partition line in the position of the nodes. The section geometric graphics definition is carried out by the Boolean operation on the section. By using difference operation, one of the Boolean operations, a section with hole can be defined conveniently, which provides a convenient and visual representation approach for the box section, a wildly used section in bridge engineering. Figure 7 shows the process of outside region subtract inside region(s), the purpose of Boolean subtract operation
is to make a description and definition for the general box section and hollow section. Let 𝑃 and 𝑄 be two polygons in 2D space. The difference of polygons 𝑃 and 𝑄, means 𝑄 is subtracted from 𝑃, which is denoted as 𝑃 \ 𝑄. And define ¬𝑄 as taking negation of 𝑄. Thus the calculation formula can be written as follows: 𝑃 \ 𝑄 = 𝑃 ∩ ¬𝑄.
(24)
Take the quadrilateral section EFGD in Figure 8 as an example. Now it is needed to add a quadrilateral hole efgd in its internal. The BSP tree of this section after digging a hole is as shown in Figure 8. As is shown in Figure 8, the operation of digging a quadrilateral hole efgd in section EFGD is, in fact, taking 𝐶4 as a new 2D spatial region and then partitioning this region using quadrilateral section efgd. Accordingly, the BSP tree is to add more new nodes on the basis of the original one. According to formula 𝑃 \ 𝑄 = 𝑃 ∩ ¬𝑄, where 𝑃 is the section EFGD and 𝑄 is the hole efgd, thus ¬𝑄 is to do negation of section efgd, that is, changing directions of the directed edges. As Figure 8 shows, the direction of the directed edges of section efgd is already opposite to the one of section EFGD. On the basis of the right-hand rule, we can get the section with hole 𝐶4 ∩ 𝐶5 ∩ 𝐶6 ∩ 𝐶7 , and from the BSP tree of this section we can see 𝐶4 , 𝐶5 , 𝐶6 , and 𝐶7 are on the negative side, which is consistent with Figure 8(a). Examples of box section by “1 box and 3 rooms” and box section by “2 box and 1 room” in graphic platform are shown in Figure 9. 3.3. Forming a 3D Model by Projection. According to the modeling process, the cross wall will be built after
Mathematical Problems in Engineering
7
P0 C1
C0
P1
+
F
E
C4
P2
−
C1 e
P5
C5
+ P7
C7
− P2
C2
C6
D
P4 −
+
C4
P5 + P6
−
+
+
C2 C3
+
G
− C7
C8
(a)
− −
P7 P3
−
+ C3
P6
g
P3
P0
d C8
−
+
+ −
f
P4
P1
+
C0
−
+
−
+
C5
C6
(b)
Figure 8: The BSP tree of this hollow section. Stress level (MPa) 250 200 150 100 50
Stress level (MPa) 250 200 150 100 50
(a) “1-box and 3-room” girder section
(b) “2-box and 1-room” girder section
Figure 9: The display examples in BCSS.
the formation of the main arch ring. Since the cross wall is attached to the main arch, the bottom surface of each cross wall and the top surface of the main arch ring must be coplanar. And it is based on these surfaces that every 3D model of bridges including the cross wall can be formed. Make projections perpendicular to the horizontal plane for these surfaces to a specified height to the projection plane and then establish the cross wall model through connecting the top surfaces and the projection planes. To make projection of an objective plane onto assigned plane is essential to get the projection of the vertices of the objective plane onto the assigned plane. That is to say, when you get all of the projection of the vertices, you get the projection of the objective plane. In order to obtain the projection of 𝑃 onto the plane 𝑆, define the vector of plane 𝑆 as 𝑆 ⋅ 𝑛⃗ + 𝑑 = 0, where ⃗ 𝑦, 𝑧), as shown in Figure 10. 𝑆(𝑎, 𝑏, 𝑐), 𝑛(𝑥, In the picture, 𝑃 is the projection of 𝑃 onto plane 𝑆. The line 𝑃𝑃 connecting 𝑃 and its projection 𝑃 , by definition, are parallel to the normal vector 𝑛⃗ of the plane 𝑆.
→
P
n
r S
p
Figure 10: The projection of point 𝑃 onto plane 𝑆.
Let the length of 𝑃𝑃 be 𝑟. We obtain 𝑚⃗ = 𝑃 − 𝑃 , 𝑚⃗ = 𝑟 ⋅ 𝑛̂ (̂ 𝑛=
𝑛⃗ ‖𝑛‖⃗ = √2 𝑥2 + 𝑦2 + 𝑧2 ) . ‖𝑛‖⃗
(25)
8
Mathematical Problems in Engineering Projection plane
Objective plane
YX
Stress level (MPa) 250 200 150 100 50
Z
Figure 11: The 3D model established by projection in BCSS.
Y Z
X (a) Box girder model
So we have
𝑃 = 𝑃 − 𝑟 ⋅ 𝑛.⃗
(26)
As can be seen from the formulas above, the algorithms needed to add in program designing mainly include vector unitization, the distance of two points, product of two vectors, and direction vector of plane. The direction vector of plane can be obtained by product of two different direction vectors in plane. That is, selecting two arbitrary edges in plane, by which we have two vectors to do their product, and the result is the direction vector of the plane. After getting the projection of the objective plane onto assigned plane, the projection plane is formed, and then its 3D Solid Model can be established on the basis of the two planes. As shown in Figure 11, the standard plane is a torus, which is in the XOY plane. And the projection plane is created by three points: 𝑃1 = (10, 0, 0), 𝑃2 = (0, 10, 0), and 𝑃3 = (0, 0, 10). Figure 12 shows the 3D model of box girder and arch by projection. 3.4. Organization Form of Master-Slave Component. Arch bridges are a collection of various types of components, and the process of establishing the arch bridge model is also the organization of these components. There are three basic organizations that have been utilized in the design of organization for bridge components: master-slave; separate executive for each component; and symmetric or anonymous treatment of all components. For most bridge components, the first organization is availably operated in the master-slave mode. This type is certainly the easiest to implement and may often be produced by making relatively simple extensions to an organization that includes full multiprogramming capabilities. Therefore we need to establish the feature dependence graph between master and slave which includes following two aspects. (1) Constraints on Geometry of All Components. Each component model needs to be organized to connect with each other. Constraints are created between master and slave by position in space, as shown in Figure 13. (2) Form a Computable 3D Model. For general finite element calculation program, the model entities are required
Stress level (MPa) 250 200 150 100 50
Y X
(b) Arch model
Figure 12: The 3D models by projection in BCSS.
numbering the element and nodes. And the connection between component and component reacts in the node coupling between two components, as shown in Figure 14. For so many arch bridge components, slave components are attached to one or more master components by position or geometry parameters. The master-slave component diagram can be established as in Figure 15. In Figure 15, G1, G2 are the highest levels of master component, and G3, G4, G5, G6, and G7 on the second layer exist depending on the G1 and G2, which are slave components of G1 and G2. And G8∼G17 on the third layer are slave components of G3∼G7. The lines in the graph represent feature dependence graph between masters and slave. A slave component has feature dependence graph with one or more master components.
4. Development of Bridge Collapse Simulation Software System Bridge collapse simulation software system (BCSS) is developed by C# and OpenGL. C# is a massively popular programming language used by many thousands of software developers all over the world. The OpenGL graphics system is a software interface to graphics hardware. (The GL stands for Graphics Library.) It allows programmers to create interactive programs that produce color images of moving
Mathematical Problems in Engineering
9
Figure 13: Constraints on geometry of all components.
3 1
2
1
2
1
3
9 11 13 15 5 7 17
19
4
5
6
7
8
9
10 11
2 1
21
12
14 15 16 17 18 19 20 21 22 23 24
13
2 4 6 8 10 12 14 16 18 20 22
Figure 14: The organization of node coupling.
G2
G1
G3
G8
G4
G9
G5
G10 G11 G12
···
G6
G13 G14
G7 · · ·
G15
G16 G17 · · ·
Figure 15: The master-slave component diagram.
The axis shape of bridge components The materials of bridge components
Forming 3D feature models by projection
Bridge sections
Export calculation file for OpenSees Calculate by OpenSees after secondary development
Sections at CAD system
Section liberary
Figure 17: Elevation of Dixituojiang Bridge.
Export calculation result files Visual process of bridge collapse
5. Application Examples At 4:00 p.m. on June 13, 2007, the Dixituojiang Bridge under construction collapsed suddenly in Fenghuang County of Hunan Province, China, and 59 people were killed. The full length of the Dixituojiang Bridge is 328.5 m. And it has four holes, each of which is 65 m in span length. The lane width of the bridge is 12 m. The main arch is equal in the cross section, and the type of curve is catenary. The rise-span ratio of main arch is 1/5, the arch-axis coefficient is 2.514, and the thickness is 1.35 m. There are seven Associate Arches on the top of each main arch. The span of Associate Arch is 5 m, and the rise-span ratio is 1/5. The thickness of the Associate Arch is 0.4 m. It is also the equal section component, and the type of curve is arc curve. The thickness of the cross wall is 1.1 m. The elevation of Dixituojiang Bridge is shown in Figure 17. The main arch is composed of No. 20 pebble and No. 60 rubble. The Associate Arch is composed by No. 12.5 mortar and No. 30 dressed stone. The No. 12.5 mortar and No. 30 stone are applied to bricklaying of the cross wall.
Figure 16: Steps on collapse simulation using BCSS.
three-dimensional objects. With OpenGL, programmers can control computer-graphics technology to produce realistic pictures or ones that depart from reality in imaginative ways. BSCC includes feature modeling module and bridge collapse visualization module, as shown in Figure 16.
5.1. Feature Modeling for Masonry Arch Bridge. According to the characteristics of masonry arch bridge components, this feature modeling is divided into three modules: the module of main arch, the module of cross wall and spandrel arch, and the module of abutment and foundation. Take Dixituojiang Bridge as an example, the design parameters of each module are as shown in Table 1.
10
Mathematical Problems in Engineering
Z X
Y
Figure 18: The 3D solid simulation model of Dixituojiang Bridge in BSCC.
Table 1: The material parameters of Dixituojiang Bridge. Components
Bulk modulus (Mpa)
Shear modulus (MPa)
Density (kg/m3 )
Main arch Cross wall Spandrel arch Bridge pier Floor system
11078 6083 6083 9380 6083
5539 3042 3042 4690 3042
2400 2400 2400 2400 2400
With the material parameters above, a 3D FEM model of Dixituojiang Bridge is established by feature modeling method, as shown in Figure 18. 5.2. The Collapse Process and Analysis of the Results. By the cause analysis of the accident: the bridge piers adopting spread foundation stand out in the slightly weathered rock. When providing vertical stress, the foundation can only partially constrain the displacement in the horizontal direction of bridge pier. When the horizontal thrust exceeds the allowable value, the pier may have lateral displacement or even overturn, which is different from fixed constraint. Therefore, in order to ensure the accuracy of the analysis, the zero-length contact element was set between nodes in foundation and in the bottom of the pier. Due to the geometric nonlinear element analysis, and setting zero-length contact element to simulate the boundary of the pier and the foundation, and adopting the birth and death element technology in the process of analysis, all of which lead to the analysis having extremely strong nonlinearity. The meshes of the original model are transversely coarsened, the final model is divided into 30,356 8-node hexahedral elements, and set 24 zero-length contact elements on the right side of the contact surface between the pier and ground, totally has 51086 nodes. The model sets up 950 calculation
steps, and each step is 0.008 s. Before the first arch collapsed, 0.15 cm displacement is applied to the left abutment for each iteration step. Considering the low quality of No. 1 main arch in construction, the ultimate tensile strain and ultimate compressive strain of No. 1 main arch should be reduced properly, where the former decreases 30% and the latter decreases about 20%. Meanwhile, set the rule that elements fail when 𝜀max > 3.5 × 10⁻² or 𝜀min < −4.0×10⁻³ ; for the other main arches, elements fail when 𝜀max > 5 × 10⁻² or 𝜀min < −5 × 10⁻³ . Then we can get the progressive collapse process similar with the actual situation, as shown in Figure 19. The simulation of collapse process suggests that the continuous arch effect caused by the failure of No. 1 main arch leads to the collapse of No. 2 and No. 3 main arches in succession, which is consistent with the actual collapse process. From Figures 19(a)–19(f), all of the bridge piers fall down towards the direction of No. 0 abutment, which is also consistent with the actual situation. About 𝑡 = 0.5 s, namely, the time when the displacement of the left abutment is nearly 8∼8.5 cm, the floor system and spandrel arch above the left skewback firstly occur tensile failure elements, and then the elements in the connecting part of the left skewback and the left abutment are killed, which suggests the structure internal force is redistributed for the first time, and then it is quickly reflected through killing the elements of the right skewback of the No. 1 main arch. Meanwhile there are also elements of other parts such as spandrel arch and floor system being killed. About 𝑡 = 0.9 s, most elements of the right skewback of No. 1 main arch are killed, and then No. 1 main arch begins to fall down. Then the rest main arches collapse in succession and eventually result in the whole bridge collapsed.
6. Conclusions This paper proposes a theoretic framework and finite element implementation on progressive collapse simulation of
Mathematical Problems in Engineering
11
(a) Initial failure is occurred on 𝑡 = 0.5 s
(b) The first main arch collapses on 𝑡 = 2.3 s
(c) The second main arch collapses on 𝑡 = 5.1 s
(d) The third main arch collapses on 𝑡 = 7.3 s
(e) The forth main arch collapses on 𝑡 = 7.8 s
(f) The whole bridge collapses on 𝑡 = 9.1 s
Figure 19: Collapse simulations for Dixituojiang Bridge in BCSS.
masonry arch bridge. A new large deformation element in OpenSees was developed, which can be used for analyzing the collapse process of masonry arch bridge. A mathematical method for large deformation element is put forward based on large deformation element. The feature model which allows families of bridge components to be specified using constraints on geometry and topology facilitate the modeling of complicated bridge. Geometric constraints are established in bridge components by feature dependence graph in the feature model for bridge. Results from our implementation show that the method can help to simulate the progressive collapse process of masonry arch bridge.
Conflict of Interests The authors declared that they have no conflict of interests to this work.
Acknowledgments This research is financially supported by the Zhejiang Provincial Natural Science Foundation of China (Grant no. LY13E080014). This support is gratefully acknowledged. Any opinions, findings, and conclusions or recommendations expressed in this material are those of authors.
References [1] K. Wardhana and F. C. Hadipriono, “Analysis of recent bridge failures in the United States,” Journal of Performance of Constructed Facilities, vol. 17, no. 3, pp. 144–150, 2003. [2] Z. Xu, X. Lu, H. Guan, X. Lu, and A. Ren, “Progressive-collapse simulation and critical region identification of a stone arch bridge,” Journal of Performance of Constructed Facilities, vol. 27, no. 1, pp. 43–52, 2013. [3] ASCE, “Minimum design loads for buildings and other structures,” ASCE 7-05, 2005. [4] E. Taciroglu, A. Acharya, A. Namazifard, and I. D. Parsons, “Arbitrary Lagrangian-Eulerian methods for analysis of regressing solid domains and interface tracking,” Computers & Structures, vol. 87, no. 5-6, pp. 355–367, 2009. [5] S. M. Marjanishvili, “Progressive analysis procedure for progressive collapse,” Journal of Performance of Constructed Facilities, vol. 18, no. 2, pp. 79–85, 2004. [6] S. Szyniszewski, “Dynamic energy based method for progressive collapse analysis,” in Proceedings of the Structures Congress: Don’t Mess with Structural Engineers: Expanding Our Role, pp. 1–10, Austin, Tex, USA, April-May 2009. [7] K. H. Lebeau and S. J. Wadia-Fascetti, “Fault tree analysis of schoharie creek bridge collapse,” Journal of Performance of Constructed Facilities, vol. 21, no. 4, pp. 320–326, 2007. [8] M. H. Scott and G. L. Fenves, “Krylov subspace accelerated newton algorithm: application to dynamic progressive collapse
12
[9]
[10]
[11]
[12] [13]
Mathematical Problems in Engineering simulation of frames,” Journal of Structural Engineering, vol. 136, no. 5, pp. 473–480, 2010. H. Wibowo, S. S. Reshotkina, and D. T. Lau, “Modeling progressive collapse of RC bridges during earthquakes,” in Proceedings of the CSCE Annual General Conference, GC-176-1- GC-176-10, May 2009. A. Colombo and P. Negro, “Seismic progressive collapse analysis of reinforced concrete bridges by applied element method,” in Earth and Space 2010: Engineering, Science, Construction, and Operations in Challenging Environments, vol. 27, pp. 3019–3026, American Society of Civil Engineers, Reston, Va, USA, 2010. A. Astaneh-Asl, “Progressive collapse of steel Truss bridges, the case of I-35W collapse,” in Proceedings of the 7th International Conference on Steel Bridges, pp. 1–10, Guimar˘aes, Portugal, 2008. S. Hao, “A note of the I-35W bridge collapse,” Journal of Bridge Engineering, vol. 15, no. 5, pp. 608–614, 2010. H. Wang, A. Li, R. Hu, and J. Li, “Accurate stress analysis on steel box girder of long span suspension bridges based on multi-scale submodeling method,” Advances in Structural Engineering, vol. 13, no. 4, pp. 727–740, 2010.
Advances in
Operations Research Hindawi Publishing Corporation http://www.hindawi.com
Volume 2014
Advances in
Decision Sciences Hindawi Publishing Corporation http://www.hindawi.com
Volume 2014
Journal of
Applied Mathematics
Algebra
Hindawi Publishing Corporation http://www.hindawi.com
Hindawi Publishing Corporation http://www.hindawi.com
Volume 2014
Journal of
Probability and Statistics Volume 2014
The Scientific World Journal Hindawi Publishing Corporation http://www.hindawi.com
Hindawi Publishing Corporation http://www.hindawi.com
Volume 2014
International Journal of
Differential Equations Hindawi Publishing Corporation http://www.hindawi.com
Volume 2014
Volume 2014
Submit your manuscripts at http://www.hindawi.com International Journal of
Advances in
Combinatorics Hindawi Publishing Corporation http://www.hindawi.com
Mathematical Physics Hindawi Publishing Corporation http://www.hindawi.com
Volume 2014
Journal of
Complex Analysis Hindawi Publishing Corporation http://www.hindawi.com
Volume 2014
International Journal of Mathematics and Mathematical Sciences
Mathematical Problems in Engineering
Journal of
Mathematics Hindawi Publishing Corporation http://www.hindawi.com
Volume 2014
Hindawi Publishing Corporation http://www.hindawi.com
Volume 2014
Volume 2014
Hindawi Publishing Corporation http://www.hindawi.com
Volume 2014
Discrete Mathematics
Journal of
Volume 2014
Hindawi Publishing Corporation http://www.hindawi.com
Discrete Dynamics in Nature and Society
Journal of
Function Spaces Hindawi Publishing Corporation http://www.hindawi.com
Abstract and Applied Analysis
Volume 2014
Hindawi Publishing Corporation http://www.hindawi.com
Volume 2014
Hindawi Publishing Corporation http://www.hindawi.com
Volume 2014
International Journal of
Journal of
Stochastic Analysis
Optimization
Hindawi Publishing Corporation http://www.hindawi.com
Hindawi Publishing Corporation http://www.hindawi.com
Volume 2014
Volume 2014