THE JOURNAL CHEMICAL PHYSICS 125,125 204906 共2006兲 First publ. in: The OF Journal of Chemical Physics (2006), 204906
Thermosensitive core-shell particles as model systems for studying the flow behavior of concentrated colloidal dispersions J. J. Crassous, M. Siebenbürger, and M. Ballauffa兲 Physikalische Chemie 1,University of Bayreuth, 95440 Bayreuth, Germany
M. Drechsler Makromolekulare Chemie II, University of Bayreuth, 95440 Bayreuth, Germany
O. Henrich and M. Fuchsb兲 Fachbereich Physik, Universitat Konstanz, 78457 Konstanz, Germany
共Received 13 June 2006; accepted 4 October 2006; published online 27 November 2006兲 We report on a comprehensive investigation of the flow behavior of colloidal thermosensitive core-shell particles at high densities. The particles consist of a solid core of poly共styrene兲 onto which a network of cross-linked poly共N-isopropylacrylamide兲 is affixed. Immersed in water the shell of these particles will swell if the temperature is low. Raising the temperature above 32 ° C leads to a volume transition within this shell which leads to a marked shrinking of the shell. The particles have well-defined core-shell structure and a narrow size distribution. The remaining electrostatic interactions due to a small number of charges affixed to the core particles can be screened by adding 0.05M KCl to the suspensions. Below the lower critical solution temperature at 32 ° C the particles are purely repulsive. Above this transition, a thermoreversible coagulation takes place. Lowering the temperature again leads to full dissociation of the aggregates formed by this process. The particles crystallize for effective volume fractions between 0.48 and 0.55. The crystallites can be molten by shear in order to reach a fluid sample again. The reduced shear stress measured in this metastable disordered state was found to be a unique function of the shear rate and the effective volume fraction. These reduced flow curves thus obtained can be described quantitatively by the theory of Fuchs and Cates 关Phys. Rev. Lett. 89, 248304 共2002兲兴 which is based on the mode-coupling theory of the glass transition. 关DOI: 10.1063/1.2374886兴 I. INTRODUCTION
Gels composed of cross-linked poly共N-isopropylacrylamide兲 共PNIPAM兲 chains can undergo a phase transition as a function of temperature in which the network shrinks in a continuous or discontinuous fashion. The volume transition in macroscopic networks has been studied extensively by Shibayama et al.1 and Shibayama and Tanaka.2 A review on work done on these macroscopic systems was given some time ago by Shibayama.3 Starting with early work by Tanaka et al.,4 many groups have developed syntheses of colloidal thermosensitive network by, e.g., emulsion polymerization. Two types of particles can be prepared: either the particles consist totally of a PNIPAM network5–12 or the PNIPAM-network is polymerized onto a solid core.14–19 A great number of possible applications have been discussed for these systems that include widely separate fields as, e.g., protein adsorption.20,21 They have also been recently used as a template for the reduction of metal nanoparticles22–24 for applications in catalysis.23,24 A comprehensive review on the applications was given by Nayak and Lyon.25 a兲
Author to whom correspondence should be addressed. Electronic mail:
[email protected] b兲 Electronic mail:
[email protected]
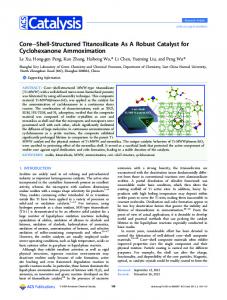
Recently, these thermosensitive core-shell particles have attracted renewed interest as model colloids, in particular, for a comprehensive study of the structure, dynamics, and flow behavior of concentrated suspensions.26–34 Figure 1 displays the overall structure and the volume transition of these particles in a schematic fashion: immersed in water the PNIPAM-shell of the particles will swell if the temperature is low. However, raising the temperature in the system beyond 32 ° C leads to a volume transition in which the network in the shell shrinks by expelling water. Thus, the effective volume fraction eff determining the hydrodynamic volume of the particles can be adjusted through the temperature in the system. Hence, dense suspensions can be achieved out of a rather dilute state by lowering the temperature. Senff et al. were the first to present investigations of the rheology of such core-shell particles.27 The advantages of these thermosensitive particles over the classical hard sphere particles used in previous investigations35,36 of the flow behavior are at hand. The dense suspension is generated in situ thus avoiding shear and mechanical deformations during preparation and filling into a rheometric device. Also, all previous history caused by shearing the suspension can simply be erased by raising the temperature and thus lowering the volume fraction again. The high volume fraction can then be adjusted again and a pristine sample being in full equilibrium at all length scales can be generated. Senff et al.27
125, 204906-1 Konstanzer Online-Publikations-System (KOPS) URL: http://www.ub.uni-konstanz.de/kops/volltexte/2007/3834/ URN: http://nbn-resolving.de/urn:nbn:de:bsz:352-opus-38348 Downloaded 21 Sep 2007 to 134.34.200.42. Redistribution subject to AIP license or copyright, see http://jcp.aip.org/jcp/copyright.jsp
0021-9606/2006/125共20兲/204906/11/$23.00
204906-2
J. Chem. Phys. 125, 204906 共2006兲
Crassous et al.
particles in aqueous solution is investigated. Here we demonstrate that the particles interact in a purely repulsive manner for temperatures below the volume transition. The following section will present the flow curves obtained at high volume fractions. The final section will present the quantitative comparison of these data with the theory of Fuchs and Cates37 and Fuchs.38 A conclusion will be given at the end summarizing the main points of the comparison between theory and experiment. FIG. 1. Schematic representation of the volume transition in core-shell micronetworks: The polymer chains are affixed to the surface of the core which thus provides one boundary of the network. Swelling can only take place by moving the outer boundary. The analysis of the SAXS data shows that the volume transition in this system is less pronounced than in macrogels which can be traced back to the spatial constraint exerted by the core-shell morphology of the network 共Refs. 45 and 46兲.
showed that these “reversibly inflatable spheres” can be used to study the dependence of the viscosity on the shear rate ␥˙ . If the effective volume fraction of the particles is not too high, a first Newtonian region is observed if the shear rate ␥˙ is small. Here the viscosity 0 of the suspension measured in this first Newtonian regime can be significantly larger than s the one of the pure solvent. At higher shear rates, the perturbation of the microstructure of the suspension by the advective forces can no longer be restored by the Brownian motion of the particles. Hence, significant shear thinning will result in which the reduced viscosity / s is more and more lowered until one may speculate that a second Newtonian region is reached. Recently, the data of Senff et al.27 have been used to check the predictions of mode-coupling theory37,38 共MCT兲 for the flow behavior of concentrated suspensions.33,34 Good agreement was reached in this comparison employing schematic MCT models.33 Hence, this comparison suggests that the thermosensitive particles shown in Fig. 1 present an excellent model system for the study of the dynamics of suspensions in the vicinity of the glass transition. However, no fully quantitative comparison of theory37,38 and experiment including a discussion of the fit parameters could be done yet. In this contribution, we present a comprehensive study of the core-shell particles shown schematically in Fig. 1. First, we demonstrate that the thermosensitive core-shell particles present a well-defined model system which exhibits a fluid to crystal transition. This opens the opportunity to study the interplay of crystallization and shear melting. Recent work has shown that thermosensitive suspensions are indeed excellent model systems for the study of colloidal crystals.11,39,40 Then we demonstrate that flow curves up to effective volume fractions of 0.63 can be obtained. These data can then be used for a comparison with the theory of Fuchs and Cates,37 and Fuchs.38 A subsequent paper will be devoted to the comparison of the viscoelastic properties of these suspensions with theoretical models.34,41,42 This paper is organized as follows. The first section is devoted to a comprehensive characterization of the thermosensitive particles. In particular, the crystallization of the
II. EXPERIMENT A. Materials
N-isopropylacrylamide 共NIPA兲 共Aldrich兲, N , N⬘-methylenebisacrylamide 共BIS兲 共Fluka兲, sodium dodecyl sulfate 共SDS兲 共Fluka兲, and potassium peroxodisulfate 共KPS兲 共Fluka兲 were used as received. Styrene 共BASF兲 was washed with KOH and distilled prior to use. Water was purified using reverse osmosis 共MilliRO; Millipore兲 and ion exchange 共MilliQ; Millipore兲. The core-shell-type PS-NIPA particles were synthesized, purified, and characterized as described recently.18 B. Methods
Cryogenized transmission electron microscopy 共cryoTEM兲 was done as described recently.44 Dynamic light scattering 共DLS兲 was done using a Peters ALV 800 light scattering goniometer where the temperature was controlled with an accuracy of 0.1 ° C. The size distribution of the particles was analyzed by cryo-TEM. The electrophoretic mobility and the kinetic of the aggregation were measured with a Zetasizer Nano-ZS from Malvern with strict control of the temperature set by Peltier elements at 0.1 ° C. Photographs of the samples were taken with a Nikon Coolpix 990 in a dark room without filter. The flow curves of the suspensions have been investigated using a strain-controlled rotational rheometer RFS II from Rheometrics Scientific, equipped with a Couette system 共cup diameter: 34 mm, bob diameter: 32 mm, and bob length: 33 mm兲. Measurements have been performed on 10 ml solution and the temperature was set with an accuracy of 0.05 ° C. Polarized microscopy has been performed with a Leica DMRXE. Sample were filled into a 0.1 mm thick capillary thermostatted with an accuracy of 0.05 ° C. III. RESULTS AND DISCUSSION A. Synthesis and characterization of the particles
The synthesis of the core-shell particles proceeds in two steps.18 First a poly共styrene兲 core is synthesized by conventional emulsion polymerization. The core particles thus obtained are practically monodisperse and very well defined. However, due to the method of synthesis the cores bear a residual number of chemically bound charges on their surface. This problem must be kept in mind when discussing the interaction of the core-shell particles. In a second step the thermosensitive shell is polymerized at higher temperatures 共80 ° C兲 onto these core particles in a seeded emulsion polymerization. For the synthesis of the particles under consider-
Downloaded 21 Sep 2007 to 134.34.200.42. Redistribution subject to AIP license or copyright, see http://jcp.aip.org/jcp/copyright.jsp
204906-3
J. Chem. Phys. 125, 204906 共2006兲
Flow behavior of concentrated colloidal dispersions
TABLE I. Radius and polydispersity of the core and core-shell particles and temperature-dependent swelling ratio of the cross-linked PNIPAM network. T 共°C兲
Rcore 共nm兲
PD 共%兲
Rcore shell 共nm兲
PD 共%兲
共40 ° C兲
8 23 32
55.6a 52.0c, 55.7a 55.9a
¯ 9.4c ¯
123.0a 103.0c, 112.4a 87.3a
¯ 9.3c ¯
8.2b 6.0b 2.5b
Dynamic light scattering with 5 ⫻ 10−2M KCl. The swelling ratio is calculated as / 共40 ° C兲 = 共R共T兲3 − R3兲 / 共R共40 ° C兲3 − R3兲 with the polymer volume fraction in the shell, R the radius of the core from the cryo-TEM, R共T兲 the radius form the dynamic light scattering with 5 ⫻ 10−2M KCl, and R共40 ° C兲 the hydrodynamic radius from the dynamic light scattering at 40 ° C without addition of salt. c Cryo-TEM. a
b
ation here we used 2.5 Mol % of the cross-linker BIS. Again this synthesis is a conventional emulsion polymerization which is expected to lead to narrowly dispersed particles. The core-shell particles are cleansed by exhaustive ultrafiltration to remove possible traces of free polymer in the suspension.18 A comprehensive characterization of these particles has been done recently by a combination of small-angle x-ray scattering 共SAXS兲 and small-angle neutron scattering 共SANS兲.45,46 The main result of this work was to show that the shell of these core-shell particles is rather compact. This can be traced back to the method of polymerization. The second step in which the shell is generated is done at a high temperature in which water becomes a poor solvent for the PNIPAM chains. Thus, the shell is generated in the shrunken state which alleviates the process of cross-linking of the chains. Recently, we could demonstrate that cryo-TEM is a highly suitable method for the study of thermosensitive particles.44 For the analysis a suspension of the particles is shock frozen in liquid ethane. The water is supercooled by this procedure to form a glass and the particles can directly be viewed upon in situ. The analysis of the particles by cryoTEM reconfirmed the well-defined core-shell structure derived from scattering experiments.45,46 In particular, it demonstrated that the thermosensitive shell is compact indeed and may well be characterized by an outer radius.44 The cryo-TEM micrographs can also be used to determine the polydispersity of the core-shell particles as expressed through the ratio of the standard deviation and the mean radius. Table I gives the respective values as well as the radius of the core and core-shell particles determined by cryo-TEM and dynamic light scattering and the swelling ratios calculated at 8, 23, and 32 ° C. The buoyancy of the particles is mainly determined by the PS cores which have a higher density than the surrounding medium water. However, the rather small size of the particles prevents sedimentation and no concentration gradient due to the effect may interfere with the measurements. B. Interaction of the particles
An analysis of dilute suspensions by the zeta sizer demonstrates that the core particles have a zeta potential of −46 mV at room temperature 共25 ° C兲, whereas the core shell
has a zeta potential of −16 mV at room temperature and of −37 mV at 45 ° C. This effect has been already observed in previous studies of similar particles,14 for systems synthesized with a cationic initiator13,16,17 or for PNIPAM microgels.6 This is due to the residual charges originating from the synthesis of these particles and has been attributed to the remaining initiator fragments.6,14,16,17 The charges of the core particles will be preserved when polymerizing the shell onto these cores and lead to the observed electrophoretic mobility. They are very important for the synthesis of the particles. The charges ensure sufficient stabilization even at the high temperatures used for the second step in which the shell is affixed to the core.18 Additional experiments demonstrate that these charges may influence the interaction between the particles if the ionic strength is very low. This can be seen from the crystallization at low volume fractions where the particles cannot touch each other. In this case the Debye length is of the order of the thickness of the shell and the repulsive interaction is mainly of electrostatic origin. In order to avoid this effect, KC1 has been added to screen electrostatic interaction. Hence, the KC1 concentration was adjusted to 0.05M for all systems to be studied here. The Debye length calculated for this ionic strength is around 1.4 nm and thus considerably smaller than the shell of the particles at low temperatures. Hence, electrostatic repulsion should be negligible under these conditions. The full screening of electrostatic repulsion can also be seen from measurements done in highly dilute suspensions by DLS. Figure 2 displays the hydrodynamic radius RH as obtained by this method without salt and in presence of 0.05M KCl. First of all, both sets of data agree at temperatures below the volume transition within the thermosensitive shell 共T ⬍ 30 ° C兲. This demonstrates that the salt concentration used here does not influence the solvent quality of water for the PNIPAM network. However, there are marked differences between suspensions without and with salt. If the residual electrostatic interaction is screened by the added salt, the particles flocculate at temperatures above the volume transition. Salt-free suspensions, however, remain stable even at temperatures far above the volume transition as can be seen from Fig. 2. This is in full agreement with all previous investigations of these core-shell particles. Hence, the stability above the volume transition must be traced back to
Downloaded 21 Sep 2007 to 134.34.200.42. Redistribution subject to AIP license or copyright, see http://jcp.aip.org/jcp/copyright.jsp
204906-4
Crassous et al.
FIG. 2. Hydrodynamic radius of the core-shell latex vs temperature, as determined by dynamic light scattering. Without salt 共hollow symbols兲 the PNIPAM network shrinks upon heating and remains stable even at high temperature. With addition of salt 共5 ⫻ 10−2M KCl, full symbols兲 the particles coagulate above the temperature of the volume transition at 32 ° C. The hydrodynamic radius was found to decrease linearly as function of the temperature 共RH = −0.738T共°C兲 + 129, r2 = 0.989兲 from 13 to 22 ° C. The dashed line gives the average hydrodynamic radius used for the calculation of the effective volume fraction in this temperature range.
electrostatic interaction. If this interaction is screened, the particles become attractive above the volume transition in the network. Figure 2 furthermore demonstrates that the residual steric stabilization is quite helpful when studying the volume transition in the particles: RH is sharply diminished when approaching the transition temperature of 32 ° C. Previous investigations have demonstrated that the transition thus observed is fully reversible upon cooling, that is, the same values of RH are measured in a cooling run as well.18 This finding now is explained by the additional electrostatic repulsion operative in salt-free solutions. Screening this interaction leads to a purely steric interaction and the core-shell particles can be used as rather simple model colloids. However, all experiments must be done well below the temperature of the volume transition in order to avoid possible complications by the onset of attractive interaction. A systematic comparison of the hydrodynamic radii obtained at various temperatures can now be drawn to the overall size deriving from cryo-TEM micrographs.44 In general, DLS gives slightly higher values 共approximately 6%兲 for the overall size.44 However, the comparison presented recently44 demonstrated that RH presents a good measure for the size of the particles and provides the base for the calculation of the effective volume fraction eff. Evidently, this experiment suggests that the core-shell particles in presence of added salt can be switched from a purely repulsive interaction to attractive interaction by raising the temperature. It becomes possible to monitor not only the process of flocculation upon raising the temperature but also the process of dissociation of the particles when the
J. Chem. Phys. 125, 204906 共2006兲
FIG. 3. Reversible coagulation of a 2.5⫻ 10−3 wt % suspensions of thermosensitive particles in aqueous solutions. The residual electrostatic interaction has been screened by adding 0.05M KCl. Raising the temperature beyond the volume transition 共32 ° C兲 leads to the formation of aggregates as can be seen from the marked increase of RH measured by dynamic light scattering at 173° with the Zetasizer. However, these aggregates dissociate when lowering the temperature again to 32 ° C and the final value of RH agrees with the initial one. This demonstrates that the particles are purely repulsive below the temperature of the volume transition.
temperature is lowered again as already pointed out for PNIPAM microgels6 and for PS/PNIPAM core-shell.16,17 Figure 3 demonstrates that this breakup of the coagulated particles can be seen indeed. Here the hydrodynamic radius is measured by the Zetasizer that allows us to change the temperature of the suspension quickly enough. A salt concentration of 0.05M was adjusted to screen the electrostatic interaction. Figure 3 shows that raising the temperature from 25 to 32 ° C first lowers RH as is expected from Fig. 2. Raising T above 32 ° C, however, is followed by a marked increase of RH. This is due to the onset of flocculation that can be conveniently monitored by DLS as shown by Holthoff et al.47 and Kobayashi et al.48 Lowering T again is followed by a decrease of RH again. This demonstrates that the aggregates disassemble again. Moreover, the initial state is recovered when cooling down the suspension to the starting point of 25 ° C. Figure 3 hence demonstrates that both the aggregation as well as the dissociation of the aggregates may conveniently be monitored by DLS. Moreover, it shows that the particles are fully repulsive at low temperature even in absence of added salt. Hence, we conclude from this section that the particles are purely repulsive at temperatures below 30 ° C and the this repulsion is solely due to steric interaction.
C. Effective volume fraction and crystallization
The good agreement of the overall size determined by cryo-TEM as well as by DLS suggests to calculate the effective volume fraction eff from measured values of RH according to
Downloaded 21 Sep 2007 to 134.34.200.42. Redistribution subject to AIP license or copyright, see http://jcp.aip.org/jcp/copyright.jsp
204906-5
Flow behavior of concentrated colloidal dispersions
FIG. 4. Crystallization of the thermosensitive suspensions. The effective volume fractions are 共from the left to the right兲 0.505; 0.531; and 0.548. Samples have been quickly cooled down from 30 to 21 ° C and kept one month at this temperature. The phase boundaries have been indicated by the dashed lines for a better visibility.
eff =
冉 冊
4n 3 RH RH = c 3 R
J. Chem. Phys. 125, 204906 共2006兲
FIG. 5. Phase diagram of the thermosensitive suspension as obtained by direct observation 共see Fig. 4兲 after one month.
3
,
共1兲
where R is the core radius 关determined by cryo-TEM 共Ref. 44兲兴, n the particle number density, and c is the volume fraction of the cores in the system. The latter quantity can be obtained precisely from the weight concentration of the particles in the system and the mass fraction of poly共styrene兲 in the particles 共52.4%兲. The narrow size distribution of the core-shell particles 共see Table I兲 suggests that crystallization should take place around an effective volume fraction of approximately 0.49. Hence, approaching eff ⬇ 0.49 from below by lowering the temperature slowly should lead to the onset of crystallization 共cf. also Refs. 39 and 40兲. For studying this problem suspensions with weight concentrations ranging from 8.22 to 12.11 wt % have been prepared and heated to 30 ° C in order to destroy possible crystals that may have formed at room temperature. These suspensions are subsequently cooled down quickly to 21 ° C and kept at this temperature for a time of typically one month. Figure 4 displays three samples in the coexistence domain differing only in the effective volume fraction. Below eff = 0.48 samples do not show any Bragg reflections even after waiting for a prolonged time. Between eff = 0.48 and 0.55 samples exhibit marked Bragg reflections. Close inspection of the sample reveals that it consists of a crystalline phase in equilibrium with a fluid phase. Hence, raising eff to values above 0.48 leads to a biphasic system as expected. Hence, for all measurements of the flow curves these crystallites must be molten by sufficiently high shear.42,49–51 Figure 4 shows also that the study of the crystallization of the thermosensitive particles is partially hampered by the strong turbidity of the system. The refractive index of the core particles consisting of poly共styrene兲 is not matched by the suspending liquid water. Moreover, the density of the particles and their size is not high enough to ensure rapid sedimentation of the crystalline phase. Only after a long time sufficient phase separation has taken place to determine the volume fraction of the crystalline phase. These problems not-
withstanding an approximate phase diagram can be obtained which is shown in Fig. 5. Here the percentage of the crystalline phase in the two-phase system estimated from these observations is plotted against the effective volume fraction eff. The latter quantity was derived from the DLS data shown in Fig. 2. To avoid possible errors due to the small experimental uncertainty of RH, averaged values have been taken from this graph by approximating RH by a straight line 共see Fig. 2兲 in this region of temperatures. We reiterate that all suspensions used for this experiment contain 0.05M KCl. The point at which the first crystal is formed as well as the one where the isotropic phase vanishes can be estimated by a linear extrapolation of the data taken from the biphasic range.52,53 We obtained from Fig. 5 by linear regression for the volume fraction of freezing of 0.483± 0.007 and melting of 0.546± 0.007. Given various experimental errors, the problems of the precise determination of eff considering that no correction has been done on the radius of the particles, these values agree remarkably well with the established values for hard spheres, namely, 0.494 and 0.545 obtained by computer simulation.54 Polarizing microscopy can also be used to investigate the kinetics of crystallization.55 These experiments have been performed, for a concentration of 9.48 wt % 共see Fig. 6兲 and different temperatures. The sample has been first maintained
FIG. 6. Crystallization of a 9.48 wt % solution at different temperatures corresponding to different effective volume fractions 共from the left to right, ⌽eff = 0.49, 0.50, 0.51, 0.52, 0.53, and 0.54兲.
Downloaded 21 Sep 2007 to 134.34.200.42. Redistribution subject to AIP license or copyright, see http://jcp.aip.org/jcp/copyright.jsp
204906-6
Crassous et al.
at about 30 ° C in the capillary and then quickly cooled down to the temperature of investigation. The first crystals have been observed for ⌽eff = 0.50. Considering the time of observation of 1 h, this value presents a good agreement with the phase diagram. The onset of the crystallization is manifested by the apparition of large crystals growing on the walls of the capillary. At smaller temperature corresponding to higher ⌽eff most crystals are formed in bulk, the nucleation increases, whereas the size decreases. Above ⌽eff = 0.54 no crystal can be observed anymore by microscopy. Hence, we interpret this as indication that the thermosensitive core-shell particles behave as hard spheres when considering their crystallization. Moreover, the fact that these systems crystallize again points to the narrow size distribution 共see Table I兲. Concluding this section and the preceding one we can state that suspensions of the thermosensitive core-shell particles behave as it is expected for hard spheres. Crystallization is seen at the volume fractions expected for hard sphere interaction. Thus, the effective volume fraction of the particles as derived from their hydrodynamic radius RH provides the base for all further analysis. Quenching samples to effective volume fractions well above this range may still leads to small crystallites that must be molten by shear prior to measurements of the flow curves. This problem of shear melting will be addressed in the following section. D. Flow behavior 1. Linear viscoelastic behavior
The previous section has clearly revealed that the thermosensitive suspensions crystallize if the effective volume fraction eff is above 0.48. Moreover, visual inspection of the samples as a function of time suggests that the characteristic time needed for crystallization depends markedly on eff. This again is expected for a system of hard spheres. Since the present investigation aims at the flow behavior of fluid suspensions at high concentration, rheological measurements can be used to explore the kinetics of crystallization in further detail. The linear viscoelastic behavior is studied first. For this purpose the storage modulus G⬘ and the loss modulus G⬙ is measured from a suspension with 9.48 wt % at different temperatures, corresponding to different volume fractions eff. A deformation of 1% and a frequency of 1 Hz have been chosen. Additional measurements have shown that the linear viscoelastic regime is attained for these parameters. In order to destroy possible crystallites prior to these measurements, all suspensions were sheared first for 5 min with a shear rate of 100 s−1. In all cases to be reported here the time of observation was more than 1 h. At first an effective volume fraction eff = 0.48 was chosen that can be adjusted for this particular weight fraction by adjusting the temperature to 22 ° C. Here G⬘ Ⰶ G⬙ for the entire time of observation indicating a stable fluid phase. However, lowering the temperature of this suspension to 19 ° C leads first to G⬘ Ⰶ G⬙ which again suggests the absence of crystals in the system. The effective volume fraction at this temperature is eff = 0.51 and crystallization starts af-
J. Chem. Phys. 125, 204906 共2006兲
FIG. 7. Viscoelastic behavior of crystallizing suspensions vs glassy systems: The storage modulus G⬘ 共filled symbols兲 and the loss modulus G⬙ 共open symbols兲 are measured as a function of time in the linear viscoelastic regime at 1 Hz and 1% after 5 min of shearing at 100 s−1 for a crystallizing system 共circles兲 and a glassy system 共squares兲. The triangles refer to the liquid state. The circles to a volume fraction of 0.51 共two-phase regime兲 whereas the squares give the results for the glassy state 共eff = 0.64兲.
ter approximately 700 s. This can be seen from a marked increase of G⬘ as function of time as shown in Fig. 7. G⬙ goes through a slight maximum and finally decreases markedly so that G⬙ Ⰷ G⬙ in the final stage attained after approximately 1 h. The highest effective volume fraction 0.64 was reached by lowering the temperature to 8 ° C. Note that this very high volume fraction can easily be reached by adjusting the temperature. As already discussed in the Introduction, the increase of eff is slow on the time scale of local rearrangements and local equilibrium can be reached despite the fact that eff is above the volume fraction of random close packing 共0.64兲. Figure 7 demonstrates that G⬘ Ⰷ G⬙ as is expected for the solid state. Hence, we conclude that the rheological experiment shown in Fig. 7 corroborates all findings of the previous section. Crystallization takes place at sufficiently high volume fractions. However, the kinetics of crystallization depends markedly on eff as expected from previous investigations.50,51,56,57 The study of the viscoelastic behavior therefore gives direct information on the time scale in which the systems stays fluid or glassy. 2. Flow curves and shear melting
The study of the linear elastic behavior demonstrates that crystallization may intervene at time scales which are typical for rheological experiments necessary for measuring flow curves. Evidently, crystallization leads to a marked change of the flow behavior and must be excluded in a meaningful study of the flow curves. However, crystallites formed at sufficiently high concentrations may be shear melted. Figure 8 displays the shear stress as a function of the shear rate ␥˙ , that is, the flow curves of the suspensions. Parameter of the curves is the effective volume fraction. For all volume frac-
Downloaded 21 Sep 2007 to 134.34.200.42. Redistribution subject to AIP license or copyright, see http://jcp.aip.org/jcp/copyright.jsp
204906-7
J. Chem. Phys. 125, 204906 共2006兲
Flow behavior of concentrated colloidal dispersions
FIG. 8. Shear melting of crystallized suspensions. Shear stress as function of shear rate for a thermosensitive suspension containing 9.48 wt. % of the particles. The open symbols mark the measurements with increasing shear rate whereas the filled symbols show the results with decreasing shear rate. Parameter of the different curves is the temperature adjusting the effective volume fraction eff. The effective volume fractions eff are triangles up: 0.48, circles: 0.51, triangles down: 0.56, and squares: 0.63.
tions the solutions were aged for more than 1 h. Hence, we used the systems discussed in conjunction with Fig. 7. This means that the shear flow was started after crystallization has taken place for the intermediate volume fractions. The hollow symbols in Fig. 8 indicate flow curves measured by raising ␥˙ slowly 共5 s/point兲 from 0.02 to 1000 s−1 whereas filled symbols indicate the results obtained by slowly lowering the shear rate. In case of the fluid phase 共eff = 0.48兲 both sets of data agree and practically superimpose. The same holds true for the highest volume fraction studied here 共eff = 0.64兲. Figure 8 hence demonstrates that flow curves present meaningful data for the present system even at exceedingly high volume fractions. However, there is a strong hysteresis for the partially crystalline sample having an effective volume fraction eff = 0.51. A critical shear stress is obviously needed to shear melt the crystals and to attain a fluid state. Lowering the shear rate again then leads to a flow curve exhibiting a first Newtonian regime at sufficiently low ␥˙ . This result can be reproduced by increasing the shear rate again. Here the same data are obtained. Also, the same observations were made when adjusting the same effective volume fraction by a different concentration and temperature. This demonstrates that the flow curves represent fully reproducible data once the crystallites are molten by shear 共see also Ref. 49兲. IV. COMPARISON WITH THEORY A. MCT model of flow curves
The Newtonian or zero-shear viscosity 0 of our dispersions increases upon densification. While older theories had connected this increase with a divergence of 0 at maximal random packing 共viz., at random close packing, which lies
around ⬇ 0.64兲, more recent theories connect it to the rapid slowing down of the structural relaxation close to a glass transition. The latter transition has been observed, e.g., in dynamic light scattering experiments on colloidal hard spheres and lies around = 0.58,42,43,58–62 which is well below random close packing. This difference allows the intriguing study of driven glassy states, which left undisturbed would form an amorphous solid 共with inaccessibly high Newtonian viscosity兲, but might yield and flow under shearing, as local free volume still exists below random close packing. This possibility, and a transition of such yielding glasses to fluidlike states, where a finite zero-shear viscosity exists, is the central prediction of the theory by Fuchs and Cates33,34,37 and Fuchs.38 Access to the yielding glassy states and to the transition region requires fine control of the density, which can readily be achieved with the thermosensitive particles. Thus a test of the general MCT scenario of a transition between shear-thinning fluid and yielding solid states becomes possible using the core-shell particles. Anticipating future solutions of the microscopic MCT equations under shear,37,63 at present already schematic models exist that correctly capture the universal aspects close to the nonequilibrium transitions,33,34,38 but otherwise contain only a mimicry of the microscopic mechanisms active in the full MCT equations. Basic to the approach is that the slowing down of structural rearrangements close to vitrification is described by density correlation functions. Their equations of motion contain memory kernels that are found to decay equally slowly. This motivates in turn the approximation to express the memory kernels as polynomials of the density correlators, assuming that the latter are the dominant variables with slow dynamics. One obtains a self-consistent scheme for the functions of interest, the density correlators. In the most simple 共␥˙ 兲 model,38 a single “typical” density correlator schematic F12 ⌽共t兲, conveniently normalized according to ⌽共t → 0兲 = 1 − ⌫t 共with ⌫ the initial decay rate兲, obeys a Zwanzig-Mori memory equation,
再
˙ 共t兲 + ⌫ ⌽共t兲 + ⌽
冕
t
冎
˙ 共t⬘兲 = 0. dt⬘m共t − t⬘兲⌽
0
共2兲
The memory function m共t兲, as well as the generalized ␥˙ -dependent shear modulus, g共t兲, participate in the slow structural relaxation, and thus cannot be treated in Markovian approximation. Both describe stress fluctuations which become more sluggish together with density fluctuations, because slow structural rearrangements dominate all quantities. Rather, as theory surmises that they relax on the same time scale as the original correlator ⌽共t兲, a self-consistent approximation closing the equations of motion is made. In the 共␥˙ 兲 -model one sets F12 m共t兲 =
v1⌽共t兲 + v2⌽2共t兲 , 1 + 共␥˙ t兲2
g共t兲 = v⌽2共t兲.
共3兲
This model, for the quiescent case ␥˙ = 0, had been suggested by Götze64,65 in 1984, and describes the development
Downloaded 21 Sep 2007 to 134.34.200.42. Redistribution subject to AIP license or copyright, see http://jcp.aip.org/jcp/copyright.jsp
204906-8
J. Chem. Phys. 125, 204906 共2006兲
Crassous et al.
of slow structural relaxation upon increasing the coupling vertices vi 艌 0. Under shear it has been shown in Refs. 37, 38, and 63 that an explicit time dependence of the couplings in m共t兲 captures the loss of memory by shear advection. Shearing causes the memory functions to decay for long times, because fluctuations are advected to smaller wavelengths where small scale Brownian motion relaxes them. The first line in 共3兲 captures this time dependence. The second equation of 共3兲 retains the quadratic dependence of the generalized shear modulus on density fluctuations from the microscopic MCT approach,66,67 but simplifies it by considering only one density mode, and by neglecting 共for simplicity兲 a possible dependence of v on shear. Steady state shear stress under constant shearing and viscosity then follow via integrating up the generalized modulus,
= ␥˙ = ␥˙
冕
⬁
0
dtg共t兲 = ␥˙
冕
⬁
dtv⌽2共t兲.
共4兲
0
In generalization of the Green-Kubo relation from linear response theory 共which gives the Newtonian viscosity as time integral of the quiescent shear modulus兲, the nonlinear viscosity is obtained from a time integral over a sheardependent stress autocorrelation function. Derivation of such generalized Green-Kubo relations from the Smoluchowski equation for interacting Brownian particles63 is the basis for the mode coupling approximations reducing the generalized shear modulus to a polynomial of the density correlators. Former analysis of experimental data with the schematic 共␥˙ 兲 model33 used, instead of Eq. 共4兲, the expression F12 ⬁ = ␥˙ 兰0 dt⌽共t兲. This ansatz failed to capture the increase of transverse stress fluctuations when going deeper into the glass. An increase upon approaching random close packing had been predicted by Brady.68 While microscopic MCT calculations for a hard sphere dispersion give a strongly increasing shear modulus,34 this effect is not contained in the schematic density correlator ⌽共t兲. The parameter v in Eq. 共4兲 incorporates this strong rise of the transverse elastic contributions into a schematic model. Let us finally comment on the interpretation of time in Eqs. 共2兲–共4兲. In the theoretical approach, both ⌽共t兲 and g共t兲 are transient correlation functions describing the relaxation of initial equilibrium fluctuations into the stationary states. Integrating through the transients provides the steady state averages, like the stress in Eq. 共4兲. While theory finds that transient fluctuations always relax under shear into unique homogeneous amorphous states, real systems may either remain in metastable states if ␥˙ is too small to shear melt them or undergo phase transitions for specific thermodynamic parameters. In these circumstances, the theory cannot be applied. Thus, care needs to be taken in experiments, in order to prevent phase transitions and to shear melt arrested structures, before data can be recorded which the present theory can describe. B. Flow curves: Qualitative comparison
Section III has shown that flow curves can be obtained in a reproducible manner if the problem of crystallization is taken care of properly. Hence, these data provide a sound
base for the subsequent comparison with mode-coupling theory. Here we first demonstrate that all data can be presented in a generalized plot by proper normalization as suggested by theory.33,34,37,38,63 Theory predicts that the reduced 3 shear stress RH / kBT should be a unique function of the shear rate ␥˙ as expressed through the Peclet number Pe0. Pe0 2 is given by ␥˙ RH / D0 where D0 is the self-diffusion coefficient of the spheres in the dilute regime. D0 is given by the Stokes3 / kBT兲␥˙ with S the Einstein relation so that Pe0 = 共6SRH viscosity of the solvent. The theory applies for small Pe0, where the structural relaxation is affected by shearing but the neglected ordering transitions and solvent induced interactions presumably are of little importance. Rescaling the data as described eliminates the dependence of the hydrodynamic radius RH, and, for the system of 共almost兲 hard spheres under consideration, the reduced flow curves are characterized only by a single parameter, namely, the effective volume fraction eff. No other parameter as, e.g., the weight fraction should play a role. Figure 9 demonstrates that this is found indeed. Here the 3 / kBT is plotted against Pe0 for a reduced shear stress RH wide range of effective volume fractions given in the graph. Note that a similar eff has been adjusted through different weight concentrations and temperatures. Despite these differences in parameters the reduced flow curves coincide if the effective volume fractions are approximately the same. The small remaining discrepancy in the effective volume fraction can be traced back to changes in the softness of the particle related to the swelling ratio, which is changing by about a factor of 1.4 between 23 and 8 ° C 共Table I兲. Nevertheless it is important to point that the reduced flow curves for all the investigated concentrations and temperatures do not cross and present a continuous transition from the liquid to the glassy state although they are extremely sensitive toward small errors in RH. C. Flow curves: Quantitative comparison with MCT
Having verified that unique stationary flow curves can be obtained in our model dispersion, as implied by MCT, we now turn to fits done with solutions from schematic models. In this way we can test whether MCT can also achieve quantitative descriptions of the flow behaviors of dense dispersions. For the fitting procedure the relaxation equation 共2兲 for 共␥˙ 兲 model was the correlation function ⌽共t兲 within the F12 共␥˙ 兲 solved. For the critical F12 vertices the standard choice38,65 of vc2 = 2 and vc1 = 2冑vc2 − vc2 ⬇ 0.828 was made. We chose the path v1 = vc1 + / 共冑vc2 − 1兲 keeping v2 = vc2 constant to cross the transition line. Next, flow curves 共 , ␥˙ / ⌫ , v兲 were calculated from the correlation functions according to Eq. 共4兲. In order to get optimal results we started our fitting procedure from the curves that are both deepest in the glassy and liquid regimes. These curves with the highest and lowest effective volume fraction allow to fix the extremely values of the separation parameter , which controls the curve shape quite sensitively. In what is to follow, is treated as an adjustable parameter at each eff. In the process of fixing the parameter , the bare rate ⌫ that determines the scaling of the x axis and v, which determines the scaling along the y axis, were
Downloaded 21 Sep 2007 to 134.34.200.42. Redistribution subject to AIP license or copyright, see http://jcp.aip.org/jcp/copyright.jsp
204906-9
J. Chem. Phys. 125, 204906 共2006兲
Flow behavior of concentrated colloidal dispersions
FIG. 9. Reduced flow curves of concentrated suspensions of the thermosensitive core-shell particles. The reduced shear stress RH3 / kBT is plotted against the Peclet number Pe0 = 共6SRH3 / kBT兲␥˙ for suspensions differing in weight concentration and temperature indicated in the graph. The effective volume fractions which are also given in the graph have been calculated from the hydrodynamic radii at a given temperature. The flow curves coincide in good approximation if the volume fractions are equal or nearly equal. The lines give the theoretical descriptions and the corresponding separation parameters are given by the related numbers. The value of the fitting parameters is summarized in Table II.
determined for each packing fraction. In this way, we gradually proceeded to curves closer to the transition by adjusting the parameters , ⌫, and v. Table II gives the parameters for best fits by eye; the lines in Fig. 9 show the numerical flow curves. It is instructive to discuss the values obtained for each fit parameter. The separation parameter vanishes at the glass transition value eff ⬇ 0.564, which agrees well with the estimates of 0.58 from both experiments35,42,58–60 and simulations43,61 for hard sphere systems. Its magnitude is also well compatc c 兲 / eff found in the latible with the relation = 1.2共eff − eff ter simulation study from an analysis using microscopic MCT.
The short time decay rate ⌫共eff兲 varies about a factor of 2. This variation of the short time scale of the model may be connected with static structural or solvent mediated effects 共viz., hydrodynamic interactions兲, as can be seen from the explicit expression for the collective initial decay rate ⌫q in microscopic MCT models69,70 ⌫q = D0H共q兲q2 / S共q兲, with q the wave vector, H共q兲 the hydrodynamic amplitude, and S共q兲 the structure factor. Understanding the small variation of ⌫ thus appears complicated at present. The model parameter measuring stress magnitudes, that is, v, changes by a factor of 5. This variation is quite compatible with the strong increase of the shear moduli seen in microscopic MCT calcu-
TABLE II. Parameters of the model fitted to the experimental flow curves 关see Fig. 9兴. The unit of v is kBT / RH3 , while ⌫ is given in units of D0 / RH2 ; is dimensionless. The 0 value in parentheses lies beyond the experimental window and is extrapolated. ⌽
v
vPY
⌫
0 S
⬁ S
0.590 0.547 0.517 0.475 0.435
0.006 −0.005 −0.035 −0.09 −0.21
7.0 4.1 2.8 1.8 1.3
9.813 3.373 1.785 0.870 0.446
4.8 4.2 3.7 2.7 2.5
⬁ 共6.47⫻ 104兲 6.81⫻ 102 1.07⫻ 102 2.41⫻ 101
13.7 9.20 7.13 6.28 4.9
Downloaded 21 Sep 2007 to 134.34.200.42. Redistribution subject to AIP license or copyright, see http://jcp.aip.org/jcp/copyright.jsp
204906-10
J. Chem. Phys. 125, 204906 共2006兲
Crassous et al.
lations for hard spheres.34 As a test for this interpretation,71 we estimated v from the microscopic MCT expression of the shear modulus. It gives g共t兲 as superposition of squares of density correlators at all wave vectors q, weighted by the static structure factor.38,66,67 We identified the model correlator ⌽共t兲 with density fluctuations at wavelengths around the average particle distance aav.sep., which dominate the “cage effect” that drives vitrification in the MCT of hard spheres. The estimate was done by using a Percus-Yevick structure factor65 and integrating the modes around the peak in the structure factor at wave vector q = 共2兲 / aav.sep. ⬇ 3.5/ RH, i.e., 2.25艋 qRH 艋 4.75. The values71 vPY are included in Table II. The variation of v and ⌫ leads via ⬁ / S = v / 共2⌫兲 to a ratio of almost 3 between the reduced high shear viscosity ⬁ / S of the curves with the highest and the lowest effective packing fraction eff. This variation appears quite reasonable and presumably is dominated by hydrodynamic interactions. Summarizing the comparison between theory and experiment, we can conclude first that the fitted parameters collected in Table II take quite reasonable values as expected for hard sphere suspensions. The model of Sec. IV A, derived within the microscopic MCT approach to sheared Brownian particles, describes the flow curves of our dense dispersions over approximately five decades in shear rate. Care was taken experimentally to assure that the stationary long time limit was achieved. Then, as predicted, a dynamic yield stress could be observed, while the transition between yielding solid and shear-thinning fluid coincides, within experimental uncertainties, with the 共quiescent兲 glass transition, as predicted. V. CONCLUSION
Dispersions of thermosensitive core-shell particles constitute a novel model for the investigation of dense systems of hard spheres, one of the archetypical soft matter systems. They offer the intriguing possibility to finely adjust the effective volume fraction and thereby the distance to glassy arrest. Moreover, the dispersions can easily be sheared 共viz., driven兲 to reach stationary nonequilibrium states characterized by nonlinear flow curves. In this work we presented a careful characterization of such dispersions and employed them to study the steady state nonlinear rheology. Quantitative analysis of measured flow curves using schematic models from MCT support the connection elaborated by theory that the nonlinear rheology of dense dispersions is dominated by the physics of the glass transition. MCT finds that the slow structural relaxation close to glassy arrest is strongly affected by shear, and that, consecutively, the stresses reflect the slowing down of particle rearrangements at high densities. In the microscopic MCT equations competition arises between structural arrest driven by the “cage effect” and shear advection that pushes fluctuations to shorter wavelengths where local Brownian motion effectively relaxes them. Importantly, hydrodynamic interactions, ordering of particles into layers under shear, and other phase transition scenarios, which would affect the flow curves, in MCT are assumed to be absent or to set in at higher shear
rates only. Detailed simulations of an undercooled binary Lennard-Jones fluid support these assumptions,72 as do recent microscopic measurements in model dispersions.73 MCT describes the behavior at small bare Peclet numbers, Pe0 Ⰶ 1, where the internal relaxation time is comparable to or becomes larger than the inverse shear rate 1 / ␥˙ . The window of dressed Peclet or Weissenberg number, Pe = ␥˙ , comparable to or much larger than unity, is considered. Our measured flow curves extend down to Pe0 = 10−4, where the ratio of low 共0兲 to high shear 共⬁兲 viscosity depends strongly on packing fraction and increases markedly at the highest density. It is this strong increase that MCT connects to glassy physics and aims to explain. Calculations in schematic models of MCT achieve this with quite reasonable variations of the fitted parameters. Interestingly, theory predicts a nonequilibrium transition between a shear thinning fluid and a yielding solid. It lies at the position of the glass transition in the quiescent dispersion, and separates states with qualitatively different behaviors in the limit of vanishing shear rate. While in the fluid states, a Newtonian viscosity is obtained for ␥˙ → 0, in the yielding glassy states, a nonvanishing dynamic yield stress is found, 共␥˙ → 0 , 艌 glass兲 = yield共兲. In our system the tranglass ⬇ 0.564. Amorphous sition can be observed and lies at eff yielding glassy states are possible as their packing fractions still lie below random close packing and thus “free volume” for structural rearrangements is available. MCT in the version employed in the present comparisons is idealized in so far, as ultra-long-time mechanisms destroying the glassy arrest are neglected.65 They may well lead to a finite Newtonian viscosity even in the states that we conclude to be yielding glasses in the present window of Peclet numbers. Nevertheless, the measured flow curves 共␥˙ 兲 show the predicted change of shape at the transition of the “idealized MCT.” In a double logarithmic plot, the lower density flow curve exhibits a characteristic S shape, while the higher density flow curve lies almost horizontally at low ␥˙ and then curves upward.72 These intricate shape changes can only be resolved when plotting 共␥˙ 兲, as the plot of viscosity versus shear rate, 共␥˙ 兲, tends to straighten the data in the necessary double logarithmic presentation. Note for example, that the measured S-shaped flow curve rules out a simple shear thinning power law as often fitted. ACKNOWLEDGMENTS
The authors thank R. Besseling, M. E. Cates, W. C. K. Poon for valuable discussions. Two of the authors 共O.H. and M.F.兲 acknowledge support by the DFG in the International Graduate College “Soft Matter Physics.” The authors acknowledge financial support by the DFG, SFB 481, Bayreuth and by the Forschergruppe “Nonlinear Dynamics of Complex Continua,” Bayreuth. M. Shibayama, T. Tanaka, and C. Han, J. Chem. Phys. 97, 6829 共1992兲. M. Shibayama and T. Tanaka, Adv. Polym. Sci. 109, 1 共1993兲 and references cited therein. 3 M. Shibayama, Macromol. Chem. Phys. 199, 1 共1998兲. 4 T. Tanaka, E. Sato, Y. Hirakawo, S. Hirotsu, and J. Peetermans, Phys. Rev. Lett. 55, 2455 共1985兲. 5 K. Kratz and W. Eimer, Ber. Bunsenges. Phys. Chem. 102, 848 共1998兲. 1 2
Downloaded 21 Sep 2007 to 134.34.200.42. Redistribution subject to AIP license or copyright, see http://jcp.aip.org/jcp/copyright.jsp
204906-11 6
J. Chem. Phys. 125, 204906 共2006兲
Flow behavior of concentrated colloidal dispersions
M. J. Snowden and B. J. Vincent, J. Chem. Soc., Chem. Commun. 16, 1103 共1992兲. 7 J. Gao and Z. B. Hu, Langmuir 18, 1360 共2002兲. 8 H. Senff and W. Richtering, J. Chem. Phys. 111, 1705 共1999兲. 9 E. Daly and B. R. Saunders, Phys. Chem. Chem. Phys. 2, 3187 共2000兲. 10 C. D. Jones and L. A. Lyon, Macromolecules 36, 1988 共2003兲. 11 L. A. Lyon, J. D. Debord, S. B. Debord, C. D. Jones, J. G. McGrath, and M. J. Serpe, J. Phys. Chem. B 108, 19099 共2004兲 and references cited therein. 12 B. R. Saunders, Langmuir 20, 3925 共2004兲. 13 T. Lopez-Leon, J. L. Ortega-Vinuesa, D. Bastos-Gonzalez, and A. Elaïssari, J. Phys. Chem. B 110, 4629 共2006兲. 14 K. Makino, S. Yamamoto, K. Fujimoto, H. Kawaguchi, and H. Oshima, J. Colloid Interface Sci. 166, 251 共1994兲. 15 M. Okubo and H. Ahmad, Colloid Polym. Sci. 274, 274 共1996兲. 16 L. Nabzar, D. Duracher, A. Elaissari, G. Chauveteau, and C. Pichot, Langmuir 14, 5062 共1998兲. 17 D. Duracher, F. Sauzedde, A. Elaissari, A. Perrin, and C. Pichot, Colloid Polym. Sci. 276, 920 共1998兲. 18 N. Dingenouts, Ch. Norhausen, and M. Ballauff, Macromolecules 31, 8912 共1998兲. 19 Th. Hellweg, C. D. Dewhurst, E. Bruckner, K. Kratz, and W. Eimer, Colloid Polym. Sci. 278, 972 共2000兲. 20 T. Taniguchi, D. Duracher, T. Delair, A. Elaïssari, and C. Pichot, Colloids Surf., B 29, 53 共2003兲. 21 D. Duracher, R. Veyret, and A. Elaïssari, Polym. Int. 53, 618 共2004兲. 22 D. Suzuki and H. Kawaguchi, Langmuir 21, 8175 共2005兲. 23 Y. Lu, Y. Mei, M. Drechsler, and M. Ballauff, Angew. Chem., Int. Ed. 45, 813 共2006兲. 24 Y. Lu, Y. Mei, M. Drechsler, and M. Ballauff, J. Phys. Chem. B 110, 3930 共2006兲. 25 S. Nayak and L. A. Lyon, Angew. Chem., Int. Ed. 44, 7686 共2005兲. 26 W. B. Russel, D. A. Saville, and W. R. Schowalter, Colloidal Dispersions 共Cambridge University Press, New York, 1989兲. 27 H. Senff, W. Richtering, Ch. Norhausen, A. Weiss, and M. Ballauff, Langmuir 15, 102 共1999兲. 28 I. Deike, M. Ballauff, N. Willenbacher, and A. Weiss, J. Rheol. 45, 709 共2001兲. 29 M. Stieger, J. S. Pedersen, P. Lindner, and W. Richtering, Langmuir 20, 7283 共2004兲. 30 M. Stieger, P. Lindner, and W. Richtering, J. Phys.: Condens. Matter 16, S3861 共2004兲. 31 S. Pyett and W. Richtering, J. Chem. Phys. 122, 034709 共2005兲. 32 J. J. Crassous, R. Regisser, M. Ballauff, and N. Willenbacher, J. Rheol. 49, 851 共2006兲. 33 M. Fuchs and M. Ballauff, J. Chem. Phys. 122, 094707 共2005兲. 34 M. Fuchs and M. Ballauff, Colloids Surf., A 270/271, 232 共2005兲. 35 S. P. Meeker, W. C. K. Poon, and P. N. Pusey, Phys. Rev. E 55, 5718 共1997兲. 36 Z. Cheng, J. Zhu, P. M. Chaikin, S. E. Phan, and W. B. Russel, Phys. Rev. E 65, 041405 共2002兲. 37 M. Fuchs and M. E. Cates, Phys. Rev. Lett. 89, 248304 共2002兲. 38 M. Fuchs, Faraday Discuss. 123, 267 共2003兲. 39 S. Tang, Z. B. Hu, Z. Cheng, and J. Wu, Langmuir 20, 8858 共2004兲. 40 A. M. Alsayed, M. F. Islam, J. Zhang, P. J. Collings, and A. G. Yodh, Science 309, 1207 共2005兲. 41 T. G. Mason and D. A. Weitz, Phys. Rev. Lett. 75, 2770 共1995兲.
W. van Megen and S. M. Underwood, Phys. Rev. E 49, 4206 共1994兲. Th. Voigtmann, A. M. Puertas, and M. Fuchs, Phys. Rev. E 70, 061506 共2004兲. 44 J. J. Crassous, M. Ballauff, M. Drechsler, J. Schmidt, and Y. Talmon, Langmuir 22, 2403 共2006兲. 45 S. Seelenmeyer, I. Deike, S. Rosenfeldt, Ch. Norhausen, N. Dingenouts, M. Ballauff, and T. Narayanan, J. Chem. Phys. 114, 10471 共2001兲. 46 N. Dingenouts, S. Seelenmeyer, I. Deike, S. Rosenfeldt, M. Ballauff, P. Lindner, and T. Narayanan, Phys. Chem. Chem. Phys. 3, 1169 共2001兲. 47 H. Holthoff, S. U. Egelhaaf, M. Borkovec, P. Schurtenberger, and H. Sticher, Langmuir 12, 5541 共1996兲. 48 M. Kobayashi, F. Juillerat, P. Galletto, P. Bowen, and M. Borkovec, Langmuir 21, 5761 共2005兲. 49 A. Inhof, A. van Blaaderen, and J. K. G. Dhont, Langmuir 10, 3477 共1994兲. 50 J. L. Harland, S. I. Henderson, S. M. Underwood, W. van Megen, Phys. Rev. Lett. 75, 3572 共1995兲. 51 W. Megen, T. C. Mortensen, S. R. Williams, and J. Müller, Phys. Rev. E 58, 6073 共1998兲. 52 P. N. Pusey and W. van Megen, Nature 共London兲 320, 340 共1986兲. 53 S. E. Paulin and B. J. Ackerson, Phys. Rev. Lett. 64, 2663 共1990兲. 54 W. G. Hoover, S. G. Gray, and K. W. Johnson, J. Chem. Phys. 55, 1128 共1971兲. 55 P. Wette, H. J. Schöpe, and Th. Palberg, J. Chem. Phys. 123, 174902 共2005兲. 56 W. Megen and P. N. Pusey, Phys. Rev. A 43, 5429 共1991兲. 57 P. N. Pusey and W. van Megen, Phys. Rev. Lett. 59, 2083 共1987兲. 58 W. van Megen and S. M. Underwood, Phys. Rev. Lett. 70, 2766 共1993兲. 59 C. Beck, W. Härtl, and R. Hempelmann, J. Chem. Phys. 111, 8209 共1999兲. 60 E. Bartsch, T. Eckert, C. Pies, and H. Sillescu, J. Non-Cryst. Solids 307– 310, 802 共2002兲; T. Eckert and E. bartsch, Faraday Discuss. 123, 51 共2003兲. 61 B. Doliwa and A. Heuer, Phys. Rev. E 61, 6898 共2000兲. 62 W. Götze, J. Phys.: Condens. Matter 11, A1 共1999兲. 63 M. Fuchs and M. E. Cates, J. Phys.: Condens. Matter 17, S1681 共2005兲; M. E. Cates, C. B. Holmes, M. Fuchs, and O. Henrich, Unifying Concepts in Granular Media and Glasses, edited by A. Coniglio, A. Fierro, H. Herrmann, and M. Nicodemi 共Elsevier, Amsterdam, 2004兲, p. 2203. 64 W. Götze, Z. Phys. B: Condens. Matter 56, 139 共1984兲. 65 W. Götze, in Liquids, Freezing and Glass Transition, edited by J. P. Hansen, D. Levesque, and J. Zinn-Justin, 共North-Holland, Amsterdam, 1991兲, p. 287. 66 U. Bengtzelius, W. Götze, and A. Sjölander, J. Phys. C 17, 5915 共1984兲. 67 G. Nägele and J. Bergenholtz, J. Chem. Phys. 108, 9893 共1998兲. 68 J. F. Brady, J. Chem. Phys. 99, 567 共1993兲. 69 M. Fuchs and M. R. Mayr, Phys. Rev. E 60, 5742 共1999兲. 70 G. Nägele and P. Baur, Europhys. Lett. 38, 557 共1997兲. 71 From the microscopic MCT expression of the shear modulus 共Refs. 66 and 67兲 we estimate v from the coupling of stress to density fluctuations around the peak in the static structure factor: vPY 4.75/RH 4 = RH3 / 602兰2.25/R q 共d ln Sq / dq兲2dq. H 72 F. Varnik and O. Henrich, Phys. Rev. B 73, 174209 共2006兲. 73 R. Besseling, E. R. Weeks, A. B. Schofield, and W. C. K. Poon, e-print cond-mat/0605247. 42 43
Downloaded 21 Sep 2007 to 134.34.200.42. Redistribution subject to AIP license or copyright, see http://jcp.aip.org/jcp/copyright.jsp