PHYSICAL REVIEW B 75, 144106 共2007兲
Three-dimensional local structure refinement using a full-potential XANES analysis G. Smolentsev and A. V. Soldatov* Faculty of Physics, Rostov State University, Rostov-on-Don, 344090, Russia
M. C. Feiters Department of Organic Chemistry, Institute for Molecules and Materials, Radboud University Nijmegen, 1 Toernooiveld, 6525 ED Nijmegen, The Netherlands 共Received 8 August 2006; revised manuscript received 6 February 2007; published 18 April 2007兲 A technique of three-dimensional 共3D兲 local structure refinement is proposed and demonstrated by applying it to the metal complex Ni共acacR兲2. The method is based on the fitting of experimental x-ray absorption near-edge structure 共XANES兲 using a multidimensional interpolation of spectra and full potential calculations of XANES. The low number of calculations required is the main advantage of the method, which allows a computationally time-expensive method using a non-muffin-tin potential to be applied. The possibility to determine bond angles in addition to bond lengths accessible to extended x-ray-absorption fine structure opens new perspectives of XANES as a 3D structure probe. DOI: 10.1103/PhysRevB.75.144106
PACS number共s兲: 61.10.Ht
I. INTRODUCTION
One of the most extensively used techniques of local structure determination of materials without long-range order is extended x-ray absorption fine structure 共EXAFS兲 spectroscopy. It allows the extraction of precise information about bond lengths and coordination numbers, but it usually has low sensitivity to the bond angles. At the same time x-ray absorption near-edge structure 共XANES兲 can in principle be used to probe bond angles. But quantitative theoretical analysis of these spectra is much more complicated than EXAFS fitting and it has only recently become possible to develop methods for the extraction of structural parameters from XANES. In particular XANES fitting using full multiple-scattering 共FMS兲 calculations based on the muffintin 共MT兲 approximation for the potential was recently applied using the MXAN1 and FITIT2,3 codes. Alternatively simultaneous analysis of EXAFS and XANES taking into account a limited number of multiple scattering paths sometimes gives information about angles in addition to distances.4 For many important applications like nanomaterials, porous solids, nanotubes, fullerenes, diluted soft matter, and biological substances, it was found to be important to go beyond the MT approximation for the potential. The first full-potential calculations of XANES for diatomic molecules were performed by Foulis et al.5 Recently some full-potential approaches based on band structure methods,6–8 the fullpotential FMS theory,9 and the finite difference method10 共FDM兲 were proposed. As band structure approaches are not well suited for three-dimensional 共3D兲 geometry fitting of molecules, since they work in reciprocal space and require translational symmetry, and non-MT FMS methods are still at an early stage of development, we have used the FDM scheme for the present research. As a system for the application of the method we have selected a complex of Ni with acetylacetonate 共acacR, where R is a para-tertiarybutylbenzyl group attached to the acetylacetonate in the 3-position兲. It was shown recently that non-MT effects could be important for the systems with large 1098-0121/2007/75共14兲/144106共5兲
holes or interstitial regions8 between atoms and sometimes in planar molecules.10 Thus considered Ni共acacR兲2 is a system where one can expect non-MT effects to be important. On the other hand, the local structure of a metal complex, especially in solution or around the metal in a metalloprotein, which is a related problem, is of broad interest since x-ray crystallography cannot be applied to solutions and gives only relatively low-resolution structures for proteins, and only x-ray absorption spectroscopy can be expected to give valuable additional and more accurate structural information based on the experimental measurements. In this paper we present examples of local structure determination from quantitative XANES fitting on the basis of full-potential approach, which can be applied in those cases where the MT approximation used in most FMS schemes fails.
II. METHOD OF CALCULATION
The proposed method of local structure determination is based on combination of quantitative XANES fitting using multidimensional interpolation approach2 and full-potential calculations of XANES on the basis of the finite difference method.10 The main idea is to minimize the number of required time-consuming FDM calculations using the following expansion of the spectrum as a function of structural parameters:
i共E,p1 + ␦ p1,p2 + ␦ p2, . . . ,pn + ␦ pn兲 = 共E,p1,p2, . . . ,pn兲 + 兺 An共E兲␦ pn n
+ 兺 Bmn共E兲␦ pm␦ pn + ¯ . m,n
Here i共E兲 is the interpolated x-ray absorption coefficient, whereas 共E兲 is the absorption coefficient calculated via FDM, 共p1 , p2 , . . . , pn兲 is a starting set of structural parameters, and ␦ pn is a deviation of parameter pn from the starting
144106-1
©2007 The American Physical Society
PHYSICAL REVIEW B 75, 144106 共2007兲
SMOLENTSEV, SOLDATOV, AND FEITERS
value. The energy dependent coefficients An共E兲 , Bmn共E兲 , . . . are deduced from the results of FDM calculations. The interpolation nodes are chosen within selected limits of variations so that the influence of corresponding terms of expansion and distance between nodes in the space of parameters is maximal for these sets of parameters. It allows one to avoid numerical instabilities of the method. A general description of the multidimensional interpolation and finite-difference method can be found in Refs. 2 and 3 and Ref. 10, respectively. During minimization of the discrepancy between interpolated i共E兲 and experimental expt共E兲 spectra the standard 1 兰E2关i共E兲 mean-square criterion was used: F = E2−E 1 E1 − expt共E兲兴2dE with normalization of all spectra 1 E2 2 E2−E1 兰E1 共E兲dE = 1. The error bars for each structural parameter were calculated as deviations of the parameters from the best-fit value, which correspond to the increase of discrepancy between theory and experiment to the certain value ⌬F. The statistical uncertainties associated with the noise of ␦2 experimental spectrum were evaluated as ⌬F = K N , where K is a tabulated constant, which depends on the number of parameters and the confidence level, N the number of points in uniform energy grid, and ␦ the noise of the experimental spectrum. In our case the experimental spectra have a very good signal-to-noise ratio 共⬃104兲 and the discrepancy between theory and experiment appears as a result of limitations on the theory or systematic errors in the experiment. Therefore the value of ⌬F was chosen in comparison with the minimal discrepancy Fmin as ⌬F = 0.1Fmin. The finite-difference calculations were performed at order 4 with square grid and interpoint distance equal to 0.25 Å. Within the small areas around atoms 共with radius r = 0.65 Å兲 the spherical wave expansion was used up to l = lmax + 1; kr = 冑lmax共lmax + 1兲, where k is the photoelectron wave vector. In the outer sphere expansion was performed up to l = lmax + 5, where lmax is calculated in the same way, but r is a radius of the outer sphere 共4.6 Å兲. The convergence of the spectrum as a function of cluster size was tested, and it was found that beyond this radius the spectrum does not change. The potential was constructed on the basis of a simple superposition of atomic densities calculated self-consistently. The energydependent exchange-correlation potential is obtained following the Hedin-Lundqvist approach.11 During the FDM calculations only the real part of the potential was taken into account and the spectra were then broadened using a Lorentzian function with energy-dependent width.12 A non-spinpolarized potential was used since the Ni atom is in a lowspin state. Full multiple-scattering calculations were also performed for comparative purposes using the FDMNES and FEFF8.4 codes. In FMS calculations with the FDMNES package the same nonstructural parameters as in the case of the FDM method were used 共exchange, size of cluster, and broadening兲. Using the FEFF8.4 code the only difference is that the self-consistency of the potential was performed using a 3.6-Å cluster with complex Hedin-Lundqvist exchange. Five other possibilities available in FEFF with different types of exchange correlation potentials and core-hole screening have been tested. They gave practically the same shape for the XANES and only energy-dependent Dirac-Hara potential
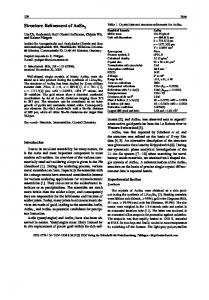
FIG. 1. Experimental 共solid line兲 calculated using FDM 共dashed line兲 and FMS 共dotted line兲 Ni K-edge XANES of Ni共acac兲2 in trimeric form.
results in the relative shifts of corresponding structural details of the XANES, but in a way that the shape of the theoretical spectrum became even more different from the experimental one. III. RESULTS AND DISCUSSION
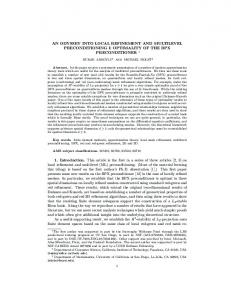
To test that the method of calculation with selected values of nonstructural parameters gives good agreement with experiment for well-known local structure we have calculated the spectrum of a related model system: Ni共acac兲2 in trimeric form. Its structure was determined previously using x-ray diffraction.13 As one can see from Fig. 1, a very good agreement between theory and experiment was obtained. Therefore in all subsequent calculations we have fixed all parameters of the potential and broadening and varied the local structure only. Calculations within full multiple-scattering theory with muffin-tin approximation for the potential give rather poor agreement with experiment. Results obtained using the FEFF8.4 code are shown in Fig. 1, and analogous trends were observed using the multiple-scattering mode of the FDMNES package. The intensity of the main maximum is significantly underestimated, and this disagreement cannot be significantly reduced varying the broadening of the spectrum, exchange potential, or accurately taking into account losses due to multiple electron excitations. Therefore nonmuffin-tin effects are dominant in the considered case. In order to demonstrate the sensitivity of the method to the bond lengths and angles in the case of monomeric Ni共acacR兲2 we present in Fig. 2 theoretical calculations of XANES based on the full-potential method for different sets of structural parameters schematically shown in Fig. 3. The values of parameters are listed in Table I. As one can see from the comparison of calculations 1 and 2, the energy separation between the maxima A and B and the intensity of shoulder C have a strong angular dependence. The shape of the spectrum is also quite sensitive to the bond lengths 共compare curves 3–5兲. The observed high sensitivity of XANES to small variations of structural parameters confirms that XANES really contains information on the full threedimensional geometry around the absorbing atom in the x-ray spectroscopic experiment.
144106-2
PHYSICAL REVIEW B 75, 144106 共2007兲
THREE-DIMENSIONAL LOCAL STRUCTURE REFINEMENT…
TABLE I. Sets of structural parameters that correspond to the calculations presented in Fig. 2. Distances in Å, angles in degrees. Set of parameters p1 共Ni-O兲 p2 共O-C1兲 p3 共C1-C2兲 p4 共O-Ni-O兲 1 2 3 4 5
FIG. 2. Theoretical Ni K-edge XANES of Ni共acacR兲2 calculated for the different structural models. The trace numbering corresponds to the sets of parameters in Table I.
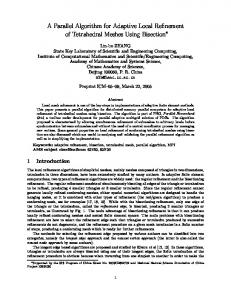
The comparison of MT FMS and non-MT FDM calculations using the FDMNES code 共see Fig. 4兲 clearly demonstrates the importance of non-MT effects in the XANES of monomeric Ni共acacR兲2. This is due to the presence of large interstitial regions inside the rings 共marked as A in Fig. 3兲 in which the molecule potential cannot be considered as a constant anymore—thus one has to go beyond the MT approximation. During subsequent fitting, the structural parameters were varied within the following limits: Ni-O distance 1.76– 1.92 Å, O-C1 distance 1.22– 1.38 Å, C1-C2 distance 1.30– 1.46 Å, and O-Ni-O angle 80° – 100°. The C1-C3 distance and the O-C1-C3 and O-C1-C2 angles were fixed to 1.49 Å, 120°, and 120°, respectively. The next step of the analysis is the construction of interpolation polynomial with energy-dependent coefficients which allows us to obtain good agreement between interpolated and FDM calculated spectra for all values of parameters within the selected limits. First, we have found a minimal number of terms in the polynomial, which is enough to reproduce correctly the spectrum as a function of each variable 共while three other parameters have fixed starting values兲. We have found that only first-order terms are necessary to interpolate the spectrum for parameters p2 and p3 while two terms are required for p1 and p4. Then we have tested
FIG. 3. Structural model of Ni共acacR兲2 used for XANES fitting.
1.84 1.84 1.76 1.84 1.84
1.30 1.30 1.30 1.22 1.30
1.38 1.38 1.38 1.38 1.46
80 100 90 90 90
second-, third-, and fourth-order cross terms between two, three, and four variables, correspondingly. It has been found that all such cross terms are important. Additionally a few third-order cross terms between two parameters 共␦ p21␦ p2, ␦ p21␦ p3, ␦ p21␦ p4, ␦ p1␦ p24, ␦ p2␦ p24, ␦ p3␦ p24兲 and fourth-order term 共␦ p1␦ p2␦ p24兲 have been tested according to the strategy of interpolation polynomial construction described elsewhere.2 As a final point, we have obtained an interpolation polynomial, which allows us to reproduce correctly the spectrum within the selected limits of parameters:
i共E,p1 + ␦ p1,p2 + ␦ p2,p3 + ␦ p3,p4 + ␦ p4兲 4
= 共E,p1,p2,p3,p4兲 + 兺 Ai共E兲␦ pi + i=1
4
兺
Bij共E兲␦ pi␦ p j
i,j=1 i⫽j
4
+
兺
Cijk共E兲␦ pi␦ p j␦ pk + D1共E兲␦ p1␦ p2␦ p3␦ p4
i,j,k=1 i⫽j⫽k
+ D2共E兲␦ p21 + D3共E兲␦ p24 + D4共E兲␦ p1␦ p24 + D5共E兲␦ p2␦ p24 + D6共E兲␦ p1␦ p2␦ p24 . Thus we have found that only 21 spectra calculated ab initio have to be included in the polynomial construction to reproduce results of FDM calculations for any considered geometry.
FIG. 4. Comparison of the experimental Ni K-edge XANES 共solid line兲 with theoretical MT FMS 共dashed line兲 and non-MT FDM calculation 共dotted line兲 spectra for the same set of structural parameters.
144106-3
PHYSICAL REVIEW B 75, 144106 共2007兲
SMOLENTSEV, SOLDATOV, AND FEITERS
FIG. 5. 共Color online兲 Comparison of the experimental Ni K-edge XANES 共solid line兲, interpolated 共dashed blue line兲, and FDM calculated 共dotted red line兲 spectra for the best fit of parameters.
The final step of the XANES fitting is the minimization of the discrepancy between experimental and interpolated spectra. The measurements were performed at the BM26 DUBBLE CRG beamline of ESRF 共Grenoble, France兲 at room temperature in transmission mode as described earlier.14 Interpolated and FDM calculated spectra for the best-fit geometry as well as experimental curve are shown in Fig. 5, and the agreement between them is quite good 共meansquare deviation F = 2.0⫻ 10−3兲. The slight overestimation of the intensity of the pre-edge peak is systematic and cannot be reduced by variation of the local structure. One of the possible reasons for small differences between experimental and theoretical curves that still exist is that interaction between core hole and photoelectron is not described with the required accuracy of the current status of XANES calculations.15 The discrepancy between interpolated and FDM calculated spectra, due to uncertainties typical for a multidimensional interpolation approximation, is very small, and it does not affect the results of the geometry determination. The values of the best-fit structural parameters are summarized in Table II. The use of the non-MT approach is essential to find physically reasonable values of structural parameters. When we tried to fit the spectrum with the MT potential the minimum discrepancy between theoretical and experimental spectra 共equal to 2.4⫻ 10−3兲 could only be obtained with values for the structural parameters that were
outside acceptable limits 共the Ni-O distance was more than 1.92 Å and the O-Ni-O angle more than 100°兲 共see Table II兲. This is due to the tendency of the system to compensate the difference between experiment and theory, which is due to non-MT effects, by variation of the structural parameters beyond physically reasonable values. To validate the results obtained by XANES fitting, we compare them in Table II with EXAFS results10 as well as with results of theoretical optimization of the structure of the full Ni共acacR兲2 molecule using an all-electron DFT approach16 implemented in the ADF2005.1 code. X-ray crystallographic data for the related Ni complex17 also show similar structural parameters: Ni-O distance 1.84 Å, O-C1-1.31 Å, C1-C2 1.39 Å, and O-Ni-O angle 94°. In DFT calculations the electronic configuration of the molecule was described by an uncontracted double- basis set of Slatertype orbitals. Energies were calculated using the Perdew18 and Vosko-Wilk-Nusair19 exchange correlation potential. As one can see from Table II the values of bond lengths 关obtained by both EXAFS and density functional theory 共DFT兲 methods兴 and angles 共obtained by DFT approach兲 correlate well with XANES fitting results.
IV. CONCLUSION
In conclusion, we have demonstrated a quantitative determination of local structural parameters on the basis of fullpotential XANES calculations. The field of future applications of the method is not limited to organometallic compounds and includes various systems without long range and low-dimensional objects like nanoclusters, surfaces, nanotubes, and various dilute materials—for example, metalloproteins. Most such systems have large interstitial regions between the atoms and therefore consideration of nonmuffin-tin effects is crucial for a correct determination of the structural properties from XANES. The possible limitation of the method is a huge amount of required memory 共RAM兲 and CPU time 共up to 3 – 4 Gb of memory and 500 h of calculations of each spectrum for cluster of 5 – 6 Å with 30–40 atoms without any symmetry; each symmetry operation reduces both parameters by a factor of 8兲, but it will be overcome soon with the development of high-performance computers. The advantage of this spectroscopic technique in comparison with EXAFS is that it is very sensitive to the
TABLE II. Structural parameters obtained by different methods. Distances in Å, angles in degrees.
XANES 共non-MT兲 XANES 共MT兲 DFT EXAFS
p1 共Ni-O兲
p2 共O-C1兲
p3 共C1-C2兲
p4 共O-Ni-O兲
Ni-C1
1.83± 0.02
1.28± 0.02
1.39± 0.035
93± 1
2.82
1.94± 0.02
1.28± 0.025
1.43± 0.035
102± 1
2.80
1.84 1.83± 0.02
1.30
1.39
95
2.81 2.78± 0.05
144106-4
PHYSICAL REVIEW B 75, 144106 共2007兲
THREE-DIMENSIONAL LOCAL STRUCTURE REFINEMENT…
The work is supported by Grant RNP 2.1.1.1038 共Russian Federation兲 and a joint NWO- 共The Netherlands兲 RFBR
共Russian Federation兲 Grant No. 47.015.010. Support of G.S. from INTAS and Zamaraev International Charitable Scientific Foundation is also acknowledged. The authors thank NWO for providing 共with FWO, the Flemish Research Council兲 beam time and support 共S. Nikitenko兲 at BM26 at DUBBLE CRG/ESRF.
*Electronic address:
[email protected]
10 Y.
bond angles and therefore it opens a possibility for investigation of the 3D local geometry with high spatial resolution. ACKNOWLEDGMENTS
1
M. Benfatto, S. Della Longa, and C. R. Natoli, J. Synchrotron Radiat. 10, 51 共2003兲. 2 G. Smolentsev and A. V. Soldatov, J. Synchrotron Radiat. 13, 19 共2006兲. 3 G. Smolentsev, A. V. Soldatov, F. D’Acapito, G. Polzonetti, and I. Fratoddi, J. Phys.: Condens. Matter 18, 759 共2006兲. 4 A. Levina, R. S. Armstrong, and P. A. Lay, Coord. Chem. Rev. 249, 141 共2005兲. 5 D. L. Foulis, R. F. Pettifer, and P. Sherwood, Physica B 208, 68 共2001兲. 6 P. Blaha, K. Schwartz, G. K. H. Madsen, D. Kvasnicka, and J. Luitz, WIEN2k, An augmented plane wave+local orbitals program for calculating crystal properties, Karlheinz Schwartz, Technical University at Wien, Austria, 1995. 7 M. Ogura and H. Akai, J. Phys.: Condens. Matter 17, 5741 共2005兲; T. Huhne and H. Ebert, Solid State Commun. 209, 577 共1999兲. 8 M. Taillefumier, D. Cabaret, A. M. Flank, and F. Mauri, Phys. Rev. B 66, 195107 共2002兲. 9 A. L. Ankudinov and J. J. Rehr, Phys. Scr. T115, 24 共2005兲; D. L. Foulis, Phys. Rev. A 70, 022706 共2004兲.
Joly, Phys. Rev. B 63, 125120 共2001兲. L. Hedin and S. Lundqvist, Solid State Phys. 23, 1 共1969兲. 12 http://cristallo.grenoble.cnrs.fr/LDC/LE_LABORATOIRE/ Equipes_de_recherche/EQUIPE_SPECTROSCOPIE/SIMUL/ EtudFond_Prog.asp 13 M. B. Hursthouse, M. A. Laffey, P. T. Moore, D. B. New, P. R. Raithby, and P. Thornton, J. Chem. Soc. Dalton Trans. 307 共1982兲. 14 M. C. Feiters, G. A. Metselaar, B. B. Wentzel, R. J. M. Nolte, S. Nikitenko, D. C. Sherrington, Y. Joly, G. Smolentsev, A. N. Kravtsova, and A. V. Soldatov, Ind. Eng. Chem. Res. 44, 8631 共2005兲. 15 E. L. Shirley, J. A. Soininen, and J. J. Rehr, Phys. Scr. T115, 31 共2005兲. 16 G. te Velde, F. M. Bickelhaupt, S. J. A. van Gisbergen, C. Fonseca Guerra, E. J. Baerends, J. G. Snijders, and T. Ziegler, J. Comput. Chem. 22, 931 共2001兲. 17 F. A. Cotton and J. J. Wise, Inorg. Chem. 5, 1200 共1966兲. 18 J. P. Perdew, Phys. Rev. B 33, 8822 共1986兲. 19 S. H. Vosko, L. Wilk, and M. Nusair, Can. J. Phys. 58, 1200 共1980兲. 11
144106-5