Thyroid Disease Diagnosis using Genetic Algorithm and Neural ...
Recommend Documents
ontology based expert system to diagnose thyroid diseases. Ontology describes ... of people undiagnosed and their symptoms are often confused · with other ...
Cryptography using neural network, In Proc. of 2005 Annual. IEEE INDICON, pp. 258-261 (2005). 3. E. Volna, M. Kotyrba, and V. Kocian, Cryptography based on.
Adaptive Neuro FIS (ANFIS) proposed by. Jang and included in the Matlab, employes the Sugeno type of. FIS. The Sugeno fuzzy model was proposed by Takagi ...
Key words: neural network ensemble, genetic algorithm, principal components, UV spectrophotometry, ..... in the neural network toolbox for MATLAB through.
alveolar hypoventilation due to depression of hypoxic and hypercapnic ventilatory drives and decreased in maximal breathing and diffusing capacity in patients ...
disease in data mining. Index Termsâ DSCN algorithm, Hierarchical multiple classifier, TSH, Hypothyroidism, Hyperthyroidism, clustering, classification.
Key-Words: Genetic algorithm, Fitness function, Neural network, ... [5]. This network belongs to the most recent neural networks. It is a type of forward multi-layer ...
KEYWORDS: Diabetes mellitus, Diagnosis, Genetic Algorithm, PIMA Indian ..... on Network Security & Cryptography at various locations like Kuwait, China, ...
important parameters in breast cancer diagnosis from proposed medical infrared ... Technologies, Sabzevar University of Medical Sciences, Sbzevar, Iran.
Abstract. Aiming at the drawbacks of slowly converging and easily getting into the local minimum appearing in the BP neural network, this paper combines the ...
Apr 1, 2013 - Balanceadas, Programación matemática y software, Vol. 1,. 2009. Amine A, et. al., GA-SVM and Mutual Information based Fre- quency Feature ...
Apr 1, 2013 - Examples of a dataset: a gear wheel, housing and gearbox. To train and test the ..... Pattern Recognition, International Journal of Software.
Ramaswamy Palaniappan, Paramesran Raveendran, and Sigeru Omatu ... R. Palaniappan and P. Raveendran are with the Department of Electrical.
KEY WORDS: Data Mining, Genetic Algorithm, Neural Networks, Artificial ... Although, this works fine for training data, when applied to observations that it has ...
Feb 24, 2014 - Parkinson's Disease; Speech Analysis; Genetic Algorithm; Support ..... thod, MATLAB software has been used. ... Shimmer (APQ5) database.
Data concerning 265 patients is available in the form of test scores and diagnoses, made by ... The neural network model is in this paper compared with a fuzzy model. Rather ..... layer of output neurons, is a simple choice of network topology.
Management of Women with Gestational Hyperthyroidism and Hyperemesis.
Gravidarum. 1094. (continued). PREGNANCY AND .... What is the definition of
PPT and what are its clinical implications? 1105. Q. 71. What is the etiology of
PPT?
Abstractâ The optimization of architecture of feed-forward neural networks is a complex task of high importance in supervised learning because it has a great ...
methods such as Genetic Algorithms (GAs), Particle swarm optimization ..... (1989
)Genetic Algorithms in Search, Optimization , and Machine learning, Addison.
Evaluation for Musical Composition. A.R. Burton ... representation of musical phrase or sound, a GA can generate ..... tional Computer Music Conference, 1994.
developed functions in MATLAB using the inbuilt eigenvalue decomposition ... Marquardt26 algorithm available in the neural network toolbox for MATLAB ..... manual selection of the neural network model becomes redun- dant since the GA ...
Different approaches have been used in the di- agnosis of chronic Chagas disease. Serologic tests are used to detect antibodies against Trypanosoma.
mining in healthcare system play a vital role because the health region ... signs of Alzheimer's disease; but various persons can have the .... Bayesian networks.
pre-processed using the PyAudioAnalysis library in Python. [11]. This preliminary audio analysis resulted in eleven unique features as shown in Table IV in ...
Thyroid Disease Diagnosis using Genetic Algorithm and Neural ...
The thyroid is one of the largest endocrine glands in the body. This gland is found in the neck below the mouth and at approximately the same level as cricoids ...
Thyroid Disease Diagnosis using Genetic Algorithm and Neural Network Dr. Sarah Behnam Aziz* * Computer Science Department, College of Science, Basrah University, Basrah, Iraq email: [email protected]
Abstract: Nowadays, with advancement of technology and science and expansion of computer usage in high-tech calculations, especially in the field of medicine, intelligence systems and in particular Neural Networks are becoming of significant importance in automatic diagnosis and prognoses of different diseases. This paper presents the diagnosis of thyroid diseases using Neural Networks. The genetic algorithm was used to find the optimum network structure with high classification accuracy. The experimental results presented for different proportions of training/testing groups show a high classification accuracy and convergence in rates. The overall accuracy is 100% for training and in range between 96% and 98% for testing. The neural networks are simulated using MATLAB. While thyroid disease datasets are taken from UCI machine learning dataset.
1. Introduction. Neural Networks (NNs) techniques have recently been applied to many medical diagnosis problems [1-4]. But there has not been a significant use in a hospital or clinic routinely [1]. The reason is that people don't think machines to be much reliable when it comes to diagnosis of a disease. But, soft computing tools like NNs, Fuzzy Logic (FL) , and Genetic
1
Algorithm (GA), can do well to ease and complement the work of medical experts [5, 6]. They can help to filter out the real patients, which will reduce the costs and time required for diagnosis. The doctors can then provide all their attention to the actual patients [7]. The thyroid is one of the largest endocrine glands in the body. This gland is found in the neck below the mouth and at approximately the same level as cricoids cartilage. The thyroid gland produces two active hormones, levothyroxine (abbreviated T4) and triiodothyroine (abbreviated T3). These hormones are important in the production of proteins, in the regulation of the body temperature, and in overall energy production and regulation [8]. The thyroid gland is prone to several very distinct problems, some of which are extremely common. Production of too little thyroid hormone causes hypothyroidism or production of too much thyroid hormone causes hyperthyroidism [4, 8]. Since the thyroid hormones are responsible for large part of body's metabolisms, thyroid performance is directly affective on most of our organisms. Therefore, fast and accurate recognition of thyroid diseases are of great important classification problem [4, 8]. Various new methods, such as pattern recognition techniques, fuzzy classifiers, artificial immune recognition system, neural networks, neuro fuzzy, genetic algorithm etc, have been used to diagnose thyroid disease [4, 9-13]. The Paper are organized as follows, in section two the description of the thyroid dataset is introduced while section three is dedicated to a brief review on techniques used (NNs and GA). The obtained experimental results in application are given in section four. Discussions and comparisons with previous work can be found in section four. Finally, Section five presents the conclusions.
2
2. Description of Thyroid Dataset. The title of the data-set is a thyroid gland database taken from the UCI machine learning respiratory was used as one of the benchmark datasets for testing classifiers [1]. The thyroid dataset includes 215 instances. Each instance has five attributes plus the class attribute. All samples have five features. These are: T3, Total Serum thyroxin, Total serum triiodothyronine, Basal thyroid-stimulating hormone (TSH), and Maximal absolute difference of TSH value after injection of 200 micro grams of thyrotropin-releasing hormone as compared to the basal value. All attributes are continuous. Each of the instances has to be categorized into one of the three classes: Class 1: normal (150 instances), Class 2: hyperthyroidism (35 instances), Class 3: hypothyroidism (30 instances) functioning. 3. View on Neural Networks and Genetic Algorithm. In this research, a multilayer neural network structure of three layers; the input layer with five neurons equal to the number of the dataset features, one hidden layer which its neurons will be determined by the GA, and the output layer with only one neuron; that using a type of second order approach as a training algorithm is used for diagnosing thyroid disease. The GA is used to find an optimum network. These two techniques will be illustrated in details at the next subsections and the general steps of this approach algorithm will be listed in the third subsection. 3.1. Neural Networks One of the neural network structures that have been widely used is the feed forward network, where network connections are allowed only between the nodes in one layer and those in the next layer. The Back Propagation algorithm (BPA) is widely used for training the network [15]. However, it has to take too many steps to train the network, and the weights are calculated step
3
by step. Commonly known heuristic approaches such as momentum, variable learning rate, or stochastic learning lead only to a slight improvement. [16,17]. A significant improvement on realization performance can be observed by using various second order approaches [16]. The Levenberg-Marquardt (LM) optimization technique is widely accepted as the most efficient one in the sense of realization accuracy [18]. It gives a good compromise between the speed and the stability of the steepest descent method. 3.2. Genetic Algorithms GA is a search technique to find approximate solutions to optimization problems. It is a global search technique and a particular class of evolutionary algorithms. From biological sciences, evolutionary processes have been borrowed and translated to efficient search and design strategies. Three basic genetic operators guide this search: selection, crossover, and mutation. Genetic Algorithms (GAs) use these strategies to find an optimum solution for any multidimensional problem [20, 21]. 3.3. The approach Algorithm. The algorithm of this approach will be listed and explained in the following steps: 1. Coding (determine the chromosomes of the GA): Each chromosome will have four genes that represent the number of neurons in the hidden layer, values of the training parameters (
,
, and
). The first gene is integer while the others genes are
real. 2. Population Initialization: The population of the individuals (chromosomes) will be initialized randomly in some pre-specified ranges, for this approach, the size of the population is set to 50 individuals.
4
3. Chromosomes Evaluating (Fitness Function of the GA): The whole goal is to get high classification accuracy with optimum NN that has a minimum number of neurons with lower training epochs. Thus our fitness function is as in equation (7). (7) where, layer,
is the error function of the neural network,
number of neurons at the hidden
maximum number of neurons possible at the hidden layer,
iterations needed by network for convergence,
number of
the maximum number of
iterations will be proposed for convergence which here is determined by 100. Finally,
is
the classification accuracy which is calculated as in equations (8) and (9). (8) (9) where ,
is the set of data items to be classified (the test set), returns the classification of
,
is the class of the item
by the neural network individual.
4. Reproduction (GA search): The time of the GA search is get after the population initialization and evaluation of each individual by the fitness function. The basic genetic operators guide this search are: 4.1 Selection: Selection is an important operation. A combination between two selected techniques; Ranking and Tournament will be used to select the two parents. 4.2 Crossover: For each genetic cycle, the two selected parents will be recombined by using the uniform crossover to produce one child with probability
.
4.3. Mutation: Each gene in the chromosome that obtained by the crossover will be muted by adding a value generated randomly in some range. 5
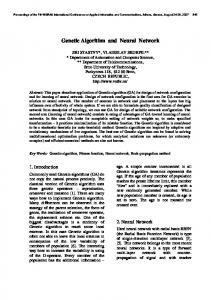
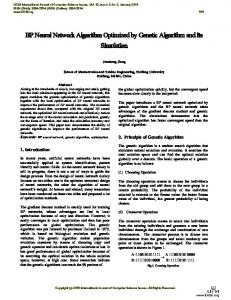
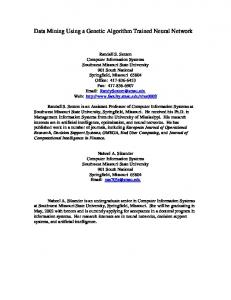
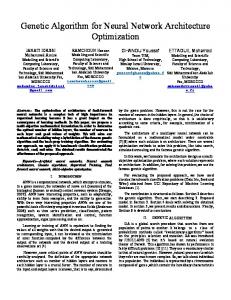
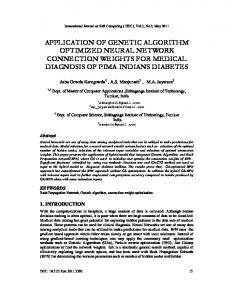
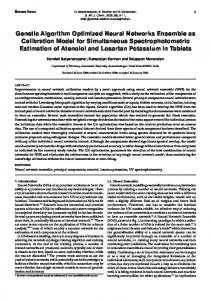
4.4. Replacement: After evaluating the new individual produced from the crossover and mutation, a selected individual of worse fitness will be replaced by the new individual under some condition. 5. Termination Conditions (GA Convergence): The proposed GA is iterated until either the number of the genetic cycles reaches to the predetermined maximum cycle’s number which in this work is set to 100 cycles or the first half of the finest part of the population is not changed for some cycles that set for 10 in this work. 4. Experimental Results. In order to compare the performance of the genetic neural network techniques, firstly, data set is normalized and split into groups of training set and testing set. The splitting process will be done randomly three times with specific proportion at each time (10% to 90%, 30% to 70% , and 50% to 50%) in order to form different training/testing groups. Table I shows the number of instances that used as training set and testing set for each group. For each training/testing pair the GA will be applied five times to find the optimum network topology that gives a high accuracy. In the experiment, MATLAB software is used to design and test neural network. Table II shows the results obtained by each group, while Figure I,II, and III show the training curve for the best network for each group The classification accuracies obtained by this and other studies for the selected thyroid disease dataset were presented in Table III. 5. Discussion and Conclusion. This paper presents a study on thyroid disease diagnosis by using neural networks with second order training algorithm. The genetic algorithm was used to find the optimum network structure with high classification accuracy. Three different proportions of training/testing groups are
6
formed. According to the results, it was seen that neural network structures could be successfully used to help diagnosis of thyroid disease. Another important thing emphasized here is the generalization ability of the networks. Hence, the performance of a neural network for inputs that are not in the training set can be seen. The experimental results at Table II show a high classification accuracy and convergence in rates for the different training/testing groups; overall accuracy of diagnosis is 100% for training and in range between 96% and 98% for testing. The proposed method achieved the highest accuracy rate when comparing the related previous studies except that which using genetic algorithm also [13] and it is improved by 1.77 and 3.46 in comparison with the two studies before the last one [11, 12]. 6. References. [1] R. Brause, "Medical Analysis and Diagnosis by Neural Networks", Medical Data Analysis, Springer-Verlag, Lecture Notes in Computer Science, vol. 20, PP. 1-13, (2001). [2] S. Kamruzzaman, A. Hasan, Ab. Siddiquee and Md. Mazumder, "Medical Diagnosis Using
Neural Network", 3rd International Conference on Electrical & Computer Engineering (ICECE 2004), 28-30 Dec. 2004, Dhaka, Bangladesh, (2004), [3] http.//www.medicinenet.com, accessed February (2011) [4] L. Ozyilmaz, and T. Yildirim, "Diagnosis of Thyroid Disease Using Artificial Neural Networks Methods", the 9th International Conference on Neural Information Processing (ICONIP 2002), vol. 4, pp. 2033-2036, (2002). [5] Aliev, R. A., and Aliev, R. R., "Soft Computing and its Applications", World Scientific Publishing Co. Pte. Ltd., Singapore, (2001). [6] A. Abraham, "Neuro-Fuzzy Systems: State-of-the-Art Modeling Techniques", School of Computing & Information Technology Press, Australia, (2001).
7
[7] R. Dybowski, and V. Gant, "Clinical Applications of Artificial Neural Networks", Cambridge University Press, (2001). [8] J. Dumont, R. Opitz, D. Christophe, G. Vassart, P. Roger, and C. Maenhaut, "The Phylogeny, Ontogeny,
Anatomy
and
Regulation
of
the
Iodine
Metabolizing
Thyroid",
www.thyroidmanager.org, revised Jul. (2008). [9] R. Gallagher, E. Lee, D. Patterson, "An Optimization Model for Constrained Discriminate Analysis and Numerical Experiments with Iris, Thyroid, and Heart Disease Datasets", A Conference of the American Informatics Association (AMIA), Journal of Annual Fall Symposium, pp. 209-213, (1996). [10] K. Polat, S. Sahan ,S. Gunes, "A Novel Hybrid Method Based On Artificial Immune Recognition System (AIRS) With Fuzzy Weighted Pre-Processing For Thyroid Disease Diagnosis", Expert System With Application, vol. 32, pp. 1141-1147 ,(2007). [11] F. Temurtas, "A Comparative Study On Thyroid Disease Diagnosis Using Neural Networks", Expert Systems With Applications, vol. 36, pp. 944-949, (2009). [12] F. Saiti, A. Naini, M. Aliyari, M. Teshnehlab, "Thyroid Disease Diagnosis Based on Genetic Algorithms using PNN and SVM", 3rd International Conference on Bioinformatics and Biomedical Engineering (ICBBE 2009), pp. 1-4, (2009). [13] C. Senol , T. Yildirim, "Thyroid and Breast Cancer Disease Diagnosis using Fuzzy-Neural Networks", IEEE, Electric and Electronics Engineering, ELECO 2009, International Conference on 5-8 Nov. 2009, Bursa, pp. II-390 - II-393, (2009). [14] UCI repository of machine learning databases, University of California at Irvine, Department
[15] D. Rumelhart, E. Hinton, and J. Williams, "Learning Internal Representations by Error Ppropagation". In: E. Rumelhart, and J. McClelland, (Eds.), "Parallel Distributed: Processing: Explorations in the Microstructure of Cognition", vol. 1, MIT Press, pp. 318–362, (1986). [16] L. Torvik, and B. Wilamowski, "Modification of the Back propagation Algorithm for Faster Convergence", International Simulation Technology Multi Conference, November 7-10 1993, pp. 191-194, (1993). [17] R. Battiti, "First- and Second-Order Methods for Learning: Between Steepest Descent and Newton’s Method", Neural Computation, vol. 4, no. 2, pp. 141-166, (1992). [18] M. Hagan, and M. Menhaj, "Training Feed Forward Networks with the Marquardt Algorithm”, IEEE Transactions on Neural Networks, vol. 5, no. 6, pp. 989-993, (1994). [19] H. Demuth, and M. Beal, "Neural Network Toolbox", User Guide, version 4, for use with Matlab, Massachusetts: The Math Works Inc., (1998). [20] D. Goldberg, "Genetic Algorithms in Search, Optimization, and Machine Learning", London, Addison-Wesley, (1989). [21] A. Rooij, L. Jain and R. Johnson, "Neural Network Training Using Genetic Algorithms", World Scientific Publishing Co., Inc. River Edge, NJ, USA (1996).
9
Group Number
Training Set
Testing Set
Total
1
21
194
215
2
64
151
215
3
107
108
215
Table I: Number of instances for each training/testing group.
1
2
3
6
0.067
6
0.116
100
2.74E-11
100%
96.91%
6
0.021
2
0.205
49
2.22E-13
100%
96.91%
6
0.006
4
0.300
35
1.91E-13
100%
96.39%
5
0.017
7
0.101
28
8.07E-13
100%
96.91%
6
0.084
10
0.283
67
9.57E-13
100%
97.42%
7
0.068
3
0.102
21
4.93E-13
100%
97.35%
6
0.043
10
0.501
65
9.31E-13
100%
97.35%
6
0.058615
10
0.25036
29
3.14E-13
100%
96.69%
5
0.031
9
0.745
64
3.56E-13
100%
97.35%
5
0.047
7
0.621
57
7.20E-13
100%
97.35%
8
0.021
7
0.321
73
9.05E-13
100%
97.22%
8
0.070
8
0.702
100
2.62E-11
100%
98.15%
12
0.083
4
0.359
48
5.35E-13
100%
97.22%
6
0.032
5
0.163
22
1.94E-13
100%
97.22%
14
0.037
5
0.259
63
9.29E-13
100%
97.22%
Table II: Experimental results show the optimum network by the marker rows for each group.
10
Figure I: Training curve of the best Network for group #1.
Figure II: Training curve of the best Network for group #2.
Figure III: Training curve of the best Network for group #3.
11
Gallagher, Lee, and Patterson
MIPM
81.8%
MLNN with BP
86.33%
MLNN with FBP (momentum)
89.80%
RBF
79.08%
CSFNN
91.14%
(1996) Ozyilmaz and Yildirım (2002) Polat, Sahan, and Gunes (2007)
ARIS
81.00%
ARIS with fuzzy weighted pre85.00%
processing
MLNN with LM
93.08%
LVQ
90.05%
PNN
94.62%
ANFIS
71.4%
Senol and Yilidrim
Fuzzy-MLP
88.53%
(2009)
Fuzzy-RBF
81.54%
Fuzzy-CSFNN
92.93%
Temurats (2009)
Saiti and Others
Proposed Method
PNN with GA feature selection
100%
GNN with LM (group #1)
96.91%
GNN with LM (group #2)
97.22%
GNN with LM (group #3)
97.41%
Table III: Classification accuracies obtained by this study with classification accuracies obtained by other studies