Time dependence of dislocation arrays in ice during recrystallization. J. van der Elsken and W. Bras. FOM Institute for Atomic and Molecular Physics, Kruislaan ...
PHYSICAL REVIEW B
VOLUME 54, NUMBER 5
1 AUGUST 1996-I
Time dependence of dislocation arrays in ice during recrystallization J. van der Elsken and W. Bras FOM Institute for Atomic and Molecular Physics, Kruislaan 407, 1098 SJ Amsterdam, The Netherlands
J. Dings and J. C. F. Michielsen University of Amsterdam, Amsterdam, The Netherlands ~Received 11 December 1995; revised manuscript received 12 March 1996! Small-angle x-ray scattering ~SAXS! from growing ice crystals shows sharp diffraction peaks at varying angles of reflection. The peaks have low intensities and rise and fall with a relaxation time of 100 to 1000 sec. The small widths point to superstructures with well defined dimensions. A quantitative analysis shows that these dimensions conform to the distances in coincident site lattices that are generated by two hexagonal ice lattices slightly rotated with respect to one another. It is concluded that the sharp SAXS reflections are caused by arrays of edge dislocations in small angle grain boundaries that develop during the growth of ice crystals and disappear during the recrystallization process. @S0163-1829~96!07029-4#
INTRODUCTION
small angle grain boundaries lie at the origin of the x-ray scattering features at small k values in the 0.1–2 nm21 range.
A macroscopic sample of water cooled below the normal melting temperature will supercool and at a rather unpredictable moment start to freeze.1 The freezing of such a sample is such a complicated process that it is difficult to separate nucleation, initial growth, and recrystallization stages.2,3 It is quite well established that dislocations form during the growth of an ice crystal. The movement of dislocations emerging at the growing interface may be an important aspect of the growth mechanism.4 A direct observation of the dislocation behavior in the course of time will help to establish the role in the overall growth process. We have reported earlier on the occasional occurrence of interference peaks seen with small-angle x-ray scattering.5 At the time we noticed that of the three values at which such peaks had been found, 1.07, 0.54, and 0.34 nm21, the 1.07 value corresponds with a rational ratio of the k value of a normal Bragg reflection of the bulk lattice. It was therefore assumed that a superstructure with an incommensurate modulation of the ice lattice gives rise to the observed features. As to the origin of this modulation we assumed that a screw dislocation with a Burgers vector along the @001# direction could give rise to such a modulation along the @001# axis. This explanation found no further support in our measurements and was not quite satisfactory. We therefore undertook an extensive and systematic search for the occurrence of similar x-ray scattering features on which we here report. In view of the transient character of the interference peaks that we found before, we limited the averaging in the measurements to 20 sec instead of the formerly used 700 sec to enable us to also detect short lived interferences. This did indeed result in the detection of many more peaks at different values of the wave vector. This finding is not in accordance with our earlier ideas about the origin of these peaks, since it is unlikely that screw dislocations in the @001# direction would have so many different pitches. However, the experimental material that we present here does also suggest a different explanation. It will be shown convincingly that 0163-1829/96/54~5!/3110~5!/$10.00
54
EXPERIMENT
The experiments were performed at the Synchrotron Radiation Source at Daresbury, U.K. The intensity of the beam of x-ray radiation used was about 1011 photons per sec at a wavelength of 0.15 nm. The width of the beam was 2 mm and the height 0.5 mm. The total intensity of the photon beam and the absorption of the sample were monitored by two ion chambers, one in front and one behind the sample cell. Scattering was measured as a function of the scattering angle from the direct beam defining a scattering wave vector k5~4p/l!sin u. The scattered intensity at small angles was measured with a quadrant detector6 at a distance of 4.50 m giving an accessible wave vector range of k50.1–2 nm21. A commercially available curved Inel delay line detector allowed simultaneous detection of wide angle scattering with a wave vector range between 8 and 30 nm21.7,8 Wet collagen and lead stearate were used for the wave vector calibration of the small angle detector. The Bragg reflections of the ice crystals constituted a calibration for the wide angle diffraction. Water samples were contained in a capillary made of Lindemann glass. The commercial available capillaries were flattened in a carbon mould so that tubes with an approximately rectangular cross section were obtained with flat sides of 5320 mm2. The optical pathlength was 160.05 mm and the wall thickness 0.0160.004 mm. Cooling of the samples was achieved by cooling a copper block surrounding the sample. The water used was double distilled, deionized, filtered through a 0.1 mm membrane filter and finally degassed and vacuum distilled. The capillary was filled with water immediately before the measurement. The water sample was cooled at a rate of 0.01 K/sec. Under the applied conditions freezing may start at temperatures anywhere between 261 and 247 K. This unpredictable and irreproducible onset of freezing is an inherent consequence of the nucleation process.9 We therefore recorded diffractograms every 20 sec, which were only retained after the first 3110
© 1996 The American Physical Society
54
TIME DEPENDENCE OF DISLOCATION ARRAYS IN . . .
3111
number of 20 sec measurements, longer averaging times have only the effect of blotting out the effect. DISCUSSION
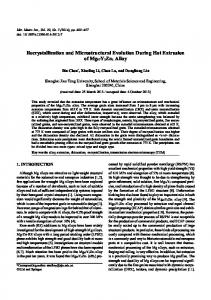
FIG. 1. Example of a time series of small angle scattering intensity of a freezing water sample. The original traces were corrected for detector response and background. The central peak is not shown. The temperature decreases with 0.1° sec21; freezing starts at 214 °C.
signs of ice formation, i.e., after the appearance of sharp Bragg peaks superimposed on the broad first peak of S~k! of liquid water. This method allowed us to collect about 10 000 diffractograms of 50 different freezing events. RESULTS
A temperature measurement, with a thermometer attached to the capillary shows release of heat during the first 100 sec after freezing sets in. Different Bragg peaks from low index lattice planes arise and disappear completely during this time. Evidently the growing ice crystals change their orientation with respect to the wide angle line detector very rapidly. After this initial period a slower process of recrystallization sets in. Over periods of sometimes several hours one can follow the changes of relative intensities of the low index Bragg peaks. The relaxation times are in the order of 1000 sec. The results in the small angle scattering region from 0.1 to 2 nm21 were recorded simultaneously with the wide angle data. In the first 100 sec an intense central line appears, of about 0.1 nm21 width, which may arise from contributions by features of length scales larger than about 60 nm. The flat part between 0.2 and 2.0 nm21 becomes lower as a consequence of the lower compressibility of ice as compared to supercooled water; see Fig. 1. During the initial period or during the long process of recrystallization, in about 50% of the runs sharp reflections of very low intensity can be seen. Such reflections appear and disappear with relaxation times in the order of 100 to 1000 sec and are found at about 30 different k vectors. In Fig. 1 three of such reflections appear directly after freezing, which is rather an exception. The k values are 0.65, 0.96, and 1.81 nm21 of which the second disappears in about 200 sec whereas a reflection at 1.04 nm21 emerges. Table I gives a list of all the different k values found. Of these reflections only three were so intense that we could quantitatively measure the intensity change as well as the shifting position as a function of time. These results are shown in Fig. 2. However, most of the observed structure barely exceeds the noise level. Since such structures rise and disappear within the time of only a limited
What we have obtained is a rather rough and incomplete picture of the scattering processes in the small wave vector region, but it does allow us a glimpse of the underlying physics. The observation of the time dependence of the intensity of some of the small angle reflections, together with a small but significant shift of the wave vector, is of great importance. It excludes all possible instrumental sources of spurious reflections and interferences. Obviously we see processes that give rise to transient constructive interferences. Moreover, many of the observed values are close to rational fractions of the wave vectors at which the normal Bragg reflec¯0% and $112 ¯0% lattice planes are found ~Table tions of the $101 I!. This could be understood if somehow a superstructure would form with length scales one or two orders of magnitude larger than the length scale of the hexagonal unit cells of ice, but almost at multiples of the interplanar distances d 10050.3907 nm and d 11050.2255 nm.13 Intensity at such small wave vectors might arise from temporary constructive interferences by a nonuniform electron density distribution during the passage from one superstructure to another. Since the relative width of the peaks is about Dk50.01 nm21 at k51 nm21, the correlation of these superstructures extends over more than 100 unit cells. The relaxation times deduced from the three cases shown in Fig. 2 vary from an estimated t51000 sec in the case of the reflection at 0.85 nm21 to a well defined t5300 sec for the growth and t5400 sec for the decay of the reflection at 1.31 nm21. Many of the other reflections have even shorter lifetimes. Writing t5t0 exp (Dg 6 /kT) and estimating the as kT/h51012 sec21 we find attempt rate t 21 0 6 219 Dg 5~1.260.1!310 J per atom as a range of free enthalpy of activation concomitant with the three observed cases. A comparable value for the enthalpy of activation has been reported for the very sluggish transition from the unstable cubic ice to the hexagonal ice between 160 and 210 K.10 The value is what one would expect for the energy of the hydrogen bond. Clearly the breaking and forming of hydrogen bonds is the energy limiting step in the processes leading to the transient intensities of the small angle reflections. The low intensities, the many different values of the wave vectors that we observed, the widths and the time dependence of the peaks in the small angle region did arise the surmise that these peaks are interferences from two dimensional superstructures in well defined grain boundaries. The origin of such long range structures in grain boundaries is given by the geometric description of coincident site lattices.11 DISLOCATION NETWORKS
Two identical crystal lattices which are slightly rotated with respect to one another over an angle Q, and joined together form a new unit with occasional corrections in the form of a dislocation. If the boundary between the two crystal domains is planar, it consists of a regular network of dislocations. Such a boundary causes an excess energy com-
3112
54
van der ELSKEN, BRAS, DINGS, AND MICHIELSEN TABLE I. The odd rational ratios of the k values associated with the interplanar distances d 100 and d 110 , in nm21. The angles, in degrees, for pure tilt boundaries with the axis of rotation parallel to the c axis as predicted by coincident site lattice theory. The k values associated with the superstructures found at those ¯00& and the ^1000& direction, respectively, and the experimentally found angles, two series vicinal with the ^11 k values of small angle interference peaks, all in nm21. (2n11) 21 k 110 27.86 nm21 9.29 5.57 3.98 3.10 2.53 2.14 1.86 1.64 1.46 1.33 1.21 1.11 1.03 0.96 0.90 0.84 0.80 0.75 0.71 0.68 0.65 0.62 0.59 0.57 0.55
(2n11) 21 k 100
u
¯00& CSL ^11
^1000& CSL
nm21 16.08
120° 60 38.2 27.8 21.8 17.9 15.2 13.2 11.6 10.4 9.4 8.6 7.9 7.3 6.8 6.4 6.0 5.7 5.4 5.1 4.8 4.6 4.4 4.2 4.0 3.9
13.93 nm21 8.04 5.27 3.86 3.04 2.50 2.12 1.84 1.63 1.46 1.32 1.21 1.11 1.03 0.96 0.90 0.84 0.80 0.75 0.71 0.68 0.65 0.62 0.59 0.57 0.55
nm21 13.93
5.36
3.22
2.30
1.79
1.46
1.24
1.07
0.95
posed of the core energy of the dislocations and the strain energy associated with the misfit of the two lattices along the boundary. This strain energy is a function of the distance between the dislocations and the orientation of the plane of the boundary. Minima in this energy function are found in
Experiment 13.94 nm21
nm21 13.94
5.27
3.20
2.29
2.14 1.81 1.64 1.40 1.31 1.22
2.27
1.78
1.04 0.96
1.74
1.46
0.85 0.81 0.75
1.40
1.24
1.22 0.67 0.65
1.07
0.95
1.07 0.57 0.55
0.96
cusps where the spacing between dislocations is an integral number of lattice spacings. This will favor very specific boundaries between grains and specific relative orientations between microcrystals. The location of the minima for arbitrary large angle
FIG. 2. The value of the scattering vector and the relative intensity as a function of time for three selected SAXS interference peaks.
TIME DEPENDENCE OF DISLOCATION ARRAYS IN . . .
54
boundaries can be found with a geometric description of coincident site lattices ~CSL! as given by Bollman.12 One brings two interpenetrating mathematical translation lattices A and B in a position that one of the points of A coincides with one of the points of B and takes this point as the origin. Rotation of one of the lattices around this origin may or may not give any more points of coincidence. In fact, for a mathematical point lattice, if there is any coincident point there are an infinite number of coincident points. These points then form a lattice of coincident sites. The rotation angle for which a coincident site lattice arises can be found by solving ¯ 21x1t, where ¯ the equation x5R R is a rotation matrix and Wt are the translation vectors of the original lattice. Here we shall restrict this procedure to the special case of a pure tilt boundary with the orientation of the axis of rotation coinciding with the c axis of the hexagonal lattice P6 3/mmc of ice. In that case the dislocations are edge dislocations with the Burgers vector perpendicular to the axis of rotation. With the boundary in a symmetrical position between the two crystals the Burgers vector lies also perpendicular to the boundary. When the plane of the boundary makes an angle with the symmetric orientation two sets of dislocations might form. The possible angles of rotation corresponding with the most stable boundaries can be found analytically. We work in an orthogonal coordinate system. The unit vectors of the crystal coordinate system can be chosen along the ^1000& direction ¯00& direction of the hexagonal lattice. The or along the ^11 transformation matrices are
S5
S
1 0
2 21 1 2
)
D
or S5
S
3 2
2 12 )
D
0 , )
R 21 ) 21 by the respectively. By multiplying the matrix (I¯2 ¯ column vectors of S we obtain the unit vectors of possible CSL points in orthogonal coordinates: x5 @ 21 cot~ Q/2! , 21 # , x5 @ 21 ), 12 ) cot~ Q/2!# . The rotation angle Q appears in only one of the coordinates and the condition for coincidence of the lattice points in both lattices after rotation is simply given by cot~Q/2!5)~2n11! or cot~Q/2!51/3)~2n11!, respectively. The resulting CSL points lie in the hexagonal basal plane. The points form a row, parallel with ^1000& and one lattice distance d 100 re¯00& and a lattice moved, or a row that is parallel with ^11 distance d 110 removed. The upper part of Fig. 3 shows a section of the basal plane with the origin and those CSL points. Each point defines a different hexagonal lattice of coincident sites and has a value of the wave vector k52p/D at distance D from the origin. Values of the angles Q and the corresponding wave vector values are given in Table I. From the geometry it is clear that the small angle CSL points have k values close to the values of the rational fractions of the scattering vector corresponding with the lattice distances in ¯00& directions. The input values of the the ^1000& and ^11 lattice spacings of the ice unit cell were corrected for the temperature: d 10050.3907 nm and d 11050.2255 nm.13
3113
FIG. 3. Lattice representing the oxygen positions in the basal plane of an ice lattice. The coincident site lattice points that are obtained by rotation around the c axis are circled and indicated with their associated k vector values. Each single CSL point in combination with the origin represents a set of points that form a hexagonal ~mathematical! superlattice, where in this special case the periodicity in the direction of the c axis is the normal periodicity of the ice lattice. Solid lines give the basis vectors for the row of CSL points parallel with ^1000& and dotted lines those for the CSL points ¯00& ~top!. Grain boundaries form preferably along parallel with ^11 low index planes of these superlattices, giving rise to a two dimensional ~physical! superstructure. A symmetric boundary through the 1.84 nm21 CSL points is shown as an example ~bottom!. IMPLICATIONS
The preceding paragraph gives only one example of a series of CSL points, namely those generated by a rotation around the c axis. It is however a series that perfectly fits our experimental data. Table I shows the k values that were observed as interference peaks, together with the calculated k values. The correspondence constitutes a very convincing support for the assumption that the observed peaks arise from regular arrays of edge dislocations. Such arrays are found in grain boundaries that coincide with planes of coincident site lattices. The grain boundaries make very specific angles with the hexagonal ice lattice, because the interfacial energy of these boundaries is relatively low. Most of the experimentally found k values correspond with CSL planes ¯0% planes. Most of these values and boundaries vicinal to $112 were only observed occasionally and the intensities were very low. Interference peaks corresponding with scattering vectors k51.84, k51.32, k51.03, and k50.84 nm21 and rotation angles Q513.2°, 9.4°, 7.3°, and 6.0° show sometimes quite a large intensity. At these angles CSL points arise ¯00& directions and the local symmetry also along the ^11 around the CSL points at these four angles is higher. Therefore boundaries going through these specific CSL points may well have relatively low strain energy and hence deeper cusps in the energy surface resulting in a higher probability of occurrence. The prominent appearance of precisely those four interferences can therefore be considered as a support of the interpretation given here. Moreover, such boundaries are symmetric and can be described as an array of parallel edge dislocations with the Burgers vector of an inserted double
3114
van der ELSKEN, BRAS, DINGS, AND MICHIELSEN
54
We have restricted our considerations to pure tilt boundaries with the axis of rotation parallel to the c axis of the hexagonal ice crystal. Clearly there are many more possibilities for the axis of rotation, and pure tilt, pure twist, as well as mixed character boundaries might give rise to superstructures. We considered in particular the consequences of twinning along the twin planes favored in hexagonal crystals, with boundaries in symmetrical as well as in asymmetrical positions. Although occasional agreement between a predicted and an experimental k value was found, no such convincing quantitative agreement as given in Table I could be achieved. We must also reject a generalization of the explanation that we gave earlier5 of the appearance of the diffraction peak at 1.03 nm21. It has been argued that this particular value is very close to the value corresponding with eight times the repeat distance along the c axis and could therefore be associated with the pitch of a screw dislocation with Burgers vector along that axis. This assumption is plainly refuted by the amount of different superstructure k values that we found. Yet a grid of screw dislocations could give a pure twist boundary. Such boundaries would also form preferably under specific angles determined by CSL theory, and hence give rise to two dimensional super structures with specific distances and k vectors. Again, we could not find any correspondence with the experimental values. Apparently the ¯0% and small angle pure tilt grain boundaries vicinal to $112 ¯ $1010% planes form easily in the growth process that proceeds predominantly perpendicular to the c axis.
plane. This situation is illustrated in the lower part of Fig. 3 for a boundary through 1.84 nm21 CSL points. The rotation ¯0% planes meet at the boundary constitutangle is 13.2°, $101 ing edge dislocations with Burgers vector /b/52d 100 . It is clear from a consideration of the geometry of the figure that a nonuniform relaxation must occur to accommodate the oxygen atoms between the CSL points. This relaxation allows for a slight constructive interference at small k vectors corresponding with the large distances between the successive CSL points. It remains to account for the gradual shift of the k value such as can clearly be seen in the case of the interference peak at k51.03 nm21 shifting in about 1000 sec towards k51.07 nm21, thereby diminishing the intensity to zero. The distance between successive dislocations is D5b/$2 sin~Q/ 2!%56.14 nm with corresponding k52p/D51.03 nm21, where u b u 52d 100 and Q57.3°. A gradual relaxation of such a low angle symmetric grain boundary may be achieved by transition to an asymmetric boundary with two single inserted planes at 60° angles. Withdrawal of these planes will lead to a final situation with the boundaries following the prismatic planes and a gradual change of the repeat distance ¯0% to the nearest multiple lattice distance d 100 in the $101 plane along a ^1000& axis. For the Q57.3° boundary this would be 26d 100 giving k51.07 nm21. In the equilibrium situation the perfect periodicity is regained and constructive interference only occurs at the k values corresponding with the smallest interplanar distances. Hence the decrease of intensity of the small angle peak and the total disappearance when the equilibrium value of k is reached ~Fig. 2!. The behavior of the Q59.4° boundary is completely analogous. The k value of the associated peak shifts from 1.31 nm21, close to the CSL value, to 1.27 nm21, a point corresponding with 22d 110 distances. When the latter value is reached the intensity drops to zero as expected. The case of the Q56.0° boundary with the peak at 0.84 nm21 is less clear because the measured time interval was too short to pronounce upon the final value of k after relaxation. There is a k50.82 nm21 point corresponding with 34d 110 distances nearby.
We want to thank the staff of the Daresbury Synchrotron Laboratories for their assistance. This work is part of the scientific program of the Foundation for Fundamental Research of Matter ~FOM! and was made possible by financial support from the Netherlands Organization for Research ~NWO!.
Water, A Comprehensive Treatise, edited by F. Franks ~Plenum, New York, 1982!, Vol. VII. 2 R. K. Kadiyala and C. A. Angell, Colloids Surf. 11, 341 ~1984!. 3 D. W. Oxtoby, Adv. Chem. Phys. LXX, 263 ~1988!. 4 J. Keizer, P. Mazur, and T. Morita, Phys. Rev. A 32, 2944 ~1985!. 5 J. C. F. Michielsen, J. Dings, and J. van der Elsken, Phys. Rev. A 44, 4068 ~1991!. 6 R. A. Lewis, I. Summer, A. Berry, J. Bordas, A. Gabriel, G. Mant, B. Parker, K. Roberts, and J. Worgan, Nucl. Instrum. Methods 217, 216 ~1983!. 7 W. Bras, G. E. Derbyshire, G. R. Mant, A. Felton, R. A. Lewis,
C. J. Hall, and G. N. Graves, Nucl. Instrum. Methods A 36, 587 ~1993!. 8 W. Bras, G. E. Derbyshire, A. J. Ryan, G. R. Mant, R. E. Cameron, and W. Mormann, J. Phys. IV Colloq. 3, C8-448 ~1993!. 9 N. H. Fletcher, The Chemical Physics of Ice ~Cambridge University Press, Cambridge, England, 1970!. 10 J. A. McMillan and S. C. Los, Nature 206, 806 ~1965!. 11 J. P. Hirth and J. Lotte, Theory of Dislocations ~Wiley, New York, 1982!. 12 W. Bollmann, Crystal Defects and Crystalline Interfaces ~Springer-Verlag, Berlin, 1970!. 13 L. G. Dowell and A. P. Rinfret, Nature 188, 1144 ~1960!.
1
ACKNOWLEDGMENTS