Dec 3, 2014 - arXiv:1412.1445v1 [cond-mat.mtrl-sci] 3 Dec 2014. Time-dependent density functional theory of high-intensity, short-pulse laser irradiation on ...
Time-dependent density functional theory of high-intensity, short-pulse laser irradiation on insulators
arXiv:1412.1445v1 [cond-mat.mtrl-sci] 3 Dec 2014
S.A. Sato Graduate School of Pure and Applied Sciences, University of Tsukuba, Tsukuba 305-8571, Japan K. Yabana Center for Computational Sciences, University of Tsukuba, Tsukuba 305-8577, Japan and Graduate School of Pure and Applied Sciences, University of Tsukuba, Tsukuba 305-8571, Japan Y. Shinohara Max-Planck-Institut f¨ ur Mikrostrukturphysik, Weinberg 2, D-06120 Halle, Germany T. Otobe Advanced Photon Research Center, JAEA, Kizugawa, Kyoto 619-0615, Japan K.-M. Lee Center for Relativistic Laser Science, Institute for Basic Science, Gwangju 500-712, South Korea G.F. Bertsch Department of Physics and Institute for Nuclear Theory, University of Washington, Seattle 98195, U.S.A.
1
Abstract We calculate the energy deposition by very short laser pulses in SiO2 (α-quartz) with a view to establishing systematics for predicting damage and nanoparticle production. The theoretical framework is time-dependent density functional theory, implemented by the real-time method in a multiscale representation. For the most realistic simulations we employ a meta-GGA KohnSham potential similar to that of Becke and Johnson. We find that the deposited energy in the medium can be accurately modeled as a function of the local electromagnetic pulse fluence. The energy-deposition function can in turn be quite well fitted to the strong-field Keldysh formula for a range of intensities from below the melting threshold to well beyond the ablation threshold. We find reasonable agreement between the damage threshold and the energy required to melt the substrate. The ablation threshold estimated by the energy to convert the substrate to an atomic fluid is higher than the measurement, indicating significance of nonthermal nature of the process. A fair agreement is found for the depth of the ablation.
2
Introduction. Ablation of surfaces by intense femtosecond laser pulses is potentially a useful tool for material machining as well as preparation of nanosized particles1–11,21 . It is important to have good models of the energy deposition and the ablation process to set up the pulse protocols for the purpose in mind. However, it is not easy to model the laser-target interaction because one has to deal with the quantum physics at the atomic scale together with the pulse propagation at a mesoscopic scale. There is a large literature on the modeling of the laser-target interaction dynamics2,9,12–18 , as reviewed in Ref.19 as well as Ref.11 . The fundamental physics is the excitation of particlehole pairs, often parameterized by Keldysh’s approximate formulas20,21 . The particle and hole carriers affect the electromagnetic response of the insulator, screening the field when their density becomes large. Here the effects are often parameterized by hybrid dielectric functions containing contributions intrinsic to the insulator and plasma contributions from the excited electrons. Both aspects of this electron dynamics are included in the timedependent density functional theory (TDDFT), which is fully quantum mechanical and doesn’t require any specific assumptions about the dynamics. It also gives a good compromise between ab initio theory and computational feasibility. In this work we shall apply the dynamic equations of TDDFT to calculate the propagation of short, intense electromagnetic pulses upon insulators and compute the energy transfer to the medium. In recent work, TDDFT with strong fields has been applied to condensed media in several contexts: coherent phonon generation22,23 and high-field interactions with diamond, silicon and quartz24–29 . In this work, we treat the energy transfer to a crystalline SiO2 , α-quartz, a material of technological importance. The calculations require high-performance computers, so our goal is to also analyze the results in terms of simpler models that can be easily applied. We only discuss the deposited energy of the pulse, which is the most important determinant of the subsequent atomic dynamics. Since TDDFT employing practically usable functionals does not have any relaxation processes, it is limited to short-time dynamics. The main limitations to consider are the electron-electron kinetic relaxation time τee , the full electron thermalization time, and the electron-phonon equilibration time. The latter two processes have time scale much larger than 100 fs, which is well beyond the time domain considered here. Estimates of τee range from 1 fs to 100 fs9,10,30,31 . Fortunately for the modeling by TDDFT, the response of insulators to high fields is rather insensitive to the kinetic equilibration32 . We note that on very long time scales another mechanism that 3
is missing from TDDFT becomes important, namely an avalanche of electrons in the free carrier bands15 . Computational method. The theory and its implementation used in the present calculation has been described elsewhere26 , so we will just summarize the major points. The dynamics ~ r , t) as are derived from a Lagrangian that includes the full electromagnetic gauge field A(~ well as the Kohn-Sham dynamics of the TDDFT. Thus the equations of motion can describe the pulse propagation from the vacuum into the medium and its attenuation by exciting electrons from the valence to the conduction band. The quantities of interest vary on a scale of micrometers, while the electron dynamics requires a sub-nanometer scale. This conflict is ~ overcome by separating contributions to the electric field into a contribution ∂ A/c∂t varying ~ that has the full atomic-scale variation in only on the larger scale and a contribution −∇φ the crystalline unit cell. The coupling between the scales arises from the current J~ associated with the electrons in the unit cell. In this work we use a modified Becke-Johnson exchange-correlation potential (mBJ)33 as given by Ref.34 (Eq. 2-4). The calculated indirect band gap with this potential is 1.3 eV lower than the experimental gap of 8.9 eV, but more relevant to electromagnetic interactions is the optical gap. This is calculated to be 9 eV from the absorptive part of the dielectric function for the mBJ potential, compared to the experimental value of 9−10 eV. We compute the energy transfer to the medium from the electromagnetic side, since the calculation from the Kohn-Sham densities would require an explicit energy density functional for the mBJ potential. The energy transfer rate W is given by W = −E~ · J~,
(1)
where E~ is the electric field associated with the pulse. In comparing different pulse lengths and intensities, we find the most convenient measure of the pulse strength is its fluence F R ~ × B, ~ where x is the depth from the surface. With these given by F (x) = (c/4π) dtˆ x·E R
d F (x). definitions, the deposited energy density is given by Ex (x) = − dtW (x, t) = − dx
Our multiscale calculation uses a one-dimensional grid with spacing of 250 au for propagation of laser electromagnetic fields. At each grid point, electron dynamics is calculated using atomic-scale rectangular unit cell containing 6 Silicon atoms and 12 Oxygen atoms which are discretized into Cartesian grids of 20 × 36 × 50. The dynamics of the 96 valence electrons is treated explicitly; the effects of the core electrons are taken into account by 4
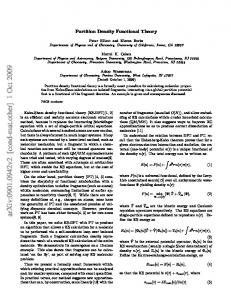
0.6
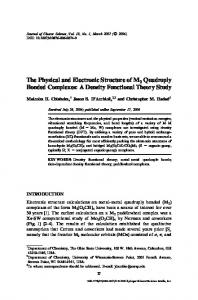
Reflectivity
0.5 0.4 0.3 0.2 0.1 0 0.1
1
10 2
F (J/cm )
FIG. 1. The reflectivity at the surface of α-quartz as a function of fluence. Red circles show results using mBJ potential, while green squares show results using the LDA functional taken from Ref.28 .
pseudopotentials35 . Both electromagnetic fields and electrons are evolved with a common time step of 0.02 au. ~ t) of the form The laser pulse in the vacuum is described by a gauge field A(x, ~ t) = zˆA0 sin2 (πtx /Tp ) cos(ωtx ) A(x,
(2)
in the domain 0 < tx < Tp and zero outside. Here ω is the photon’s angular frequency, tx = t − x/c describes the space-time dependence of the field, and Tp controls the pulse length. It is related to the usual measure τp (full width at half-maximum intensity) by τp = 0.364Tp . Most of the results below were calculated for an average photon energy of h ¯ ω = 1.55 eV and the pulse length of τp = 7 fs. We follow the pulse from the time its front reaches the surface (¯210) until it has propagated several µm into the material. Results. We first note that our calculated reflectivity of α-quartz, shown in Fig. 1, is close to 4% for laser fluence below 1.5 J/cm2 increasing to about 35% at fluence 10 J/cm2 . The rise at high field intensity is due to the screening effect of an electron-hole plasma that is formed. The Figure shows the reflectivity for both the mBJ potential and the LDA 5
2
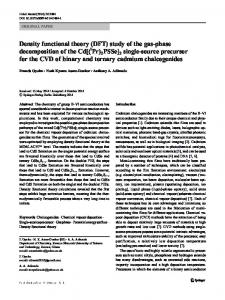
I0 (W/cm ) 13
10
14
15
10
10
2
10
1
Ex (eV/Atom)
10
0
Cohesive energy
10
-1
10
Melting energy
-2
10
-3
10
-4
10
-5
10
0.1
1
10 2
F (J/cm )
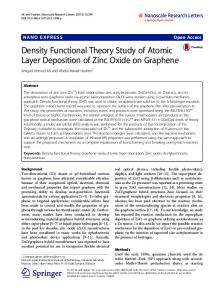
FIG. 2. Deposited energy Ex at the surface of α-quartz is shown, as a function of the fluence and the peak intensity of the pulse. Red circles show results using mBJ potential, while green squares show results using LDA functional28 .
energy functional from Ref.28 . One may see that the screening has a lower threshold for LDA functional. This can be attributed to the lower band gap in LDA, permitting a more dense plasma to form. The main quantity we can calculate is the deposited energy Ex as a function of penetration depth x. The range of interest extends roughly from the energy required to melt the solid to the energy required to vaporize it. The first transition requires about 0.5 eV/atom in quartz, starting from room temperature. The second transition is not as well defined; we can estimate it as 6 eV/atom either as the heat of formation or from the “atomic-liquid” transition reported in Ref.36 . A sampling of the results for the multiscale calculation is shown in Figs. 2-7. In Fig. 2, we show the deposited energy density at the surface for a range of laser fluences. The threshold for achieving melting is ∼ 1.5 J/cm2 , while the vaporization threshold as we have defined it is at ∼ 2.5 J/cm2 . Thus, for applications that physically transform the material, 6
Ex (eV/Atom)
100
10
Cohesive energy
1
Melting energy
0.1
0.01 0
0.2
0.4
0.6
0.8
1
x [µm] FIG. 3. Deposited energy Ex in α-quartz as a function of distance below the surface. The curves show the results for intensities I0 = 0.5, 0.75, 1.0, 1.5, 2.0, 2.5, 5.0, 10.0, 20.0 × 10¹⁴ W/cm2 from lowest to highest graph. The pulse length is τp = 7 fs for all intensities.
we need to only consider fluences of the order 1.5 J/cm2 and and higher. The Figure shows the deposited energies of lower strength pulses as well, which may be of interest to analyze the parametric dependence of the energy deposition on the characteristics of the pulse. The Figure also shows the results for the LDA functional. One sees that lower-fluence pulses are more highly absorbed in LDA . This is to be expected due to the small band gap. The difference becomes small and even changes sign at high fluence. A possible explanation might be an increased screening for the LDA, as was discussed for the reflectivity. The dependence of Ex on the depth in the medium is shown in Fig. 3 for a range of pulse intensities, all with pulse length of τp = 7 fs. One sees that the melted region extends to a depth of 0.5-0.6 µm for the stronger pulses. The depth permitting ablation only extends to 0.13 µm for a pulse of 10 times the threshold intensity. Fig. 4 compares the pulse profile for the I0 = 1015 W/cm2 pulse at two points, in the first cell and in the 80th cell at a depth of 1.06 µm. At this depth, the intensity has decreased 7
0.1
E
(a.u.)
0.05
0
-0.05
-0.1 0
5
10
15
20
t (fs) FIG. 4. Pulse shapes at the first cell and at the 80th cell located at a depth of 1 µm are shown, for an incident pulse having intensity I0 = 1015 W/cm2 and length τp = 7 fs.
below the melting threshold. One sees that the shapes are quite similar. The main difference is that the attenuation is stronger in the later arriving cycles of the pulse train. This is to be expected; the early part of the pulse creates particle-hole pairs which can then modify the propagation of the rest of the pulse. Approximate description. The mild changes in pulse shape suggest that the energy deposition might be modeled simply as a function of the strength of the pulse as it is attenuated in the medium. To see how well this works, we extract the local fluence of the pulses at the different cells in our simulation. The absorbed energy versus the local fluence for the range of pulses shown in Fig. 3 is plotted in Fig. 5. We see that they fall on a common line, extending down to a fluence of 1 J/cm2 , well below the damage threshold. Thus, the change in pulse shapes can indeed be neglected, at least for tp = 7 fs pulses. Remarkably, the dependence can be very well fitted following Keldysh’s strong-field ionization rate equation21 (Eq. (9)). An approximate formula expressing the energy deposition in terms of the fluence 8
Ex (eV/Atom)
100 10 1 0.1 0.01 1
10 2
F [J/cm ]
FIG. 5. Absorbed energy is plotted as a function of local fluence of pulses. Black solid curve shows a fit by Keldysh’s formula.
is Ex = AF 5/4 exp(−B/F 1/2 ).
(3)
The two-parameter fit (A = 70 eV-(J/cm2 )−5/4 ,B= 4.0(J/cm2 )1/2 ) is shown as the solid black line in the Figure. One sees that the fit is valid from fluences from well below the thresholds to the highest calculated. The fit value B = 4.0 can be compared to the value obtained from a reduction of Keldysh’s exponential factor, B = πτp1/2 m1/2 ε1/4 ∆3/2 /2,
(4)
in atomic units. Taking the reduced mass m = 1/2, the direct band gap ∆ = 9 eV, and the dielectric constant ε = 2.3, Eq. (4) gives B = 4.2, a difference of only 5% from the fit value. The multiphoton process is only relevant at much lower fluences that are needed for structural changes. Experimental. While it is not entirely clear how energy deposition profiles link to structural changes in the surface region, we can still compare the theory and experiment assum9
2
2
F (J/cm )
2.5
1.5 1 0.5 0 0
5
10
15 τp (fs)
20
25
30
FIG. 6. Threshold damage and threshold ablation fluences in SiO2 are shown as a function of pulse width τp . Red and green circles are the calculated fluences to deposit an energy Ex = 0.5 eV/atom corresponding to a damage threshold and an energy Ex = 6 eV/atom corresponding to an ablation threshold in α-quartz, respectively. Experimental data from Ref.9 for fused silica is shown with green and red squares; data from Ref.21 is shown with red triangle.
ing that the melting and vaporization transitions control the surface damage and ablation. There are many measurements of thresholds for these quantities, but only a few for pulse as short as τp ∼ 20 fs or below4,5,9,21 . Fig. 6 shows a comparison with the data of Refs.9,21 for fused silica. For the damage threshold shown by red symbols, we compare with calculated fluences to achieve Ex = 0.5 eV/atom at the surface. We see that the experimental threshold is in qualitative correspondence with that value. The ablation threshold, shown by green symbols, is much lower than predicted by the Ex = 6 eV/atom criterion based on the formation of an atomic liquid36 . This may indicate an importance of nonthermal effects in the ablation process by femtosecond laser pulses37,38 . In fact, the reported thresholds for damage and ablation at τp = 7 fs in Ref.9 are nearly identical. This may be seen by the sharp edges of the ablation craters formed at the shortest pulse lengths. Perhaps one needs 10
140 120
x (nm)
100 80 60
Ablation Depth
40 20 0 0
2
4
6
8
10
12
14
16
2
F (J/cm )
FIG. 7. Depth of crater formed in SiO2 by single laser pulses of length τp = 7, as a function of the fluence of the original pulse. Experiment is shown in blue squares, from Ref.10 . The red circles show the depth at which the calculated energy deposition falls below Ex = 6 eV/atom.
to consider a different mechanism for ablation at threshold, which may involve the electric fields produced when excited electrons are ejected from the surface. It should also be kept in mind that damage threshold depends on structures of the material; a lower threshold is reported for fused silica than crystalline SiO2 using much longer pulses39 . As a final theory-experiment comparison, we examine the depth of the ablated craters as a function of the fluence of the pulses. The available experimental data is shown in Fig. 7. For the theory, we report the depth at which the deposited energy falls to Ex = 6 eV/atom, as in Fig. 6. The agreement between theory and experiment is quite satisfactory. The theory reproduces the very sharp rise above threshold as well as the saturation at high fluences. Conclusion. We have shown that it is feasible to calculate the interaction of intense femtosecond laser pulses with insulating media by the TDDFT, avoiding the detailed modeling of plasma formation and dynamics required in earlier theoretical treatments. The threshold for damage is accounted for by the calculated energy deposition needed to melt the quartz 11
substrate. On the other hand, the calculated threshold for ablation via a transformation to an atomic liquid is 50% higher than the low values observed in two experiments. This may suggest the significance of nonthermal mechanism in the ablation process. It may also indicate that another mechanism is responsible for the threshold behavior, such as an electric-field assisted ionic dissociation. However, we find good agreement with experiment on the depth of the ablation taking the energy deposition criterion to estimate the depth. It may well be that modeling energy deposition in wide-gap insulators could be greatly simplified once one has a suitable set of benchmark multiscale calculations based on the TDDFT.
ACKNOWLEDGMENTS
This work was supported by JSPS KAKENHI Grant Numbers 23340113, 25104702, 261511. This work used computational resources of the K computer provided by the RIKEN Advanced Institute for Computational Science through the HPCI System Reserch project (Project ID: hp140103). G.F.B. acknowledges support by the US Department of Energy under Grant No. DE-FG02-00ER41132.
1
B.N. Chichkov, C. Momma, S. Nolte, V. von Alvensleben, A. Tunnermann, Appl. Phys. A63, 109 (1996).
2
B.C. Stuart, M.D. Feit, S. Herman, A.M. Rubenchik, B.W. Shore, M.D. Perry, Phys. Rev. B53, 1749 (1996).
3
X. Liu, D. Du, G. Mourou, IEEE J. Quantum Electronics 33, 1706 (1997).
4
M. Lenzner, J. Krugeer, S. Sartania, Z. Cheng, C. Spielmann, G. Mourou, W. Kautek, F. Krausz, Phys. Rev. Lett. 80 4076 (1998).
5
M. Lenzner, F. Krausz, J. Kr¨ uger, and W. Kautek, Applied Surface Science 154 11 (2000).
6
L. Sudrie, A. Couairon, M. Franco, B. Lamouroux, B. Prade, S. Tzortzakis, A. Mysyrowicz, Phys. Rev. Lett. 89, 186601 (2002).
7
S. Amoruso, G. Ausanio, R. Bruzzese, M. Vitiello, X. Wang, Phys. Rev. B71, 033406 (2005).
8
R.R. Gattass, E. Mazur, Nature Photonics 2, 219 (2008).
12
9
B. Chimier, et al., Phys. Rev. B 84 094104 (2011).
10
O. Ut´eza, et al., Appl. Phys. A 105 131 (2011).
11
P. Balling and J. Schou, Rep. Prog. Phys. 76 036502 (2013).
12
B. Kaiser, B. Rethfeld, M. Vicanek, G. Simon, Phys. Rev. B61, 11437 (2000).
13
D. Perez, L.J. Lewis, Phys. Rev. B67, 184102 (2003).
14
C. Rethfeld, K. Sokolowski-Tinten, D. von der Linde, S.I. Anisimov, Appl. Phys. A79, 767 (2004).
15
B. Rethfeld, Phys. Rev. Lett. 92 187401 (2004).
16
J.R. Penano, P. Sprangle, B. Hafizi, W. Manheimer, A. Zigler, Phys. Rev. E72, 036412 (2005).
17
B.H. Christensen, P. Balling, Phys. Rev. B79, 155424 (2009).
18
N. Brouwer, B. Rethfeld, J. Opt. Soc. Am. B31, C28 (2014).
19
E.G. Gamaly, Phys. Rep. 508, 91 (2011).
20
L.V. Keldysh, Sov. Phys. JETP 20 1307 (1965).
21
A.-C. Tien, S. Backus, H. Kapteyn, M. Murname, G. Mourou, Phys. Rev. Lett. 82 3883 (1999).
22
Y. Shinohara, K. Yabana, Y. Kawashita, J.-I. Iwata, T. Otobe, G.F. Bertsch, Phys. Rev. B82 155110 (2010).
23
Y. Shinohara, S.A. Sato, K. Yabana, T. Otobe, J.-I. Iwata, G.F. Bertsch, J. Chem. Phys. 67, 22A527 (2012).
24
T. Otobe, M. Yamagiwa, J.-I. Iwata, K. Yabana, T. Nakatsukasa, G.F. Bertsch, Phys. Rev. B77, 165104 (2008).
25
T. Otobe, K. Yabana, and J.-I. Iwata, J. Phys. Cond. Matt. 21 064224 (2009).
26
K. Yabana, T. Sugiyama, Y. Shinohara, T. Otobe, G.F. Bertsch, Phys. Rev. B 85 045134 (2012).
27
S.A. Sato, K. Yabana, Y. Shinohara, T. Otobe, G.F. Bertsch, Phys. Rev. B 89 064304 (2014).
28
K-M Lee, C.M. Kim, S.A. Sato, T. Otobe, Y. Shinohara, K. Yabana, and T.M. Jeong, J. App. Phys. 115 053519 (2014).
29
G. Wachter, C. Lemell, J. Burgd¨ orfer, S.A. Sato, X.-M. Tong, K. Yabana, Phys. Rev. Lett. 113 087401 (2014).
30
S.D. Brorson, J.G. Fujimoto, and E.P. Ippen, Phys. Rev. Lett. 59 1962 (1987).
31
W.S. Fann, R. Storz, H.W.K. Tom, J. Bokor, Phys. Rev. B 46 13592 (1992).
32
S.A. Sato, Y. Shinohara, T. Otobe and K. Yabana, Phys. Rev. B 90, 174303 (2014).
13
33
A.D. Becke and E.R. Johnson, J. Chem Phys. 124 221101 (2006).
34
F. Tran and P. Blaha, Phys. Rev. Lett. 102, 226401 (2009).
35
L. Kleinman and D. M. Bylander, Phys. Rev. Lett. 48, 1425 (1982).
36
D.G. Hicks, et al., Phys. Rev. Lett. 97 025502 (2006).
37
P. Lorazo, L.J. Lewis, M. Meunier, Phys. Rev. Lett. 91, 225502 (2003).
38
T. Kumada, H. Akagi, R. Itakura, T. Otobe, A. Yokoyama, J. Appl. Phys. 115, 103504 (2014).
39
S. Xu, J. Qiu, T. Jia, C. Li, H. Sun, Z. Xu, Opt. Comm. 274, 163 (2007).
14