Mundiyanapurath et al. BMC Neurology (2016) 16:50 DOI 10.1186/s12883-016-0576-5
RESEARCH ARTICLE
Open Access
Time-dependent parameter of perfusion imaging as independent predictor of clinical outcome in symptomatic carotid artery stenosis Sibu Mundiyanapurath1*, Peter Arthur Ringleb1, Sascha Diatschuk2,3, Oliver Eidel2, Sina Burth2, Ralf Floca3, Markus Möhlenbruch2, Wolfgang Wick1,4, Martin Bendszus2 and Alexander Radbruch2,3
Abstract Background: Carotid artery stenosis is a frequent cause of ischemic stroke. While any degree of stenosis can cause embolic stroke, a higher degree of stenosis can also cause hemodynamic infarction. The hemodynamic effect of a stenosis can be assessed via perfusion weighted MRI (PWI). Our aim was to investigate the ability of PWI-derived parameters such as TTP (time-to-peak) and Tmax (time to the peak of the residue curve) to predict outcome in patients with unilateral acute symptomatic internal carotid artery (sICA) stenosis. Methods: Patients with unilateral acute sICA stenosis (≥50 % according to NASCET), without intracranial stenosis or occlusion, who underwent PWI, were included. Clinical characteristics, volume of restricted diffusion, volume of prolonged TTP and Tmax were retrospectively analyzed and correlated with outcome represented by the modified Rankin Scale (mRS) score at discharge. TTP and Tmax volumes were dichotomized using a ROC curve analysis. Multivariate analysis was performed to determine which PWI-parameter was an independent predictor of outcome. Results: Thirty-two patients were included. Degree of stenosis, volume of visually assessed TTP and volume of TTP ≥2 s did not distinguish patients with favorable (mRS 0–2) and unfavorable (mRS 3–6) outcome. In contrast, patients with unfavorable outcome had higher volumes of TTP ≥4 s (9.12 vs. 0.87 ml; p = 0.043), TTP ≥6 s (6.70 vs. 0.20 ml; p = 0.017), Tmax ≥4 s (25.27 vs. 0.00 ml; p = 0.043), Tmax ≥6 s (9.21 vs. 0.00 ml; p = 0.017), Tmax ≥8 s (6.86 vs. 0.00 ml; p = 0.011) and Tmax ≥10s (5.94 vs. 0.00 ml; p = 0.025) in univariate analysis. Multivariate logistic regression showed that NIHSS score on admission (Odds Ratio (OR) 0.466, confidence interval (CI) [0.224;0.971], p = 0.041), Tmax ≥8 s (OR 0.025, CI [0.001;0.898] p = 0.043) and TTP ≥6 s (OR 0.025, CI [0.001;0.898] p = 0.043) were independent predictors of clinical outcome. Conclusion: As they stood out in multivariate regression and are objective and reproducible parameters, PWI-derived volumes of Tmax ≥8 s and TTP ≥6 s might be superior to degree of stenosis and visually assessed TTP maps in predicting short term patient outcome. Future studies should assess if perfusion weighted imaging might guide the selection of patients for recanalization procedures. Keywords: Ischemic stroke, Magnetic resonance perfusion, Carotid stenosis, Tmax, TTP
* Correspondence:
[email protected] 1 Department of Neurology, University Hospital Heidelberg, Im Neuenheimer Feld 400, Heidelberg 69120, Germany Full list of author information is available at the end of the article © 2016 Mundiyanapurath et al. Open Access This article is distributed under the terms of the Creative Commons Attribution 4.0 International License (http://creativecommons.org/licenses/by/4.0/), which permits unrestricted use, distribution, and reproduction in any medium, provided you give appropriate credit to the original author(s) and the source, provide a link to the Creative Commons license, and indicate if changes were made. The Creative Commons Public Domain Dedication waiver (http://creativecommons.org/publicdomain/zero/1.0/) applies to the data made available in this article, unless otherwise stated.
Mundiyanapurath et al. BMC Neurology (2016) 16:50
Background Internal carotid artery stenosis causes about 10–15 % of ischemic strokes which remain a leading cause for disability [1]. Generally, the degree of stenosis is defined by the North American Symptomatic Carotid Endarterectomy Trial (NASCET) differentiating 10 to 90 % stenosis based on the diameter distal to the stenosis in relation to the diameter in the stenosis itself [2]. Based on current guidelines, treatment with thromboendarterectomy (TEA) or carotid artery stenting (CAS) is indicated in patients with a symptomatic stenosis of greater than 50 % [2, 3]. A hemodynamically relevant stenosis usually has a degree of at least 70 % with a decrease of the poststenotic peak systolic velocity, increased pulsatility of the prestenotic common carotid artery and a decrease of the slope to peak systolic velocity in the transcranial Doppler sonography [4]. This type of stenosis can cause, in addition to embolic strokes, hemodynamic strokes of the watershed areas [5]. The degree of hemodynamic impairment can be assessed on a capillary level using magnetic resonance perfusion weighted imaging (PWI). In contrast to the measurement of the degree of the stenosis, this method takes all compensatory mechanisms - especially collateral blood flow - into account. It is known that carotid artery stenosis changes the time to the maximum of the tissue concentration time curve (time-to-peak – TTP) in PWI [6]. However, it is not known if these changes in TTP correlate with outcome. It was rather reported that the use of TTP maps may result in an overestimation of the tissue at risk [7]. In addition, visually assessed TTP maps are still frequently used in clinical routine although TTP maps with thresholds seem to be superior [8]. An alternative PWI parameter that has been used more frequently within recent years is Tmax, which is the time to the maximum of the residual curve (obtained by deconvolution of the tissue concentration time curve) [9–11]. Even though it seems obvious that Tmax or TTP are superior to the degree of stenosis in depicting clinically relevant hypoperfusion in patients with carotid artery stenosis, it has not been demonstrated in detail yet and patients with higher degree of stenosis are commonly suspected to have higher degrees of hypoperfusion. In the current study, we analyzed TTP and Tmax maps and their ability to predict short term outcome in patients with unilateral acute symptomatic internal carotid artery (sICA) stenosis. Methods
Page 2 of 9
stenosis had to be the most likely etiology of the stroke/ transient ischemic attack, determined by an experienced vascular neurologist blinded to this analysis. Age, side of stenosis, degree of stenosis (according to NASCET), additional therapy (thrombolysis, TEA, CAS), risk factors (atrial fibrillation, peripheral artery disease, smoking, hypercholesterolemia, hypertension, diabetes), National Institute of Health Stroke Scale (NIHSS) score on admission and on discharge, modified Rankin (mRS) score on admission and on discharge were recorded. Clinical outcome was assessed at discharge by an investigator not blinded to the treatment but to this analysis by clinical examination using the mRS. Favorable outcome was defined as a score of 0 to 2 on the mRS, reflecting the ability to live independently. This definition is commonly used in stroke trials [12]. Unlike the large stroke trials, four patients with a premorbid mRS of three were included in our study. For these patients an unchanged mRS at discharge was defined as favorable outcome. One patient had a premorbid mRS of four and a mRS at discharge of five and was therefore defined to have an unfavorable outcome. Image acquisition
Images were acquired during routine clinical diagnostics using a three Tesla MR system (Magnetom Tim Trio or Verio with identical technical parameters, Siemens Healthcare, Erlangen, Germany) with a 12-channel head-matrix coil. For dynamic susceptibility contrast perfusion imaging, 0.1 mmol/kg gadolinium based contrast medium (Dotarem®, Guerbet) was administered and images were obtained with a GRE echo planar imaging (EPI) sequence: TE 35 ms, TR 1920 ms, FoV 240 × 240 mm, slice thickness 5 mm, 75 dynamic scans (0.1 mmol/kg Dotarem® 3.5 ml/s using a power injector, injection after the third frame), resulting in an acquisition time of 2:31 min. TTP maps for visual assessment were calculated using the software supplied by the manufacturer (Syngo Software, Leonardo, Siemens Medical Systems, Erlangen, Germany). DWI was performed using a single-shot spin-echo (SE) echo-planar sequence with the following parameters: echo time (TE) = 90 ms, repetition time (TR) = 5300 ms, flip angle (FA) = 90°, slice thickness = 5 mm. Diffusion sensitizing gradients were applied sequentially in the x, y, and z directions with b-values of 0 and 1200 s/mm2. ADC trace maps were created automatically using the above mentioned software, supplied by the manufacturer.
Patient selection
Patients with symptomatic (stroke or transient ischemic attack) unilateral carotid artery stenosis ≥50 % (according to NASCET) without high grade intracranial stenosis or occlusion (in Doppler sonography or angiography) who were examined with MRI including PWI were selected from the hospital database. The carotid artery
Image analysis
Analysis of visually assessed TTP was done using an open-source segmentation-software (ITK-SNAP, www. itksnap.org) [13]. All areas presenting an increase of TTP compared to the contralateral side on the maps provided by the scanner software (visually assessed TTP)
Mundiyanapurath et al. BMC Neurology (2016) 16:50
were manually delineated on all affected slides. Subsequently, the volume of all areas was calculated. In contrast, TTP maps with thresholds and Tmax maps with thresholds were calculated automatically using the Olea-Sphere® software (Olea Medical®, La Ciotat, France). Whole brain automatic detection for the arterial input function [14] and block-circulant matrix without minimization of oscillation single value decomposition deconvolution (cSVD, truncation threshold 0.1) were used. No model fitting for smoothing was applied. Motion correction was achieved using an algorithm with pairwise inplane rigid co-registration of all raw images of a given slice with a well-chosen reference image over time. It is based on minimizing a robust and computationally friendly distance between this reference image and the target image. In order to avoid local minima, a quick, coarse grain registration algorithm based on geometric information is used to initialize the fine grain minimization algorithm. Normal white matter from the unaffected middle cerebral artery territory (the M5 area from the Alberta Stroke Program Early CT Score) contralateral to the stenosis was chosen for normalization of the TTP values derived from OleaSphere manually using ITK-SNAP. This allowed pooling of patient data [15]. Normalization is not required for Tmax values. The maps were grouped by values and the respective volumes were computed using in-house software created with MATLAB (MathWorks®, Natick, MA, USA) by one of the authors (SD). For TTP, the groups were: ≥2, ≥4 and ≥6 s. For Tmax, the groups were: ≥4, ≥6, ≥8 and ≥10 s. We chose to include the visual assessment of TTP maps and the automated approach because the visual assessment used to be the standard procedure in daily patient care at our hospital at the time the study was conducted and we were eager to know whether there were substantial differences to the maps calculated by a perfusion software. All images were manually checked and corrected for artifacts using ITK-SNAP. As no brain extraction software was used, artifacts in ventricles and larger subarachnoid spaces had to be removed manually. It is not possible to identify structures as the ventricles precisely on TTP and Tmax maps. Therefore, PWI images were aligned with T2-images to facilitate artifact detection using an FSL-based algorithm (FLIRT, linear rigid registration using normalized mutual information with 6° of freedom). DWI lesions were segmented automatically using a previously published algorithm [16]. Image reading was done blinded to outcome parameters. Doppler sonography
The degree of the stenosis was determined by routine continuous-wave Doppler sonography using a 4 MHz extracranial Doppler probe (SONARA system, medilab®, Estenfeld, Germany) and a linear 5–10 Mhz duplex probe with color Doppler-assisted imaging according to the
Page 3 of 9
NASCET criteria based on criteria defined by the German Society of Sonography in Medicine (DEGUM) [4]. Transcranial Doppler sonography (TCD) was performed in routine clinical workup with a 2 Mhz pulsewave probe using the SONARA system. The frequencies used in the study were collected by probing the middle cerebral artery at 50 mm depth. The extent of flow distraction – reduced acceleration time – in the middle cerebral artery (MCA) was assessed based on acoustic impression compared to the normal contralateral side. Ultrasound was performed by a neurologist or a technician with extensive experience. Statistical analysis
Statistical analysis was conducted using Microsoft Excel® Version 2010 and IBM SPSS® Version 21. Correlation analysis was carried out using Pearson correlation coefficient. ROC-curve analysis was performed including thresholds in case of positive classification and assuming a non-parametric distribution of the area under the curve. The cut-off volume for TTP and Tmax for the multivariate analysis was chosen from the ROC-curve, being the closest point to the upper left corner. Pretesting for normal distribution was not performed, as a two stage procedure with preliminary testing for normal distribution causes an increase of the conditional type 1 error rate [17]. Hence, univariate analysis was performed using Mann-Whitney-U and Chi-square/Fisher exact test depending on the level of measurement and the size of the tested groups. An α-Level of 0.05 was chosen. Multivariate analysis was done applying likelihood-ratio test based forward selection within binary logistic regression models where variables were included if the related p-value was above 0.05 and removed if the related pvalue was above 0.10. Two-sided p-values are reported throughout.
Results Thirty-two patients were eligible for analysis. All patients suffered from acute sICA stenosis (ischemic stroke or transient ischemic attack) and were treated on our stroke unit. The patients had the following degrees of stenosis: 90 % (n = 9), 80 % (n = 9), 70 % (n = 8), 60 % (n = 1), 50 % (n = 5). None of the patients died and 23 had a favorable outcome. The median length of stay in hospital was 6.5 days (interquartile range (IQR): 4.3;8.8). Among patients with high grade stenosis and large prolonged visually assessed TTP volume, some had a small pathological perfusion volume on Tmax maps, only a slight prolongation of the TTP in the TTP maps with thresholds (≥2 s) and favorable outcome (Fig. 1). On the other hand, some of these patients had a large pathological perfusion volume with higher values of TTP/Tmax and unfavorable outcome (Fig. 2). Additional middle cerebral artery
Mundiyanapurath et al. BMC Neurology (2016) 16:50
Page 4 of 9
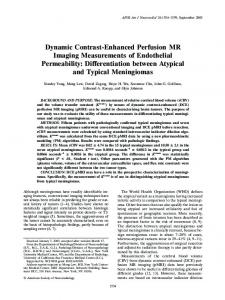
Fig. 1 Patient with 90 % carotid artery stenosis and favorable outcome. a Large prolonged TTP volume on TTP-map provided by scanner software without thresholding. b Slight prolongation of TTP volume on TTP-map calculated by Olea-Sphere®. Maps were visualized on fluid attenuated weighted images (FLAIR). c DWI provided by scanner software showing no restrictions. d Small prolonged Tmax volume calculated by Olea-Sphere®
stenosis or occlusion was ruled out by CT angiography for this patient (Additional file 1: Figure S1). We therefore investigated whether and at what threshold pathological TTP and Tmax volume can predict outcome using a ROC analysis. The visually assessed TTP volume and the volume with a TTP ≥2 s failed to differentiate between favorable and unfavorable outcome (AUC = 0.560; p = 0.600 and AUC = 0.686; p = 0.107, respectively). All other PWI-derived parameters were significantly different in patients with favorable and unfavorable outcome in the ROC-analysis (Additional file 2: Table S1) and in univariate analysis that included other clinical parameters (age, side and degree of stenosis, risk factors, treatment, time from symptom onset to MRI, NIHSS score, mRS score and TCD parameters) as well (Table. 1). For additional multivariate analysis, a threshold for Tmax and TTP maps was chosen from the ROC curve, which resulted in a sensitivity of 0.778 for all parameters (Additional file 2: Table S1). The Tmax and TTP parameter with the highest
area under the curve (Tmax ≥8 s and TTP ≥6 s) were used in multivariate logistic regression analysis that included all significant (p 0.94 ml, odds ratio 0.026; 95 % confidence interval [0.001;0.925]; p = 0.045) and TTP ≥6 s (threshold 1.42 ml, odds ratio 0.026; 95 % confidence interval [0.001;0.925]; p = 0.045) were independent predictors of outcome even though NIHSS score on admission and DWI lesion volume were included (Table 2). We also investigated the effect of the volume of hypoperfused tissue on another outcome parameter, NIHSS score at discharge. All perfusion parameters showed significant correlations with the NIHSS score at discharge. However, the volume of visually assessed TTP (correlation coefficient (r) = 0.36, p = 0.041) showed a markedly lower
Mundiyanapurath et al. BMC Neurology (2016) 16:50
Page 5 of 9
Fig. 2 Patient with 90 % carotid artery stenosis and unfavorable outcome. a Large prolonged TTP volume on TTP-map provided by scanner software without thresholding. b Large TTP volume with markedly prolonged TTP on TTP-map calculated by Olea-Sphere®. c DWI provided by scanner software showing multiple areas with restricted diffusion. High grade intracranial stenosis or occlusion was excluded in angiography. d Large prolonged Tmax volume calculated by Olea-Sphere®
and less significant correlation compared to TTP ≥2 s (r = 0.62, p