Time-Frequency Modeling and Detection of random non-stationary signals for Monitoring Purposes Julien HUILLERY∗ and Nadine MARTIN† Signal and Image Laboratory (LIS), 38402 St Martin d’Heres, France
This paper deals with the modelization and detection of non-stationary random signals in the time-frequency space. A time-frequency random model of signal is derived from a given temporal model. The time model we are interested in consists in a deterministic signal embedded in an additive centered Gaussian perturbation. This Gaussian model is characterized by two parameters, which are the mean and covariance matrix of the process. The corresponding time-frequency model depends on the time-frequency transform applied to the signal. For the spectrogram, the determinant parameters are the nature and length of the analysis window and the zero-padding. We show that for a Gaussian signal, spectrogram coefficients distribution can be approximated by a chi2 law defined by three parameters. A time-frequency signal detection task inspired from a Neyman-Pearson strategy is performed on the basis of this probabilistic time-frequency model. The detector determines the time-frequency regions where signal energy is present. It thus provides a time-frequency signature of the signal. This information is used for structural health monitoring techniques. Extraction of the fundamental meshing frequency and harmonics of a gearbox under varying load conditions is presented.
I.
Introduction
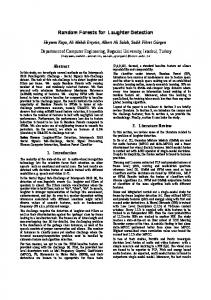
he study presented in this paper relates to structural health monitoring through the analysis of signals. T As monitoring is linked with the observation of the behaviour of a system, it reveals an intrinsically nonstationary context. Time-Frequency (TF) research aims at the development of new analysis tools dedicated to non-stationary signals. These tools have proved great efficiency for signal analysis as they allow the observation of the evolution along time of the signal frequency structure. A large amount of work has been done in the field of analysis of random signals, based on time series and/or spectral analysis where effective tools constructed on a theoretical framework have been developed for detection, estimation and classification. An essential aspect of probabilistic approaches for signal analysis is the choice of the structure and nature of the model used to represent the randomness of the signal. This modelization always concerns the time representation of the signal. The first aim of this paper is to present how a time random model can be transplanted into the time-frequency domain. Similarly to the time domain, this probabilistic time-frequency model can be used as a framework for a time-frequency signal detection task. Time-frequency detection extract the time-frequency locations where a signal is present. It reveals useful for the determination of the signal temporal locations but also provides deeper information about the spectral structure of the signal and how this structure evolves. In this paper we present a procedure, based upon a Neyman-Pearson framework, that localizes the regions of the timefrequency plan where signal energy is present. Structural health monitoring task based upon this analysis of the signal is performed as described in figure 1. We investigate vibration monitoring of a rotative machinery under fluctuating load conditions. Different loads imposed to an induction motor cause the rotative speed to fluctuate. Our aim is to recover the law of the load by extracting the fundamental meshing frequency of the system. The time-frequency detection procedure is used for this purpose. ∗ Phd
student, LIS,
[email protected] Director CNRS, LIS,
[email protected]
† Research
1 of 6 American Institute of Aeronautics and Astronautics
Figure 1. Overview of the method
This paper is organised as follow: the first section describes the time-frequency model of signal and the second section presents the algorithm used to detect the signal time-frequency patterns. The third part focuses on the use of the time-frequency signal detection algorithm for load variations monitoring purpose.
II.
Time-frequency modeling
The time random model of signal we are interested in is composed of a deterministic part d(t) and an additive random part r(t), namely (1)
x(t) = d(t) + r(t).
The deterministic part represents the support of the information under interest while the random part stands for the receiver environment. The non-stationarities originate from the deterministic process. The structure of this model allows the development of signal processing methods without prior hypotheses upon the nature or structure of the information contained in the signal. The only a priori information is the random nature of the additive perturbation process r(t). It namely consists in its law of probability that can be represented by its probability density function or equivalent. The results are here presented for a centered Gaussian process with covariance matrix R associated to the autocorrelation function Γ(τ ). As a consequence, each sample x(t) of the signal is distributed as a Gaussian variable with mean d(t) and autocorrelation function Γ(τ ) x(t) ∼ N (d(t), Γ(τ )) .
(2)
Once the time modelization task of the phenomenon under investigation has been performed, the next step consists in determining the corresponding random model in the time-frequency domain. Many time-frequency representations of signals have been proposed yielding to the need of a classification.1 One first distinction separates representations associated with linear or quadratic transformation of the signal. Short-Time Fourier Transform and Wavelet Transform are members of the linear group. The advantage of the quadratic group is to offer the possibility of an interpretation of time-frequency representations as physical quantities like energy. The class of Cohen gathers some of the quadratic transforms. One key aspect regarding the choice of a quadratic transform is the balance between energy concentration and presence of interference terms. The Wigner-Ville distribution (presence of interferences, high energy concentration) and the spectrogram (no interferences, poor energy concentration) correspond to the farthest transforms. To each time-frequency representation of the signal will correspond a specific time-frequency random model. The law of probability of the time-frequency coefficients will depend on the transformation applied to the signal. In this study, results are presented for the case of spectrogram. Given a discrete analysis window w[n] of length M , the Short-Time Fourier Transform Xw [n, k] of a discrete signal x[n] is formed by the successive Discrete Fourier Transforms of the windowed signal. The spectrogram Sxw [n, k] corresponds to the squared modulus of the STFT or equivalently to the sum of the squares of the STFT real and imaginary parts, Xwr [n, k] and Xwi [n, k] respectively. We thus start from the following definitions: Sxw [n, k] = Xwr [n, k]2 + Xwi [n, k]2 ,
Xwr [n, k]
=
M −1 X
x[n − m]w[m] cos(−2πk
m=0
(3) m ), N
2 of 6 American Institute of Aeronautics and Astronautics
(4)
Xwi [n, k]
=
M −1 X
x[n − m]w[m] sin(−2πk
m=0
m ). N
(5)
where N is the length of the computed FFT and N − M corresponds to the zero-padding. The law of the random variable Sxw [n, k] is thus determined by the probabilistic behaviour of the squared modulus of the vector X[n, k] defined by X[n, k]T = [Xwr [n, k] Xwi [n, k]].
(6)
Equations (4) and (5) express the real and imaginary parts of the STFT as linear combinations of signal samples. As x[n] are Gaussian variables (not necessarily independent), Xwr [n, k] and Xwi [n, k] are also distributed as Gaussian laws. X[n, k] is thus a Gaussian vector defined by five parameters m1 , m2 , Σ11 , Σ22 and Σ12 (for clarity of notation we drop the time-frequency location [n, k] in the probability parameter notations): ( ! !) ! m1 Σ11 Σ12 Xwr [n, k] ∼N , . (7) X[n, k] = m2 Σ12 Σ22 Xwi [n, k] From equations (1),(4) and (5), we obtain r m1 = Dw = Re(ST F T {d(t)}) i m2 = Dw = Im(ST F T {d(t)})
(8) (9)
and Σ11 = W T Ck RCk W Σ22 = W T Sk RSk W Σ12 = W T Ck RSk W
(10) (11) (12)
where W T = [w[0] · · · w[M − 1]] is the analysis window vector and Ck (resp. Sk ) is the cosine (resp. sine) diagonal matrix, h m i Ck = diag cos(−2πk ) N m=0,M −1 h m i Sk = diag sin(−2πk ) N m=0,M −1 Spectrogram coefficients are thus distributed as the squared modulus of the Gaussian vector X. This law of probability is determined through the five parameters m1 , m2 , Σ11 , Σ22 and Σ12 . This distribution can be approximated2 with a chi2 distribution with three parameters χ2 (α, δ, θ). The coefficients of proportionality α, the degree of freedom δ and the uncentrality parameter θ are then defined as 2
δ=
(Σ11 + Σ22 ) , 2 Σ11 + Σ222 + 2Σ212
(13)
Σ11 + Σ22 , δ
(14)
m21 + m22 Sw = d , α α
(15)
α=
θ=
where Sdw is the spectrogram of the deterministic part d(t) alone. One advantage of this time-frequency random model is the direct link between the transform that is used and the resulting distribution. Parameters of the time-frequency transformation being known, the parameters of the time-frequency model are defined by the time-frequency distribution Dw [n, k] of the deterministic part and the variance-covariance matrix R of the additive random process. 3 of 6 American Institute of Aeronautics and Astronautics
III.
Time-frequency signal detection
We use the results presented in the previous section to develop an algorithm that automatically detect and isolate time-frequency components of the determinist part of our model. In this work, a time-frequency component of a signal is defined as a region of the time-frequency plane where signal energy is present. Furthermore, the additive random process r(t) is assumed to be white with an unkown spectral power σ 2 . We can thus write R = σ 2 IN . For this simple case, the three parameters (α,δ,θ) of the χ2 law (equations 13, 14 and 15) reduce to 1 , 2β 2 − 2β + 1
(16)
σ2 , δ
(17)
m21 + m22 Sw = d , α α
(18)
δ=
α=
θ=
where β is a function of the analysis window w[n] and the frequency k defined by M −1 n 1 1 X w[n]2 cos(4πk ). β= + ∗ 2 2 n=0 N
Note that for most frequencies k, β equals
1 2
(19)
and the χ2 law has two degrees of freedom (δ = 2).3
At each time-frequency location [n, k], the detection scheme can be formulated as a two hypothesis test problem. The null hypothesis H0 corresponds to the presence of the random additive process r(t) only, and the signal hypothese H1 is valid if the deterministic part d(t) provides energy at the considered location. That is: ( H0 : Sxw [n, k] = Srw [n, k], w [n, k]. H1 : Sxw [n, k] = Sr+d From section II and above, the distribution of Sxw [n, k] under H0 is a central (θ = 0) χ2 law for every time-frequency location [n, k]. The proportionality coefficient α is equal to σ 2 /δ where the degree of freedom δ and the spectral power σ 2 remains to be estimated. Under H1 , spectrogram coefficients are distributed as a non-central χ2 variable. As for this case the non-centrality parameter θ is fluctuating over the timefrequency plane, a Neyman-Pearson strategy seems preferable for the detection task: a given fixed False Alarm Probability (PFA) determines the detection threshold on the probability distribution under H0 . The general principle of the algorithm4 is to iteratively select higher energy connected time-frequency coefficients until the distribution of the remaining region matches a possible H0 distribution. Doing so the algorithm iteratively estimates the unknown parameter σ 2 of the random process. The time-frequency detection procedure is now described: In the time frequency plane, candidates to the signal class H1 are selected through the use of a PFA on the probability distribution of the noise class H0 . For this purpose, parameters α and δ (proportionality coefficient and degree of freedom respectively) of the central χ2 law are estimated5 by maximising the likelihood with the data contained in the noise class H0 . A threshold is determined on this probability distribution according to the initialy given PFA. TF coefficients Sxw [n, k] superior to this threshold are selected as candidates for the signal class H1 . The signal class regions then grow by clustering candidates connected in the time-frequency plane. A candidate for the signal class is assigned to the class H1 if it is contiguous to a member of the class H1 . The time-frequency region growing stops when the number of candidates falls under a threshold determined with the initial number of candidates and the PFA. 4 of 6 American Institute of Aeronautics and Astronautics
After each grow, the likelihood of the remaining noise class distribution with a central χ2 distribution is evaluated. The procedure repeats iteratively until the convergence of the likelihood stops its evolution. In fine, the limit between the noise and signal regions is determined according to the time-frequency model. The spectral power σ 2 of the additive random process is estimated. The time-frequency space is segmented into regions corresponding to the deterministic signal components and may be interpreted as a time-frequency signature.
IV.
Load variations monitoring
We used the time-frequency detection procedure described in section III for the analysis of vibration signals from rotative machinery. The aim of the experiment is the monitoring of a fluctuating load applied to the motor. Excess load may then be detected so as to prevent mechanical failure or motor break down. The experiment has been carried out using data from the benchmark ”GOTIX” (see figure 2) of the Signal and Image Laboratory, Grenoble, France. This benchmark is composed of a 55kW asynchronous motor, a gearbox with a multiplicative ratio of 57/15, a speed variable controller and a DC motor that allows the simulation of variable loads. Signals are acquired from various voltage/current sensors and accelerometers placed at different locations. We used the vibration signal recorded on the motor shaft. During acquisition, the load represented by the DC motor was continuously modified.
(a) global view
(b) detail of the gearbox
Figure 2. The benchmark ”GOTIX” from the Signal and Image Laboratory (LIS)
Vibration signals from rotative machinery display a harmonic structure (see figure 3-a)). The fundamental frequency corresponds to the rotation speed of the motor. Variation of the load imposed to the rotative machinery results in inversely proportional variation of the rotation speed. As a consequence, extraction of the fundamental meshing frequency of the vibration signal allows to recover the load conditions the system has been subject to. Unfortunately, the fundamental frequency of vibration signals may have less energy than some of its harmonics and suffer from amplitude variations. Furthermore, a load variation ∆L generates a frequency variation of K∆L on the fundamental frequency and n ∗ K∆L on the nth harmonic. As the frequency resolution of a time-frequency analysis is constant over the whole frequency range, resolution on the load variation is gained when looking at high harmonics. In the case under interest, the 7th harmonic reveals the more energetic and of relatively stable amplitude (figure 3-b)). We thus restrict the analysis to the frequency band [5200Hz; 6100Hz]. Some knowledge about the behaviour of the investigated rotative machinery and sensors may help to determine this spectral region of interest as it remained the same for all the experiments we conducted. Figure 3-c) depicts the time-frequency signal detection result from which the load variations are extracted (figure 3-d)) by use of the motor torque/rotation speed characteristic. We recover the load variations manually obtained during the experiment.
5 of 6 American Institute of Aeronautics and Astronautics
(b) zoom on the 7th harmonic
(a) spectrogram of the gear signal
(c) Time-frequency detection result
(d) fundamental meshing frequency variations (left y-axis) and corresponding load conditions (rigth y-axis)
Figure 3. Time-frequency signal detection and load variations monitoring
V.
Conclusion
More than extract the temporal location of a signal, time-frequency signal detection provides information about the spectral structure of a signal and the way it evolves. In this study, a time-frequency detection procedure is presented. This procedure is based on a time-frequency probabilistic model constructed on a given Gaussian temporal model and taking into account the characteristics of the time-frequency transform used for the analysis. Monitoring of the load imposed to a rotative machinery is presented and show the applicability of the method.
References 1 Cohen,
L., “Time-Frequency Distribution - A Review,” Proceedings of the IEEE , Vol. 77, No. 7, July 1989, pp. 941–981. J., Millioz, F., and Martin, N., “On the Probability Distributions of Spectrogram coefficients for Correlated Gaussian Process,” In proceedings of the ICASSP’06, Toulouse, France, May 2006. 3 Millioz, F., Huillery, J., and Martin, N., “Short-Time Fourrier Transform Probability Distribution for Time-Frequency Segmentation,” In proceedings of the ICASSP’06, Toulouse, France, May 2006. 4 Hory, C., Martin, N., and Chehikian, A., “Spectrogram Segmentation by means of Statistical Features for Non-stationary Signal Interpretation,” IEEE Trans. on Signal Processing, Vol. 50, No. 12, December 2002, pp. 2915–2925. 5 Hory, C. and Martin, N., “Maximum likelihood noise estimation for spectrogram segmentation control,” In Proceedings of the ICASSP’02, Orlando, USA, 2002, pp. 1581–1584. 2 Huillery,
6 of 6 American Institute of Aeronautics and Astronautics