Timeline Visualization for Documenting Process Model Change Sonja Kabicher-Fuchs1 , Simone Kriglstein2 , and Kathrin Figl3 1
University of Vienna, Austria Faculty of Computer Science, Workflow Systems and Technology Group
[email protected] 2 SBA Research, Vienna, Austria∗
[email protected] 3 Vienna University of Economics and Business, Austria
[email protected]
Abstract: Organizations need to deal with change in order to remain competitive in a dynamic, global business world. When business processes need to be redesigned, it often remains unclear why a process evolved to its current form. Against this background, process change documentations can be helpful in order to illustrate and capture change information. The main purpose of this paper is to expand our understanding on how to visualize process change information and to explore the concept of timeline visualization for this application area. Using an expert inspection approach, we first identify shortcomings of existing timeline tools in meeting visualization requirements of business process change. We propose a conceptual design for change visualization using timelines that aims to support a contextual, temporal and comprehensive documentation of business process model changes.
1
Introduction
One major incentive of organizations to document processes and to record process change is to conform to internal or external requirements, such as the ISO 9000 standards and guidelines. The documentation of change may refer to various attributes of change, for example, the reasons for change, planned changes, and actual changes performed. Time is as well a representative attribute of change which specifies e.g., the point of time and time period change is planned, actually performed, applied, and the number of changes within a specific time span. As the predominant purpose of timelines is to visualize historical, current and future actions and events, and simultaneously support the representation of complementary information, e.g. in different views, we chose timelines as visualization method for process model change documentation. To provide an explanation why timelines are especially suitable to visualize the timely change of processes we can draw on research in cognitive psychology. For instance, [HDL68] demonstrated that people ∗ funded
by COMET K1, FFG - Austrian Research Promotion Agency.
rely on internal spatial representations (mental models) when they solve logic problems in reasoning, even when those problems are nonspatial and abstract. Literature reveals that for the two relation pairs relevant for the context of process change: earlier-later and cause-effect there is a clear preference to assign earlier-later to left-to-right followed by top-to-bottom and to assign cause-effect to top-to-bottom and left-to-right. This natural association between left-to-right and time is also reflected in the fact that temporal relations are usually expressed from left-to-right on the horizontal axis in graphs [TKW91]. Based on these observations, we applied timelines as visualization method to support documentation of changes in process models. In this paper we investigate timelines for process model version management. Our research was guided by the following questions: (1) Which attributes of change may be helpful for understanding changes and required for documenting process change? (2) Can timelines help to document and visualize change of process models in a structured and interactive way? We evaluated selected timeline tools according to change visualization requirements in business processes by means of expert inspection. Based on the gained insights of the inspection sessions, we developed a visualization concept in order to offer: (a) the documentation of process model evolution and detailed temporally related information about change, (b) an understanding of the change in a bigger context (possible triggers/events for change as well as temporal relationships between triggers and actions), and (c) detailed information about the change per se that is loosely coupled with the time attribute of change (e.g., what was changed and who performed the change).
2
Changes of Business Process Models
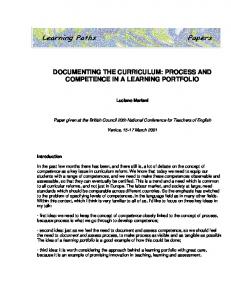
In this section we focus on change in the context of business process models and discuss change attributes (illustrated in Figure 1) valuable for documentation in detail. Process models. As a process model can be changed several times during its lifecycle, several versions of the process model can exist. Business process models consist of a set of activities with execution constraints between them and they are performed to achieve business goals. A business process model is a blueprint for a set of business process instances, which represent concrete cases of the process [Wes07, p.7]. After changing actions are taken, the resulting process model represents the desired adjusted process schema. There exist different approaches for version control in business process change management. For example, repositories can be used to support an incremental numbering system for process model versions (see e.g., [IBM05]). A further approach is to illustrate evolvement along the two axes process improvement and temporary adaptation (represented by a three-digit string x.y.z where x denotes the major version, y denotes the minor version and z denotes the temporary variation). Another approach it to present versions as directed graphs (see e.g., [ZL07]), or as version trees (see e.g., [KG99]). Other tools, such as process mashups like Gravity [DKN+ 10]) support the logging of conducted model changes. For the process model timeline concept presented in this paper we use the following graphs (as discussed in our previous work [KKRM11]: the initial graph A which illustrates the first or the current version of the process, the adjusted graph A’ which illustrates the subsequent version
Change attributes
Process models Actions
Action planned
Evaluation
Action taken
Change tracking graph
Description
Artifact
Examples
Change is performed on process models. The result are versions of process models. Change actions describe (a) what has to be changed and (b) what was changed.
Initial process models Changed process models
Process model A version 1 Process model A version 2
parallelize (S,B,C,D) = Parallel work is possible. Tasks need not to wait for Evaluation of planned change actions before Evaluation results of planned data from other tasks. Analyse results show a xy% change actions are performed. change actions decrease of process duration. parallelize (S,B,C,D) = model. change actions Planned change actions before change is actually performed.
Documentation of planned change actions
The change tracking graph contains the graph elements of the initial graph that are affected and not affected by the change.
Change tracking graph
Change tracking graph A*_(v1-v2) 21st Jan 2010 - 23rd Sept 2010 Legislation amendment, XY Act § 10 xy% time saving Internal: Department for XY Persons: Max Mustermann, Rainer Zufall The questionaire and reflection meetings served as "sensing tools" for... The initial process model A seemed to be modeled in a too complex way. A remodeling may support understandability... The XY analysis of the actions planned was particularly suitable for …
Time
Date or time frame of the change.
Trigger
Reasons for change.
Documentation of the date Documentation of change triggers
Change actor
Person(s) who perform the change.
List of change actors, teams
Lessons learned
Change experiences and assessment results Documentation of lessons of the implemented changes. learned
Figure 1: Attributes of process model change.
of the process (a process model may have several versions during its lifecycle), and the change tracking graph A* which is discussed in more detail in the paragraph Actions. Actions. Another attribute are change actions (or change instructions) which describe (a) what has to be changed (action planning, e.g. documented in a change notice by means of change patterns or primitives [WRRM08]) and (b) what change has been performed (action taking, e.g., documented in a change record by means of a table or graph). Before change actions are performed, they need to be planned, evaluated, and documented. Change of business process models can range from evolutionary-, and ad-hoc change, right up to business process redesign. Evolutionary change is often the result of reengineering efforts [vdAB02, p.2] and concerns the structural change of the process. The new version of the process model is relevant for all (new) process instances. Ad-hoc change becomes necessary when dealing with real-world exceptions (e.g. errors, rare events or special demands) and usually concerns single cases – process instances [WMC99] – or case groups [vdAB02, RRD03, RRD04]. The challenge of business process redesign is to come up with a new process design [MR05], e.g. from scratch or based on the radical improvement of current processes. In this work we focus on evolutionary change by considering process model versions. We understand change as a predefined set of changes (e.g. expressed by means of change patterns [WRRM08]) conducted to an already existing graph during a specific time frame. We use the change tracking graph A* to visualize and document change actions conducted on the initial or current graph A in order to receive further process versions. The change tracking graph A* contains, as presented in our previous work
[KKRM11], the graph elements of the initial graph A that are not affected by the change, deleted, and added during change. We provide a set-based definition of the change tracking graph A* in order to explain the content of the graph. Change Tracking Graph (CTG). Let P be the set of process graphs and A, A’, A* ∈ P. A=(N,E) is a directed graph with N defining the set of nodes, and E defines the set of edges, E j N × N . Let A’=(N’,E’) be the adjusted graph after changing the initial graph A. σ is a predefined sequence of change patterns to be performed on the initial graph A. A [ σi A’. We denote A* := (N*,E*) as change tracking graph where: - N* = N ∪ Nadd = (N ∩ N 0 ) ∪ (Nadd ∪ Ndel ), - E* = E ∪ Eadd = (E ∩ E 0 ) ∪ (Eadd ∪ Edel ), - Nadd = N 0 \ N , Ndel = N \ N 0 , Eadd = E 0 \ E, Edel = E \ E 0 . In [KKRM11] we had further introduced three possible change tracking states of graph elements. Graph elements that are inserted are signed as activated elements, deleted elements are denoted as deactivated elements, and graph elements that are not affected by the change are marked as initial elements. Change Tracking States. Let the assumptions be as in Definition 1. Let T be a set of possible change tracking states with T:={deactivated, activated, initial}, and t ∈ T. For A*=(N*,E*) we define a function track that assigns the corresponding change tracking state to each node and edge. track: (N* ∪E*) → T deactivated, if x ∈ Ndel ∪ Edel , track(x) := activated, if x ∈ Nadd ∪ Eadd , initial, else (x ∈ (N ∩ N’) ∪ (E ∩ E’)). Change primitives. We could compute A, A’, A* based on the set-based definition as presented above. However, as change is typically applied in an incremental manner, and we do actually know the change, we opt for determining the change tracking graphs by exploiting the changes. The basic requirement for this approach is that we can express all kinds of change patterns by means of the following change primitives [RRJK06]: ’delete node’ (removing one node), ’delete edge’ (removing one edge), ’insert node’ (adding one node) and ’insert edge’ (adding one edge). The following rules for calculating change tracking graphs hold: - track(x) = initial [DELETE (x)i track (x) = deactivated - track(x) = [INSERT (x)i track (x) = activated for x ∈ N’ ∪ E’, ∀ x ∈ N ∪ E: track (x) Using insert and delete allows to mark the change with particular visual properties without challenging the graph user with an exaggerated number of new visual appearances of the graph elements. All relevant change patterns as presented in [WRRM08] can be separated into these four change primitives. The graph elements are marked according to their change tracking state with the selected visual properties color, brightness, or size.
Visual Properties in CTG. Let Z be a set of possible visual properties for change, with Z := {Color, Size, Brightness} and z ∈ Z. For A*=(N*,E*) we define a function visualizec which assigns for each node and edge the corresponding visual property z ∈ Z. visualizec : (N ∗ ∪(E ∗ ) → (Color ∪ Size ∪ Brightness) C1, if track(x) = deactivated, visualizec (x) := C2, if track(x) = activated. and C1 ∈ Color =⇒ C2 ∈ Color (holds for Size Brightness resp.) The change tracking graph is used in our design approach to document and highlight the changes implemented in the process model. The graph can be illustrated in two different layouts [KKRM11]. One layout highlights the past by preserving the layout of the initial graph A (mental map). The other layout reflects the future by adopting the layout of the adjusted process model, graph A’, which is designed according to particular aesthetic criteria. Both layouts of the change tracking graph were considered in our approach. Time. Time is an attribute of change that specifies the date or the time frame in which the change is performed. The time period of the different process model versions should be clearly represented. Time is also relevant to understand relationships between internal or external events (in the organizations’s internal and external environment) as well as planned and implemented change actions. Trigger. Triggers (or reasons) for change range from external factors – e.g., economic, legal, and technological developments – to more specific internal factors such as design errors, missing data sets and technical problems of workflow management systems used [vdAJ00]. Triggers may also refer to specific customer demands or rare events [vdAJ00]. In this work we consider triggers for evolutionary changes of process models. Change actor. The person(s) who performed the change should be clearly represented and may include, for example, modelers and business process redesign teams. Lessons learned. The assessment of the outcome (implemented changes) and the documentation of generated knowledge based on the change experience should as well be considered as a valuable attribute of change.
3
Methodology
Three different timelines were prepared for exemplary process models to represent the models’ evolution along a time axis. The timelines were created by using three different timeline tools OfficeTimeline20101 , TimelineStudio2 and TimelineMaker3 . It was decided that the best method to adopt for analyzing the timelines was expert inspection. Inspection is one of the usability methods that aim to find usability problems in a design [Nie94, RC08, Wil09]. The inspection was guided by the visualization requirements for process change which are presented in Section 4 and was performed by three inspectors 1 http://www.officetimeline.com/
trial version 3 http://www.timelinemaker.com, trial version 2 http://www.timelinestudio.co.uk,
individually. The inspection results were discussed during a consensus meeting. Based on findings of the inspection sessions and the attributes of process model change, the visualization concept for a timeline was developed that particularly focused on the support of process model change documentations. During the design phase, the mock-up was evaluated by means of walkthrough [Nie94, RC08] in order to discuss each change requirement and to identify problems with the design early in the process.
4
Change Visualization Requirements for Business Processes
For the comparison of the timeline tools (see Section 5) and for the design of our approach (see Section 6) we adapt the process change visualization requirements described in previous work [KRM12]: Clear change representation, Visibility of Relationships between Versions, Different Views and Interaction. The requirements arose from a systematic literature review about characteristics of changes and visualization approaches in combination with a user survey in order to identify user’s experiences and expectations with regard to change visualizations [KRM12]. The presented requirements primarily describe what a visualization should provide to present change information and can be used as measurable benchmarks for the evaluation of visualization approaches. To make the different timeline tools clearly comparable for our inspections, the following criteria are specified for each requirement. Clear Change Representation. Timelines should consider all recorded changes of the process model in order to get a fast overview what was changed in the process model and which change actions (e.g., if a task is deleted or added in the process model) were performed. Sources as a description of process model or a link to the original files of the process models can be helpful to understand the logic behind the process models and possible effects and consequences. Furthermore, timelines should support an easy access to additional change attributes (e.g., actors who performed the changes, change triggers and lessons learned). Visibility of Relationships between Versions. It is necessary to consider when changes were performed and how changes are related to each other in order to make versions more comprehensible and comparable in process models. The representation of versions with the help of timelines allows users to see the interconnections of versions along the time axis. However, it is often useful to represent the information not only as a timeline but also in textual form in order to make the graphical representation easier to understand or to present detail information [FS97, Kri11]. Different Views. The representation of timelines in combination with their process models and change information in a single view reduces the legibility and level of detail. Therefore it is necessary to consider strategies in order to deal with large quantities of information. Using multiple views is a possibility to simplify the design in such a way that different information is split into different views (see e.g., [GRF08, Kri11, Nor05]). The representation of timelines and their information in multiple views allows to analyze the change information from different perspectives and to compare complementary or con-
trasting information. For example, one view can present the timeline in combination with the change actions as milestones while another view can directly highlight the change actions in the process model. Overview and detail is a strategy that uses multiple views to provide an overview about the datasets and presents the corresponding detailed information when a user selects a data item from the overview [CMS99, Kri11, Nor05]. Overview and detail view are linked together and allow users a fast access to detailed information [CMS99, Kri11]. For example, if a user clicks on a specific part in the timeline, the detail information of the selected segment (e.g., change actions and who made the changes) is shown. Interaction. Because of limited screen space, it is necessary to find strategies which support users to interact with the visualization in order to select the data items that should be presented. Brushing and linking is a strategy to interact with datasets in multiple views [Kri11, Nor05]. For example, if a user selects a data item in one view (brushing), this data item is then also selected in other views (linking) [Kri11, Nor01]. Filtering and searching allows users to find particular information depending on specific conditions or ranges in order to highlight specific information of interest [Kri11, YKSJ07]. For example, change information (such as change actions, change owner, and time span) can be filtered out. Scrolling and panning are further interaction strategies for navigating through the visualized information in case the screen is too small to present the whole information at once [Kri11, Spe07]. Zooming is the ability to zoom in and out within a viewport in order to magnify or minimize a particular area of the screen more closely (e.g., to resize documents or images). Content zooming is an effective strategy in order to jump from the overview to the detail information and vice versa. For visualization of timelines, content zoom can be used to change the scale of the time axis in order to switch between year, month, week, and day representation.
5
Timelines
We explore three widely used tools for timeline visualization, which are online available for free or as a trial version: Office Timeline, Timeline Studio and Timeline Maker. Office Timeline is an add-on for Power Point, thus, provides regular Power Point functionalities. For users familiar with regular Power Point is is therefore easy to learn. It offers a wizard to add timeline information and a variety of different visual timeline templates. Timeline Studio and Timeline Maker are two tools specifically designed to support the generation of timelines and manage detailed information belonging to timeline events.
5.1
Evaluation of Timelines
To determine the fit of the timeline tools with the specific purpose of visualizing process change, the selected three timeline tools were reviewed according to a coding-schema developed on basis of the requirements which are presented in Section 4. Three experts
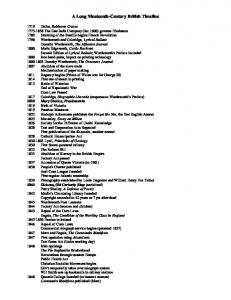
first scored the tools independently and then discussed ratings in a face-to-face meeting to reach a final, consensual rating. Figure 2 gives an overview of the results of the comparison of the timeline tools. As all tools offered a separate presentation and editing mode, the modes were independently reviewed. If not indicated otherwise in the table, presentation and editing mode got the same evaluation. Next, we discuss results concerning each requirement, in turn: Clear Change Representation. Representation of change actions is possible in all three tools, mostly by adding text fields, in a notes files or by adding hyperlinks. Concerning the representation of additional change attributes in general, it is not possible to enter information in a structured way, but only as unstructured text. Therefore, consistency of the type of information added (as change triggers, change actors or lessons learned) is up to the editor. In Timeline Studio, users can see additional information in the detail view of a version (e.g., in description or note). Similarly, Timeline Maker offers notes which can be made visible in the presentation mode, too. Visibility of Relationships between Versions. The support of process model visualization was quite weak in all three tools and almost no interaction with the process models is possible. In Office Timeline processes can be added as text (e.g., source code), as picture or as video for representing the change tracking graph, sound or links to URLs. The other tools also allow to link pictures and other types of files to specific events in the timeline, however, the processes are not visible in the same view as the timeline, but only in a separate window. Investigated timeline tools as a matter of fact support timeline visualization. Office Timeline offers a function to automatically create a table of milestones and intervals in chronological order based on the timeline. In Timeline Studio a textual description of the timeline information sorted in chronological order can be exported into Microsoft tools, but is not available in the tool itself. In TimelineMaker, the event entry as well as the chronology order view represent the timeline in tabular format (both part of the editing mode). Different Views. In all three tools it is possible to see overview and detail information of the timelines. For instance, in the tool Office Timeline hyperlinks can be used in the presentation mode for detailed information. In the editing mode thumbnails show an overview of all slides on the left. However, there are no possibilities to show large timelines adequately. Timeline Studio also offers several views in the editing mode. The home view gives an overview about all process models and versions. Views on each process model present detailed information (e.g., about change information, or a change tracking graph). In addition, it is possible in the presentation mode to click on an event to see additional information (in the form of text, pictures, or links) in a new window. TimelineMaker presents overview and detail information in both, presentation and editing mode. In the presentation mode detail information about events is available on demand. It can be linked in form of files and text (place, notes, source), which are shown in a new window. In the editing mode, there also exist several views for overview and detail, e.g., thumbnails for overview. Concerning multiple views, Office Timeline uses this concept only in the editing mode (thumbnail, slideview, notes view). In Timeline Studio different views can also be found in the editing mode, when details about an event (e.g., images, notes, links and descriptions) are edited. TimelineMaker provides different views in several subwindows
Criteria Clear change representation Change actions Additional change attributes Visibility of relationships between versions Process models Textual Representation Timeline Representation Different views Overview and detail Multiple views Interaction Brushing and linking Filter Scrolling Panning Content zoom Zooming Search
Office Timeline
Timeline Studio
Timeline Maker
Yes Yes
Yes Yes
Yes Yes
Yes No Yes
Yes Yes Yes
Yes Only in Editing Mode Yes
Yes Only in Editing Mode
Yes Yes
Yes Only in Editing Mode
Only in Editing Mode No Only in Editing Mode No No Only in Editing Mode Only in Editing Mode
Only in Editing Mode Yes Yes No Only in Editing Mode No Only in Editing Mode
Only in Editing Mode Yes Yes Only in Presentation Mode Only in Editing Mode Yes Only in Editing Mode
Figure 2: Evaluation of timeline tools.
in the editing mode. In general, it is not surprising that the tools use different views more often in the editing mode than in the presentation mode, which usually tries to direct the viewers’ attention on one piece of information at a time. Interaction. Brushing and linking cannot be found in the presentation modes of the tools, but only in the editing modes. However, this concept is not directly used for interaction with the timeline, but to correctly associate detail and overview information (e.g., highlighting thumbnail of current slide on the left in Power Point). Filtering (e.g., of different time ranges and groups of processes) could only be found in the tool Timeline Studio, but not in the other tools. Scrolling is very common and could be found in all tools, while panning was only used by Timeline Maker in the presentation mode. The results concerning content zoom are interesting in so far as they demonstrate that the two time line tools Timeline Studio and Timeline Maker are targeting at dealing with the semantic information of timelines, and thus providing this option, while Office Timeline focuses on mere visualization of timeline information. Only Timeline Studio does not provide zooming. In contrast, search as a basic tool functionality is provided by all tools in the editing mode.
6
Design Concept
Based on the insights which we gained during our inspection sessions (see Section 5), we developed a visualization concept (see Figure 3 and Figure 4) in consideration of the requirements presented in Section 4. Different Views. Multiple views are used in order to support the presentation of change information from different perspectives: timeline view, process model view and list view. The timeline view provides an overview of all process models’ timelines. The juxtaposition of the different timelines allows users to compare the timelines with each other. After
Figure 3: There exist three views: timeline view, list view and process model view. In this example the process model ”Process SKS” is selected. Information (e.g., start date and end date) about ”Process SKS” is presented in the list view and the corresponding process model is visualized in the process model view.
a timeline is selected, the list view presents the corresponding detailed information (e.g., start date, end date, description of the process model) and the process model is presented in the process model view (see Figure 3). The timeline is depicted as a rectangle to visualize the time span. The arrow symbol – located next to the process model name – allows users to expand and collapse change information for each process model in the timeline view (see Figure 4). In addition to expand or collapse the change information for each timeline separately, it is also possible to expand or collapse all timelines at once (e.g., via context menu). When users select the change information in the timeline, detailed information about the changes is presented in the list view and the changes are highlighted in combination with the corresponding process model in the process model view. In a previous study [KKRM11] we had evaluated two graph layouts for combining process models with change information (also called change tracking graph). As already mentioned in Section 2, one layout considered the mental map and the other layout optimized the graph according to some aesthetic criteria. The results of the evaluation had shown that users had different preferences. Thus, in our approach users have the choice how the change tracking graph is presented in the process model view. The example in Figure 4 visualizes the change tracking graph in consideration of the initial process model (mental map approach). A detailed description of the change visualization in the timeline view, list view,
and process model view is presented in the subsection Clear Change Representation. Interaction. The timeline view, process model view and list view are linked together via brushing and linking technique. It is possible to select the process model in the list view but also in the timeline view and the corresponding information about the selected process model is updated in all three views. For example, in Figure 3 the process model ”Process SKS” is selected in the timeline view and the corresponding entry is highlighted in the list view and the corresponding process model is presented in the process model view. Furthermore, search and filter functions are available (e.g., via context menu) in order to show only information that users want to analyze in detail. For example, users can filter out periods in timelines without any change information, to present only changes by a specific change owner or to show only the timelines within a specific time span. The search function is helpful, e.g., to find a specific process model or a specific change action within a process model. If a large amount of data has to be presented, scrolling and panning are available to navigate within the different views. Furthermore, users have the possibility to navigate between change actions with the help of two arrow symbols in the process view in order to go step by step along the timeline (see Figure 4). Moreover, a zooming function helps to magnify parts in the different views and content zooming allows to switch between month, week, and day time scale. Clear Change Representation. In all three views, users can see which change actions were conducted. The information about change actions in the timeline view is available after the timeline has been expanded. The change actions are visualized as lines and the color reflects which kind of change actions (e.g. adding or deleting) were conducted. The line represents the point of time when the change was made and the thickness of the lines corresponds to the number of change actions for the specific time period. The example in Figure 4 shows the change actions for the process model ”Process GHJ” and ”Process SKS” in the timeline view. The time axis in this example splits the change actions into months. With content zooming it is possible to present all change actions, e.g., from a week or day for a detail analysis. Users can select the time unit (in Figure 4 months are used) or each change action separately. If users click the white space between two lines in the timeline, the process model version for this point in time is visualized in the process model view. The selected change actions are presented in the list view and are highlighted in the process model view. In all three views the same color code for the change actions is used. Although other visual properties (e.g., brightness or size) can also be used to highlight change actions in process models, one of our previous studies [KKRM11] showed that the usage of color to present changes was for most participants clear and preferred over other visual properties. Additional sources (e.g., description of a process model as separate text file) can be included in the visualization. If additional sources are available for a process model, a button in the process model view appears to open these sources in a separate window (see Figure 4). Moreover, additional change attributes (e.g., change owner) is presented in the list view. Furthermore, users have the possibility to rate and comment the conducted changes (see Figure 4). Visibility of Relationships between Versions. The change information is available graphically in the timeline view and in the process model view as well as in textual form in the list view. The change actions are listed chronologically in the list view and in the time-
Figure 4: Change information can be expanded and collapsed for each timeline. Change information is available in all three views. Users can rate and comment changes in the process model view. In this example the like button is selected and the bar chart next to the rate buttons depicts the current voting result. Furthermore, users can read and write comments. The comment window can be expanded or collapsed on demand.
line view (see Figure 4). Furthermore, the list view also shows the dates when the changes were conducted. The actual date is presented as a line in the timeline view in order to show which process model is currently valid. Moreover, after filtering of or searching within a specific time span, the time span is additionally highlighted in the timeline view and only the timelines within the selected time span are visualized.
7
Conclusion
In this work we wanted to find out which attributes of change may be helpful for understanding and documenting changes and if timelines can help to document and visualize change of process models. We presented and discussed change attributes (such as triggers, process models, actions planned, evaluated and actually taken, time, actors and lessons learned) that support a detailed documentation of change. To find out to what extend current timelines can support the documentation of process model change, we first inspected three widely used tools for timeline visualization in regard to their fit with the change
visualization requirements for business processes identified in previous work [KRM12] including the change attributes. Evaluation results showed that the requirements interaction and clear change representation offered room for improvement from the process model change documentation perspective. We further presented a first concept for visualizing and documenting process model change by means of timelines. The design concept for our approach was guided by relevant change visualization requirements and change attributes. The representation of the change performed in process models was influenced by the change tracking graph [KKRM11] as method to visualize and document change actions. We believe this work is a valuable initial step towards a holistic visualization solution for change documentations that address changes in and of process models.
References [CMS99]
S. K. Card, J. D. Mackinlay, and B. Shneiderman, editors. Readings in Information Visualization: Using Vision to Think. Morgan Kaufmann Publishers Inc., 1999.
[DKN+ 10] F. Daniel, A. Koschmider, T. Nestler, M. Roy, and A. Namoun. Toward process mashups: Key ingredients and open research challenges. In Proc. of the 3rd and 4th Int’l Workshop on Web APIs and Services Mashups, pages 9:1–9:8. ACM Press, 2010. [FS97]
P. Faraday and A. Sutcliffe. Designing effective multimedia presentations. In Proc. of the SIGCHI Conf. on Human Factors in Computing Systems (CHI’97), pages 272–278. ACM Press, 1997.
[GRF08]
T. M. Green, W. Ribarsky, and B. Fisher. Visual analytics for complex concepts using a human cognition model. In Proc. of the IEEE Symposium on Visual Analytics Science and Technology (VAST’08), pages 91–98. IEEE, 2008.
[HDL68]
S. Handel, C. B. DeSoto, and M. London. Reasoning and spatial representations. Journal of Verbal Learning and Verbal Behavior, 7(2):351–357, 1968.
[IBM05]
IBM. IBM WebSphere Business Integration Handbook. Technical report, IBM, 2005.
[KG99]
M. Kradolfer and A. Geppert. Dynamic workflow schema evolution based on workflow type versioning and workflow migration. In Proc. of the IFCIS Int’l Conf on Cooperative Information Systems, 1999 (CoopIS’99), pages 104–114, 1999.
[KKRM11] S. Kabicher, S. Kriglstein, and S. Rinderle-Ma. Visual change tracking for business process models. In Proc. of the 30th Int’l Conf on Conceptual Modeling (ER’11), pages 504–513. Springer, 2011. [Kri11]
S. Kriglstein. Human Centered Visualization of Ontologies (Doctoral thesis). PhD thesis, University of Vienna, 2011.
[KRM12]
S. Kriglstein and S. Rinderle-Ma. Change Visualization in Business Processes - Requirements Analysis. In Proc. of the Int’l Joint Conf. on Computer Vision, Imaging and Computer Graphics Theory and Applications (GRAPP/IVAPP). SciTePress, 2012.
[MR05]
S. L. Mansar and H. A. Reijers. Best practices in business process redesign: Validation of a redesign framework. Computers in Industry, 56(5):457 – 471, 2005.
[Nie94]
J. Nielsen. Usabiltiy Inspection Methods. John Wiley and Sons, 1994.
[Nor01]
C. North. Multiple views and tight coupling in visualization: A language, taxonomy, and system. In Proc. of the CSREA CISST 2001 Workshop on Fundamental Issues in Visualization, pages 626–632, 2001.
[Nor05]
C. North. Information Visualization. In G. Salvendy, editor, Handbook of Human Factors and Ergonomics, pages 1222–1246. John Wiley & Sons, 2005.
[RC08]
J. Rubin and D. Chisnell. Handbook of Usability Testing: How to Plan, Design, and Conduct Effective Tests (2nd Edition). Wiley Publ., 2008.
[RRD03]
M. Reichert, S. Rinderle, and P. Dadam. On the Common Support of Workflow Type and Instance Changes under Correctness Constraints. In Proc. 11th Int’l Conf. Cooperative Information Systems (CooplS ’03), pages 407–425. Springer, 2003.
[RRD04]
S. Rinderle, M. Reichert, and P. Dadam. Correctness criteria for dynamic changes in workflow systemsa survey. Data and Knowledge Engineering, 50(1):9 – 34, 2004.
[RRJK06]
S. Rinderle, M. Reichert, M. Jurisch, and U. Kreher. On representing, purging, and utilizing change logs in process management systems. In Proc. of the 4th Int’l Conf on Business Process Management (BPM’06), pages 241–256. Springer, 2006.
[Spe07]
R. Spence. Information Visualization: Design for Interaction (2nd Edition). PrenticeHall, Inc., 2007.
[TKW91]
B. Tversky, S. Kugelmass, and A. Winter. Cross-cultural and developmental trends in graphic productions. Cognitive Psychology, 23(4):515–557, 1991.
[vdAB02]
W.M.P van der Aalst and T. Basten. Inheritance of workflows: an approach to tackling problems related to change. Theoretical Computer Science, 270(12):125 – 203, 2002.
[vdAJ00]
W.M.P. van der Aalst and S. Jablonski. Dealing with Workflow Change: Identification of Issues an Solutions. Int’l Journal of Comp. Systems, Science and Engineering, 15(5):267–276, 2000.
[Wes07]
M. Weske. Business Process Management. Concepts, Languages, Architectures. Springer, 2007.
[Wil09]
C. Wilson. User Experience Re-Mastered: Your Guide to Getting the Right Design. Morgan Kaufmann, 2009.
[WMC99]
C. Workflow Management Coalition. Workflow Management Coalition - Terminology and Glossary, Document Number WFMC-TC-1011, Document Status - Issue 3.0. Technical report, Workflow Management Coalition, 1999.
[WRRM08] B. Weber, M. Reichert, and S. Rinderle-Ma. Change patterns and change support features - Enhancing flexibility in process-aware information systems. Data Knowl. Eng., 66:438–466, 2008. [YKSJ07]
J. S. Yi, Y. ah Kang, J. Stasko, and J. Jacko. Toward a Deeper Understanding of the Role of Interaction in Information Visualization. IEEE Transactions on Visualization and Computer Graphics, 13(6):1224–1231, 2007.
[ZL07]
X. Zhao and C. Liu. Version management in the business process change context. In Proc. of the 5th Int’l Conf on Business Process Management (BPM’07), pages 198– 213. Springer, 2007.