Academic Research International Vol. 7(1) January 2016 ____________________________________________________________________________________________________________________________________________________________________________________________________________________________________________________________________________________________________________
PROFILING DISASTERS IN KENYA AND THEIR CAUSES Julius M. Huho1, Janet N. Mashara2, Peter K. Musyimi3 1
2-3 1
Department of Tourism and Hospitality Management, & Department of Humanities, Karatina University, Nyeri, KENYA.
[email protected],
[email protected],
[email protected]
ABSTRACT Disasters occur naturally or are caused by human activities. Most of the disasters experienced occur naturally with hydro-meteorological disasters leading. Human activities aggravate their occurrence and intensity. Global trends indicate that both natural and man-made disasters are on the increase and the more people are being affected. The most vulnerable are the poor who are exposed to various disaster risks. Most of these people are found in the developing countries where the level of disaster preparedness, resources and knowhow is still low. Kenya, like other developing countries of the world, has her populace vulnerable to disaster risks resulting in deaths and loss of property worth millions. About 70% of the disasters are hydrometeorological in nature particularly droughts and floods. Other common disasters include road accidents, fire tragedies, collapsing buildings and disease outbreaks. Poverty has been referred to many as the spring board of many disasters in Kenya. Poverty has led to emergence of vices such as corruption, ignorance of law, political manipulation, inadequate resources and destruction of environment which leads to climate change. Culture and beliefs have also been associated with vulnerability to disaster risks. Therefore, to reduce the risks wealth creation will be vital for the country. Keyword: Natural disasters, man-made disasters, disaster risks and poverty
INTRODUCTION Disasters occur in all parts of the world ranging from being highly localized to global phenomena. According to Than (2005), Office of US Foreign Disaster Assistance (OFDA) defines a disaster as an event that kills 10 or more people or leaves at least 100 people injured, homeless, displaced or evacuated. Disasters, which are categorized based on their origin, are either man-made (anthropogenic) or natural in nature. However, natural disasters, particularly those related to weather occur frequently accounting for more than 70% of all global disasters. Such disasters include: floods, cyclones, tornadoes, blizzards and droughts. Human activities play a role in the frequency and severity of these disasters through global warming. Other natural disasters (geophysical in nature) that can be utterly devastating but occur less frequently are earthquakes, volcanic eruptions, tsunamis and avalanches. Manmade disasters occur as a result of human activities thus also referred to as anthropogenic disasters. They can be divided into technological, sociological and transportation disasters. In most cases, man-made disasters are unintentional, but, are caused due to some intentional activities. Save for a few which are intentional such as terrorism activities, most of them are as a result of accidents that could have been otherwise prevented if sufficient precautionary measures were put in place. Man-made disasters include: structural collapse, chemical leaks, spillovers, nuclear leaks, man-made fires, terrorist activities, accidents and politically instigated violence. Reliefweb (2015) observes that although the frequency of geophysical disasters has remained relatively constant between 1994 and 2013, hydro-meteorological disasters have been on the rise (Figure 1). In the 1980s an annual average of about 100 hydro-meteorological disasters Copyright © 2016 SAVAP International
www.savap.org.pk
e ISSN: 2223-9553 www.journals.savap.org.pk
ISSN: 2223-9944, 290
Academic Research International Vol. 7(1) January 2016 ____________________________________________________________________________________________________________________________________________________________________________________________________________________________________________________________________________________________________________
were reported but this has risen to over 300 a year since 2000 (Than, 2005). Since 2000, an annual average of 341 climate-related disasters has been recorded, which is 44% above the 1994 - 2000 average and over twice the 1980-1989 average. In the last two decades (1994 – 2013), a total of 6,873 natural disasters worldwide were recorded. These disasters claimed 1.35 million lives or almost 68,000 lives on average each year while affecting about 218 million people per annum. Of all the natural disasters, flooding accounted for 43% of all recorded events and affecting nearly 2.5 billion people. Storms were the second in frequency killing more than 244,000 people and costing US$936 billion in recorded damage making it the most expensive type of disaster (Figure 2). Although droughts accounted for only 5% of disaster more than one billion people or 25% of the global total were affected (Reliefweb, 2015). While disasters can be slow on onset such as droughts, most occur suddenly and perhaps unexpectedly causing massive loss of lives and property (Table 1).
Figure 1: Global trends for natural disaster subgroups (EM DAT 2015)
Figure 2: Global trends for various types of natural disaster (EM DAT 2015) Copyright © 2016 SAVAP International
www.savap.org.pk
291
ISSN: 2223-9944, e ISSN: 2223-9553 www.journals.savap.org.pk
Academic Research International Vol. 7(1) January 2016 ____________________________________________________________________________________________________________________________________________________________________________________________________________________________________________________________________________________________________________
Table 1. Various types of natural disasters and their effects between 2010 and 2013 Date/ Year
Where
Type
Killed
Other effects - 1,400 sq km of arable land affected - Many people left homeless - 167,000 injuries - 400,000 homes damaged - 75% of wheat crops were lost in Ukraine - Europe forest fires
Mozambique
Floods
- 800 people - 20,000 cattle
Gujarat, India
earthquake
20,000
Europe
Heatwave
14,802 in France
Indonesia, Sri Lanka, South India, and Thailand
Earthquake and Tsunami
200,000 to 310,000 people
US
Hurricane
Oct 8, 2005
Pakistan
Earthquake
75,000 people
2008
Myanmar
Cyclone
- 84,500 people
Blizzard
- 1,337 people - over 100,000 sheep and goats and 315,000 cattle
Feb 2000
Mar
Jan 26, 2001 2003
Dec 26, 2004
2005
2008
Afghanistan
- Billions worth of property damaged US $81 billion worth property damage - 106,000 people injured - Severe damage to buildings - 53,800 people missing
Jan 12, 2010
Haiti
earthquake
- Over 200,000 deaths
Feb 22, 2011
New Zealand
Earthquake
185 people
Mar 11, 2011
Japan
Earthquake followed by tsunami
- 15 million dead or injured
2011
East Africa
Drought
--
Nov 8, 2013
Philippines
Typhoon
- 6,000 people killed
Dec 2013
Philippines
Earthquake
- 222 people killed
- At least 100 people underwent frostbite amputations - 2 million people left homeless - 3 million people in need of emergency aid - 238 people missing - 164 injuries - Estimated US $16 billion worth of damages - 2,814 people missing - Over 250,000 buildings damaged - 12.4 million people in need of food - loss of livelihood for 9.5 million people - Over 3.6 million people displaced - 350,000 people displaced - About 73,000 buildings damaged
Source: Josef (2013) and Huber (2013) Copyright © 2016 SAVAP International
www.savap.org.pk
e ISSN: 2223-9553 www.journals.savap.org.pk
ISSN: 2223-9944, 292
Academic Research International Vol. 7(1) January 2016 ____________________________________________________________________________________________________________________________________________________________________________________________________________________________________________________________________________________________________________
Transportation disasters dominate the category of man-made disasters in terms of loss of lives and frequency of occurrence (Figure 3). Globally, it is the leading cause of death among people aged between 15 and 29 and second most common cause of death for people aged between five and 14 years (source). Currently an estimated 1.3 million die due to road accidents globally each year and for every death up to 50 people are injured or disabled. Despite having 46% of the global vehicles in low and medium income countries, about 90% of the global fatalities from traffic accidents occur in these countries. Statistics show that if business remains as usual, death rates emanating from road accidents in low and medium income countries will double by 2020 reaching to 1.8 million and to about 2.4 million by 2030 per year. In Kenya, traffic deaths are the highest in East African region recording approximately 3000 deaths per year (WHO Global status report, 2009).
Figure 3: Global trends for man-made disasters (EM DAT 2015)
Fire disasters are very common in both developed and developing countries. They have diverse causes which are either man-made or natural. However, most of the fire disasters are man-made and include electrical faults (mostly due to overloading and short circuits), pantry area (cooking gas leaks, cooking oil, overheating of cooking medium), smoking (in/around combustible medium, falling hot ashes from the cigarette on a flammable material) and arsonist attacks. Overall, fire disasters are higher during dry period and some festive events when demand for electricity or use of fire is high. Some of the major fire disasters cause massive loss of lives such as the May 1993 toy factory fire in Thailand where 240 people were killed, the October 1995 underground fire in Azerbaigian (300 killed), the December 1995 elementary school fire in India (400 killed), and the April 1997 mina fire in Saudi Arabia where 343 people were killed (Cavallini, et al., 2007). The 2001 World Trade Centre explosion led to more than 3000 deaths while the August 2004 supermarket fire in Paraguay resulted in at least 423 deaths and 139 missing. Generally, global trends indicate that both natural and man-made disasters are increasing (Figure 4 and 5). Unfortunately, the worst affected are the vulnerable people from developing nations. For instance, about 41% of the drought disasters were in Africa. Despite the fact that disaster impacts vary from one community to the other or from one nation to the other depending on the level of preparedness, poor communities and developing countries are the most vulnerable. Asian and Africa are leading in the occurrence of disasters. Copyright © 2016 SAVAP International
www.savap.org.pk
293
ISSN: 2223-9944, e ISSN: 2223-9553 www.journals.savap.org.pk
Academic Research International Vol. 7(1) January 2016 ____________________________________________________________________________________________________________________________________________________________________________________________________________________________________________________________________________________________________________
Figure 4: natural disasters trends by continent (EM DAT 2015)
Figure 5: Man-made disasters trends by continent (EM DAT 2015)
DISASTERS IN KENYA Over the years and like any other parts of the world, Kenya has been exposed to a variety of both man-made and natural disasters such as fires, droughts, floods, landslides, HIV/AIDS, human conflicts, drug abuse, traffic accidents, oil spill, industrial accidents and terrorism. The diversity, frequency of occurrence and magnitude of the disasters has been on the rise in the last two decades resulting in increase in number of people affected. However, over 70% of the disasters are hydro-meteorological in nature. These comprise of droughts, floods and landslides. In some parts of the country, particularly the northern corridor, droughts are a norm rather than exception. Though less frequent compared to droughts, when they occur floods displaces thousands of people and lead to loss of life and property. Copyright © 2016 SAVAP International
www.savap.org.pk
e ISSN: 2223-9553 www.journals.savap.org.pk
ISSN: 2223-9944, 294
Academic Research International Vol. 7(1) January 2016 ____________________________________________________________________________________________________________________________________________________________________________________________________________________________________________________________________________________________________________
Droughts Droughts can generally be defined as a prolonged period of abnormally low rainfall. However, droughts have been defined from various viewpoints depending on the interest of the end user of climate information. Various types of droughts have been suggested and can be broadly categorized as meteorological, hydrological and agricultural drought. Meteorological droughts occur when the amount of rainfall received is below normal. It is based on the degree of dryness in comparison with the normal (average) rainfall conditions and the duration of dryness. Hydrological drought occurs following a prolonged period of precipitation shortfall that negatively impacts on water supply leading to water shortages. When precipitation shortfall results to soil water deficits affecting agricultural productivity, the drought is categorized as agricultural. As such, meteorological drought can occur without necessarily having agricultural drought. In the last two decades, Kenya has experienced several episodes of drought, both short-term (2 years and below) and long-term (above two years). Some of the notable droughts occurred in 2004 and 2008 -2011. The severe drought of 2008 – 2011 had overall effect of about Ksh 968.6 billion (Ksh 64.4 billion for the destruction of physical and durable assets and Ksh 904.1 billion for losses in the flows of the economy across all sectors) (GOK, 2012). The impact of the drought was sector dependent with livestock experiencing the largest damages and losses as shown Table 2 below. Failure of the long rains (March–May) in 2004 caused a severe drought which led to crop failure. As a result, over 2.3 million were people in need of humanitarian assistance (Kandji, 2006). Other droughts that had significant impact in livelihoods and economy in general include the 1999- 2000 La Nina drought that led to power rationing in Kenya leading a loss of approximately US $20 million to Kenya Power and Lightening Company (KPLC) and serious disruption of economic activities. The national gross domestic product (GDP) contracted by about 0.3% as the aftermath of the drought. By June 1999, an estimated 1.7 million people were in dire need of food assistance with the figure rising to 4 million by December 2000 (Duran, 2005). The drought was declared a national disaster. Table 3 shows recent droughts and the associated impacts in Kenya Table 2. Sectorial economic impact of 2008-2011 drought Sector affected
Impact (USD)
% impact
Agriculture
1,453.8
12.5
Livestock
8395.3
72.2
Fisheries
49.9
0.43
Agro industry
85.9
0.74
Health and nutrition
137.3
1.2
Education
47.8
0.41
Energy
388.8
3.3
Water and sanitation
1058.8
9.1
9.1
0.07
11,627.2
100%
Environment & tourism Total
Source: GOK, 2012 Copyright © 2016 SAVAP International
www.savap.org.pk
295
ISSN: 2223-9944, e ISSN: 2223-9553 www.journals.savap.org.pk
Academic Research International Vol. 7(1) January 2016 ____________________________________________________________________________________________________________________________________________________________________________________________________________________________________________________________________________________________________________
Table 3. Recent droughts and their effect in Kenya Year
Disaster type
Area of Occurrence
Effects
2012
Drought
Widespread
3.75 million people in dire of food by July 2012
2011
Drought
Garissa, Isiolo, Wajir, Mandera, Mombasa, Marsabit, Nairobi, Turkana, Samburu and Turkana Counties
4.3 millionpeople were in dire need of food
2009
Drought
Widespread
2007-08
Drought
widespread
2006
Drought
Widespread
2005
Drought
Widespread
2004
Drought
Widespread
19992001
Drought
Widespread
70-90% loss of livestock by Maasai pastoralists 4.4 million people affected, 2.6 million people at risk of starvation, up to 70% loss of livestock in some pastoral communities. 3.5 million in need food by September. 40 human lives lost and about 40% cattle, 27% sheep and 17% goats lost 2.5 million people close to starvation. Declared a national disaster About 3 million people in need of relief aid for 8 months to March 2005 70% loss of livestock in some pastoral communities 4.4 million people affected
Flood and Landslide Floods, just like droughts, are recurrent phenomenon affecting many parts of the country. However, the worst affected areas are the low-lying swampy tracts in Lake Victoria Basin namely Budalangi and the Kano Plains and the Tana River floods. The subsequent effects are loss of lives, infrastructure, food reserves and erosion. In recent times, episodes of urban flooding have been observed in Nairobi City and Narok town (Figure 6).
Figure 6: Flooding in Narok town Copyright © 2016 SAVAP International
www.savap.org.pk
e ISSN: 2223-9553 www.journals.savap.org.pk
ISSN: 2223-9944, 296
Academic Research International Vol. 7(1) January 2016 ____________________________________________________________________________________________________________________________________________________________________________________________________________________________________________________________________________________________________________
Occasional floods are also experienced in drylands where heavy storms fill up the dry river valleys causing flash floods downstream. Such episodes are common in Turkana,Samburu and eastern Kenya. The 1997/98 El Niño floods remain the most remarkable floods in the history of Kenya. Over 1.5 million people were affected in different parts of the country. Like floods, landslides are triggered by heavy rainfall and are common in hilly areas of the country. They result from the weakening of slope stability due to increased soil moisture. They are common in central and western Kenya. Landslides are not frequent and are highly localized affecting a handful of people. However, they lead to loss of live and livelihood source of the affected families. In 2000 for instance, about 2000 people were affected by landslides that occurred in Meru Central, Murang’a and Nandi. Five deaths were reported during the 2004 Landslides in Nyeri, Othaya and Murang’a. Table 4 shows some recent floods and landslide disasters in Kenya. Table 4. Recent floods and landslides and their effects in Kenya Year
Disaster Type
Where
Effects
2015
Floods
Widespread
15 people killed and thousands displaced Infrastructure destroyed
Floods
Narok Town, Nairobi City
Property and infrastructure destroyed
Landslides
Muranga County
Floods
Tana River County
82,000 people displaced
Landslides
Nyeri, Murang’a, Kisii
2000 people displaced
Floods
Nyanza/Western
84 people killed, 30,000 displaced About 280,000 people affected countrywide
Landslides
ElgeyoMarakwet County
10 people killed, hundred displaced
Floods Landslides
Budalangi, Tana river, Turkana Bududa,Mt Elgon ,Samburu Rift valley, Kitale, Makueni, Mwala/Kibwezi, Bundalangi
73 killed, 14,585 people affected 3000 people buried, property destroyed
Mudslides
Pokot central
11 people killed
2007
Mudslides
TaitaTaveta County
3 dead
2006
Floods
Widespread
7 deaths, 6,500 people displaced
2005
Storm
Merti – Isiolo
4,000 people cut-off between Isiolo and Merti for 7 days
2004
Floods/ Land Slides
Nyeri/OthayaKihuri
5 people dead
2003
Floods
2014
2013
2012
2010
Floods 2008
Floods 2002 199798
Nyanza and Westen, Tana River Basin Nyanza, Busia, Tana River basin
24 people killedwith 2396 affected
60,000 people affected by severe floods 150,000 people affected
Landslides
Meru Central, Murang’a, Nandi
2,000 people affected
El Nino Flood
Widespread
1.5million people affected
Copyright © 2016 SAVAP International
www.savap.org.pk
297
ISSN: 2223-9944, e ISSN: 2223-9553 www.journals.savap.org.pk
Academic Research International Vol. 7(1) January 2016 ____________________________________________________________________________________________________________________________________________________________________________________________________________________________________________________________________________________________________________
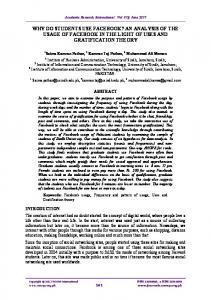
Fire Disasters Fires accidents have the most diverse causes of all the disasters. As a result they occur frequently ranging from damage of a single item to large areas such as forests or agricultural lands. Wildfires are more frequent in ASAL areas. The extent of damage however, depends on the type of fire (nature of the material ablaze), the meteorological conditions (wind) and the effectiveness of the intervention. As long as fire is under control, it is very useful to man but once out of our control, it causes massive destruction. Kenya has not been an exception to fire disasters. For instance, in 1977, an electrical fault in the telephone system at the original African Heritage House in Nairobi sparked an inferno that destroyed the entire gallery, workshops, stores, the restaurant and the garden café. In addition to the huge damage, the loss of preserved African culture was incalculable. One of the worst fire disasters in the 1990s was the Langoni fire in Lamu that occurred in 1982. This fire, though led to very few deaths, it left 4, 000 people homeless and destroyed businesses. In 2009,Lamu had also another fire incident that rendered 80 % of entire settlement burnt and left over 2,500 people homeless. Fire disasters have also been recorded in learning institutions some of which are as a result of arsonist attacks or electrical failure. For instance, arsonist started fire in Bombolulu Girls High School in Mombasa in 1998 destroying property and killing 25 girls. In March 26th2001, the Kyanguli Mixed Secondary School arson fire shocked many in the country. A school dormitory was set ablaze by arsonists leading to loss of about 68 students. Though the dormitory had two exits, by the time of the tragedy, only one exit was operational. The other exit was locked and keys misplaced. In January 28, 2009, an inferno caused by an uncovered generator razed down Nakumatt Downtown Supermarket in Nairobi leading to loss of tens of lives and hundreds of millions worth of property (Figure 7). During the incident, the guards and the management locked the main doors to prevent looting. This led to more deaths. After the inferno at least 29 people were confirmed dead with 47 missing with a likelihood of them being charred beyond recognition. Ironically, the supermarket was located just a hundred meters away from Nairobi’s only public fire station.
Figure 7: Nakumatt Downtown fire tragedy in Nairobi
In February 1, 2009, three days after the Nakumatt Downtown Supermarket, a road accident at Sanchang’wan shopping centre in Rift Valley that involved a fuel tanker led to loss of 120 lives. This was after residents of Sanchang’wan rushed to siphon off some of the 47, 000 liters of fuel the fuel tanker was ferrying while others stood at a safe distance spectating. Unfortunately, when the tanker exploded, the flames trapped those who were siphoning and
Copyright © 2016 SAVAP International
www.savap.org.pk
e ISSN: 2223-9553 www.journals.savap.org.pk
ISSN: 2223-9944, 298
Academic Research International Vol. 7(1) January 2016 ____________________________________________________________________________________________________________________________________________________________________________________________________________________________________________________________________________________________________________
the spectators. Later in the year in august, a similar disaster occurred in Kapokyek village near Kericho killing about 45 people. The Sinai Pipeline Fire tragedy occurred in Mukuru-Sinai slum in Nairobi in September 12, 2011 when a failed gasket at a nearby fuel tank leaked about 19 million cubic meters of petrol into an open storm drain that flowed right through the slum. The inferno razed hundreds of slum shanties and killed about 120 people with 116 people being hospitalized. The exact total number of deaths remains as estimates due to the congestion in the slum. In March 2009, forest fire razed about 30,000 hectares of Mau forest in a single arson attack. Later in January 2012, Kiptagich area of Western Mau Forest caught fire destroying approximately 1500 hectares. Structural collapse Disasters associated with collapse of buildings have been on the rise in the recent past in Kenya becoming death traps and causing huge financial losses. For instance, in January 23, 2006, a five-storey building under construction in the central business district in Nairobi, Kenya collapsed killing 11 and trapping over 200 workers under the debris. Other incidences involving collapse of buildings include: October 2009 and January 2010 in Kiambu town, June 2011 in Embakasi, June 2011 in Langata Southern Bypass, September 2011 in Luanda, June 2012 in Mlolongo along Mombasa Road (5 people killed and 10 injured), January 2013 in Nairobi CBD (11 people killed and 200 trapped), December 17, 2014 in Nairobi (1 person killed) and May 12 2015 in Mukuru Fuata Nyayo area of South B (9 people killed). Such disasters occur due to structural failure.
Figure 8: Collapsed buildings in South B, Nairobi and Kiambu respectively
Transportation accidents In Kenya, road accidents are the third leading causes of death after malaria and HIV/AIDS. With over 3,000 deaths annually from road accidents (Figure 9), the World Health Organization (WHO) has placed Kenya as among the countries with the highest rate of accidents globally and the leading in East Africa. Ironically, like other developing countries, Kenya has a low motorization level of about 1.3 million vehicles. About 85% of the road accidents are caused by human factors, 11% is associated with vehicle conditions while 4% are as a result of the environment. Speeding and drunken driving are the major human factors that lead to road accidents. As such, most accidents occur on Saturday when most people take alcohol. According to NTSA, Wednesday is the safest day to travel on Kenyan roads recording an average of 200 victims. An average of 400 people gets involved in accidents on Saturdays and 320 on Sundays, Tuesdays and Fridays. All in all, majority of the accidents occur between 6 and 10 pm. In addition to speeding and drunken driving at this time of the Copyright © 2016 SAVAP International
www.savap.org.pk
299
ISSN: 2223-9944, e ISSN: 2223-9553 www.journals.savap.org.pk
Academic Research International Vol. 7(1) January 2016 ____________________________________________________________________________________________________________________________________________________________________________________________________________________________________________________________________________________________________________
day, reduced enforcement of traffic rules and pedestrians crossing at undesignated areas has been the major cause of the accidents.
Figure 9: A wreckage of a bus involved in an accident on Kenyan roads
Despite efforts by the government to reduce road accidents, the number seems to be increasing causing more fatalities and loss of lives. Statistics indicate that more than 13,000 road accidents occur annually, resulting in an average of about 3,000 fatality and more than 11,000 injuries. The most vulnerable to road accidents are the low to middle income population who largely use public service vehicles and two-wheeled means of transport which are the biggest cause of road deaths in Kenya. Statistics indicate that about 46% of the road accident deaths are from the pedestrians, cyclists and riders of motorized two wheelers and their passengers. For instance, in May 2010, about 144 pedestrians died from road accidents while about 189 sustained serious injuries. In Kenya today, bodaboda accidents is an emerging disaster. Out of 100 people involved in bodaboda accidents, three lose their lives. On average, at least 500 people die of bodaboda accidents annually accounting for about 14-16% of total number of road fatalities. In 2012 for instance, deaths emanating from bodaboda accidents were 415. High accident rates can be attributed to lack of knowledge of highway codes, carrying more than one passenger (as prescribed by the law), improper overtaking, failure to comply with safety regulations and speeding. With these accidents, the socio-economic loss is huge especially in health and labour sectors. Overall, estimates show that Kenya loses approximately 45 billion shillings excluding the actual loss of life as a result of road accidents Table 5 shows some of the notable road accidents and resultant deaths. Table 5(Part-I). Some of recent road accidents in Kenya Date/ Year
Type of accident
Where
Deaths
Injured
Jan 7, 1998
Bus plunges into Nithi River
Meru
58
42
Mar 29, 2000
Two buses collide
Kericho
74
Nov 7, 2000
Bus flew over a bridge
Meru
45
Aug 15, 2001
Minibus plunges into Mwania River
Machakos
23
Apr 14, 2007
Matatu overturns and bursts into flames
Garissa
15
Copyright © 2016 SAVAP International
www.savap.org.pk
61
e ISSN: 2223-9553 www.journals.savap.org.pk
ISSN: 2223-9944, 300
35
Academic Research International Vol. 7(1) January 2016 ____________________________________________________________________________________________________________________________________________________________________________________________________________________________________________________________________________________________________________
Table 5(Part-II). Some of recent road accidents in Kenya Date/ Year
Type of accident
Feb 4, 2012
Two mini buses collide
2012
Bodaboda accidents
Aug 29, 2013
Bus accident
Dec 24, 2013
Collision of two buses
Where
Deaths
Injured
Kisumu-Kakamega highway
26
Countrywide
415
1,984
Ntulele, Narok
42
44
MtitoAndei
18
67
Disease Outbreaks Episodes of cholera, malaria and Rift Valley fever outbreaks are reported in Kenya. HIV/ AIDS is pandemic and has been declared as a national disaster by the Kenya government. Disease outbreaks in Kenya are closely associated with extreme climates. More often than not, outbreaks occur during heavy rainfall and droughts periods. Table 6 shows some of the disease outbreaks in Kenya. Table 6. Recent incidences of disease outbreaks and their effects in Kenya Year
Where
Disaster type
Casualties
2015
21 counties in Kenya
Cholera outbreak
- 131 dead - 6529 cases reported
Cholera outbreak
- 122 dead
2008
Nyanza, western, NEP, Wajir district, Migori, Suba, Homa Bay, Siaya, Bondo, Kisii, Naivasha&Nakuru
Waterborne diseases
- 11 dead
Siaya/Suba
Cholera outbreak
- 10 dead
Countrywide
Measles outbreak
- 41 dead
Bungoma West district 2007 2006 Kacheliba and Alale Division in West Pokot
Meningitis outbreak
2005
Kitui, Makueni and Machakos
Food poisoning
2004
Makueni,Machakos, Kitui, Embu, Mbeere and Thika districts
Food Poisoning Aflatoxin
Bungoma
Leptospirosis
- 20 dead - 70 cases reported - 13 dead - 66 cases reported - 123 dead - 333 affected - 12 dead - 859 affected
Terrorism Attacks Incidences of terror attacks in Kenya are not new phenomena. However, the frequency of recent terror attacks has brought into the limelight the magnitude of the attacks. A notable sharp increase has been witnessed since the Kenya Government launched a military offensive against Al- Shabaab militants dubbed as "Operation Linda Nchi" in October 15, 2011. Like the bodaboda (motor cycle and bicycle) accidents, terror attack is now an emerging disaster. It is estimated that since 2012, the Al-Shabab terror groups have claimed lives of over 600 people in Kenya and destroying millions worth of property (Figure 10). Table 7 show some terror attacks in Kenya and fatalities caused. Copyright © 2016 SAVAP International
www.savap.org.pk
301
ISSN: 2223-9944, e ISSN: 2223-9553 www.journals.savap.org.pk
Academic Research International Vol. 7(1) January 2016 ____________________________________________________________________________________________________________________________________________________________________________________________________________________________________________________________________________________________________________
Figure 10: The 1998 bomb attack of U.S. embassy in Nairobi Table 7(Part-I). Some of the terrorism events in Kenya and their effects Date/ year
Nature of the attack
Aug 7, 1998
Al-Qaida terrorists attack U.S. embassy in Nairobi
Nov 28, 2002
Terror attack on Israel owned Paradise Hotel in Kikambala, Mombasa
None
Nov 28, 2002
Terrorists fired a missile at an Israeli Arkia Airlines jet but missed their target
None
Oct 24, 2011
Al-Shabaab launches a series of low-grade terrorist strikes in Nairobi
2
Oct 24, 2011
Attackers hurl grenade at a commuter bus stage in Nairobi
1
Oct 27, 2011 Nov 5, 2011
Causalities 15
Al-Shabaab militants attack a vehicle transporting examination material in Lafey, Mandera Two grenades hurled at the East African Pentecostal Church in Garissa town
4 2
Nov 24, 2011
Twin grenades attacks at Holiday Inn hotel and a shop in Garissa
3
Jan 11, 2012
Suspected Al-Shabaab militants kill six people in Gerille camp, Wajir District and kidnapped two government officials.
6
Mar 10, 2012
Four hand grenades hurled at Machakos bus station in Nairobi
6
July 1, 2012
Twin church attacks in Garissa town
17
Sep 21, 2013
Armed gunmen attacked the Westgate Shopping Mall in Nairobi
69
June 16, 2014
Suspected Al-Shabaab militants launched a major assault on a police station, hotels and government offices in Kenyan coast
48
Nov, 22 2014
Gunmen attacked a bus traveling from Mandera to Nairobi
28
Dec 2, 2014
Suspected Al-Shabaab militants attacked and killed a further 36 quarry workers
36
June 15, 2014
Suspected Al-Shabaab militia attack Mpeketoni village in Lamu County
50
April 2, 2015
Suspected Al-Shabaab militants attacked Garissa University College
147
Copyright © 2016 SAVAP International
www.savap.org.pk
e ISSN: 2223-9553 www.journals.savap.org.pk
ISSN: 2223-9944, 302
Academic Research International Vol. 7(1) January 2016 ____________________________________________________________________________________________________________________________________________________________________________________________________________________________________________________________________________________________________________
The most memorable attacks of our time are: the 1998 Al-Qaida terrorists attack U.S. embassy in Nairobi, the Westgate Shopping Mall in Nairobi and the Al-Shabaab militants’ attack of Garissa University College. FACTORS INFLUENCING DISASTERS IN KENYA Whereas disasters attack when least expected, the frequency of both natural and man-made disasters can be attributed to human causes. This include: increasing poverty levels, corruption, lack of political will, beliefs/ culture, lack of adequate resources and blatant ignorance of the law. The main natural factor influencing occurrence of disasters is climate change. Poverty Poverty is the spring board of all disasters in the country. A combination of falling household income, rising cost of living and poor governance have worked to escalate poverty in Kenya where about 46% live below poverty line. In Nairobi for instance, about 60% of residents live in slums with no or limited access to even the most basic services. This makes the poor the most vulnerable to disasters. To eke a living, the poor work in very dangerous environment that are prone to disasters. In most cases, they dash to accident scene with an aim of looting. For instance, the need to siphon fuel in Sachang’wan oil tanker tragedy led to loss of lives. HIV/AIDS prevalence rate is common in poverty stricken areas. A study by Huho (2005) on socio-cultural and economic impacts of floods in Budalangi revealed that, the area having a semi-arid climate, residents of the flood prone area did not want to be evacuated since they will lose on relief assistance. More so, the vulnerable poor are easily corrupted by the rich minority, particularly the politician dividing them along tribal lines. Corruption Even though corrupting is not a stand-alone cause, it cuts across all other causes increasing the frequency and severity of the disasters, may it be natural or man-made. Opinion polls in Kenya have consistently indicated corruption as the leading cause of underdevelopment. Bribing of traffic officers by rogue motorists and cyclists has largely contributed to ever increasing road accidents. Corrupt government engineers have in various occasions authorized construction of sub-standard buildings which eventually collapse. Corruption on issues of disaster management such as procurement and distribution of relief food to hunger stricken people have aggravated problem of malnutrition and starvation in drought stricken areas. Lack of political will The politics of Kenya are based along tribal lines causing hatred amongst citizen. As a result, Kenya has experienced politically instigated violence which arises every election year since 1992 with exception of 2013 elections. The worst violence occurred in 2007 where over 1300 lives were lost. Political incitement against people evacuating conservation areas have led to increased destruction of forests such as Mau. An example of such incitements was a statement by the former President Moi in 2009 that "Rain comes from the sky not forests." The aftermath of continued destruction has been increased runoff and occasional flash floods as experienced in Narok town. The former Prime Minister Raila Odinga attempts to conserve Mau forest between 2007 and 2013 were thwarted by politician from the communities to be evicted. The 2015 National Youth Service politics that led to demolition of sanitation facilities in Kibra, Nairobi is a sure way of triggering diseases.
Copyright © 2016 SAVAP International
www.savap.org.pk
303
ISSN: 2223-9944, e ISSN: 2223-9553 www.journals.savap.org.pk
Academic Research International Vol. 7(1) January 2016 ____________________________________________________________________________________________________________________________________________________________________________________________________________________________________________________________________________________________________________
Ignorance of law The major disasters associated with ignorance of law include road accidents and structural collapse. Statistics indicates that most bodaboda transport accidents result from blatant disregard of traffic rules and lack of safety regulations. Whereas it is a requirement that the rider and the passenger wear reflective jackets and helmets, over 70% of the bodaboda users do not adhere to these safety regulations. In most cases, the cyclists carry more than one passenger. Drunk driving and over speeding has been the major cause of road accidents both to motorists and cyclists. In addition, more often, there are warnings over an upcoming drought /floods given by meteorological department, but seldom do people heed. Inadequate Resources Coupled with increasing human population, low technology, inadequate infrastructure and human resource are some of the resources influencing the occurrence of disasters. During the Sinai fire tragedy for instance, limited knowledge in the management of fire disasters among the community members hampered their efforts to rescue the victims. Poor roads hindered accessibility to Sinai fire site. The tragedy was also compounded by poor coordination from the response teams. The 2009 Mau forest fire went out of control in most affected areas due to lack of firefighting equipment. In order to reduce the impacts of droughts and flooding, it is necessary to have relevant instruments that aid in early warning signs. It is important for the government to invest in modern weather forecasting instruments.
Figure 11: Firefighting using twigs in Mau forest
Beliefs and Culture Traditional beliefs and culture can be associated with some of the disasters. For instance, the practice of wife inheritance and cleansing ceremonies among some communities in Nyanza and western Kenya has led to spread of HIV/AIDS. In addition, the belief that sleeping with a virgin girl will cure HIV/AIDs has also led to new infections in Nyanza. Attachment to ancestral land has thwarted the efforts of relocate communities living in areas prone to floods in Nyanza, western and coast. Similarly, the Ogiek community living in the forest has resisted relocation by the government. Climate Change Disasters associated with extreme weather events linked to climate change account for up to 70% of all disasters in Kenya. These disasters cancel progress made on poverty reduction exposing people to disaster risks. Droughts are the most common leading to loss of livelihood source. However, only few deaths are reported emanating from droughts. This is because droughts are slow in onset and therefore people seek for coping strategies. More deaths are Copyright © 2016 SAVAP International
www.savap.org.pk
e ISSN: 2223-9553 www.journals.savap.org.pk
ISSN: 2223-9944, 304
Academic Research International Vol. 7(1) January 2016 ____________________________________________________________________________________________________________________________________________________________________________________________________________________________________________________________________________________________________________
reported as a result of floods Vis a Vis droughts. Landslides occur as a result of heavy rains and are common in central and western parts of Kenya. CONCLUSION Disasters are common occurrence in Kenya with their frequency and the number of people affected increasing. As much, as the number of the affected people can be attributed to increase in human population, human related activities have exacerbated the frequency of occurrence. Poverty is the spring board of increasing disasters as it leaves the poor citizens vulnerable to factors that trigger disasters such as corruption, political manipulation, destruction of natural resources that influences climate change, inadequate fixed and human capital to combat disasters and ignorance of set out laws. Therefore, to reduce and mitigate disasters, poverty reduction is critical. This can be achieved through elimination of corruption and embracing national values. REFERENCES [1].
Cavallini, M. Papagni, M.F., & Preis, B. F.W. (2007). Fire Disasters in the Twentieth Century. Ann Burns Fire Disasters. 20(2): 101–103.
[2].
Duran, J. (2005). Kenyan droughts: a community based approach with Microcredits. Available online at: https://www.unisdr.org/2005/campaign/docs/case-studyKenya.pdf
[3].
EM DAT (2015). Interactive graphs that show various trends and relationships within the EM-DAT data. Available online at: http://www.emdat.be/disaster_trends/index.html
[4].
GOK (2012). Kenya Post-Disaster Needs Assessment (PDNA) 2008-2011 Drought
[5].
Huber, C (2013). Five of the worst natural disasters in 2013. World Vision U.S. available online at: http://www.worldvision.org/news-stories-videos/2013-top-naturaldisasters
[6].
Huho J. M. (2005). Impact of floods on socio-cultural and economic activities in Budalangi Division, Busia District. Unpublished Masters Dissertation, Maseno university.
[7].
Josef (2013). 25 Worst natural disasters ever recorded. In list25. Available online at: http://list25.com/25-worst-natural-disasters-recorded/3/.
[8].
Kandji, S. T. (2006). Drought in Kenya: Climatic, economic and socio-political factors. New Standpoints, November-December 2006
[9].
Reliefweb (2015). The human cost of natural disasters 2015: a global perspective. Available online at: http://reliefweb.int/report/world/human-cost-natural-disasters2015-global-perspective.
[10].
Than, K (2005). Scientists: Natural Disasters Becoming More Common. Available online at: http://www.livescience.com/414-scientists-natural-disasters-common.html.
Copyright © 2016 SAVAP International
www.savap.org.pk
305
ISSN: 2223-9944, e ISSN: 2223-9553 www.journals.savap.org.pk