Academic Research International Vol. 6(5) September 2015 ____________________________________________________________________________________________________________________________________________________________________________________________________________________________________________________________________________________________________________
Linear and Nonlinear Optical Properties of Acridine Dye Doped PMMA Polymer Wurood Jaber Abed AL-Zahra1, Lazem Hassan Aboud2, Zaineb F. Mahdi3 1, 2
3
Department of Laser Physics, Babylon University, Institute of laser for Postgraduate Studies, Bagdad University, IRAQ. 2
[email protected]
ABSTRACT The single beam Z-scan technique was used to determine the nonlinear optical properties of the Acridine dye doped polymer film. The experiments were performed using Q-switched Nd: YAG laser with 532 nm wavelength. The nonlinear absorption coefficient is calculated using the open aperture Z-scan data, while its nonlinear refractive index is measured using the closed aperture Z-scan data, the closed aperture Z-scan data indicates that the sign of the refraction nonlinearity is negative, i.e. self-defocusing while the open aperture Z-scan data indicates that tow photon absorption coefficient. All the nonlinear optical parameters are linearly dependent with concentration. Keywords: Nonlinear Optics; concentration Effect; Z-Scan Technique
INTRODUCTION Nonlinear optics is the study of phenomena that occur as consequence of the modification of the optical properties of materials on interaction with intense light. Nonlinear phenomena has been studied extensively [1]. When one or more electromagnetic waves propagate in a material, the atoms and molecules oscillate not only at the frequencies of the electric field applied, but also at different combinations of those frequencies as a result of the nonlinear response of the medium. The particles of the medium are displaced from their equilibrium positions, so that positive charged particles move in the direction of the electric field, while the negative charged particles move in the direction opposite to the direction of the applied electric fields. Dipole moments are created because of the displacement between positive and negative charged particles, and the dipole moment per unit volume describes the induced polarization of the medium. When the applied electric fields are sufficiently small, the electric polarization is approximately linearly proportional with the applied electric field E P = χ .E …………… (1) Where χ is the electric susceptibility tensor. This is the case of linear optics. However, when the applied electric fields are high enough, the induced polarization has a nonlinear dependence on these electric fields and can be expressed as a power series with respect to the electric field: P = χ (1) .E + χ(2) . EE + χ(3).EEE …………… (2) P = P(1) + P(2) +P(3) …………… (3) Where χ (1) is the linear susceptibility, χ(2) is the second order nonlinear susceptibility, and χ(3) is the third order nonlinear susceptibility [2].
Copyright © 2015 SAVAP International
www.savap.org.pk
1
ISSN: 2223-9944, eISSN: 2223-9553 www.journals.savap.org.pk
Academic Research International Vol. 6(5) September 2015 ____________________________________________________________________________________________________________________________________________________________________________________________________________________________________________________________________________________________________________
Acridine dye is used as active medium for dye lasers, it is molecular formula is C13H9N and molecular weight is 179.22 g mol−1 also have melting point 107 0 C while it has absorption maximum at 390 nm [3]. It is also known by the names of dibenzopyridine, 2, 3, 5, 6dibenzopyridine and 10-azaanthracene. Acridine has an irritating odor [4].The structure of Acridine dye is shown in Figure (1).
Figure 1. Acridine Dye Structure [3]
EXPERIMENTAL WORK Dye doped polymer films were fabricated by casting block method, the concentrations are (1x10⁻³, 5x10⁻⁴, 1x10⁻⁴ and 5x10⁻⁵) Ml. The solution of the polymer is prepared by dissolving the required amount of polymer (7 gm in 100 ml of chloroform solvent). A desired amount of dye solution was added to polymer solution and stirred by a magnetic stirrer at room temperature to get a uniform mixture. Films were shaped by drying the mixed polymer dye solution on a glass block at room temperature 250 C. Flow diagram of fabrication dye doped polymer film is shown in Figure (2).
Figure 2. Acridine Dye Doped PMMA at Different Concentrations (a = 1x10⁻³, b = 5x10⁻⁴, c = 1x10⁴ , d= 5x10- 5, and e= PMMA)Ml
Figure (3) shows the experimental z-scan set up. It consists of a 30 ns Q-switched Nd: YAG laser operating at 1064 nm wavelength with Copyright © 2015 SAVAP International
www.savap.org.pk
2
ISSN: 2223-9944, eISSN: 2223-9553 www.journals.savap.org.pk
Academic Research International Vol. 6(5) September 2015 ____________________________________________________________________________________________________________________________________________________________________________________________________________________________________________________________________________________________________________
energy of 20 mJ. Laser pulse energy was measured by the (DPSS 1830C) detector. The laser beam passes through a lens of 10 cm focal length. Sample was moved through the beam waist of laser beam along the z axis distance using a translating stage.
Figure 3. Experimental set-up for Z-scan
RESULTS AND DISCUSSION The Linear Optical Properties Absorption Spectra The absorption spectra of Acridine dye at the concentrations (5x10⁻⁵, 1x10⁻⁴, 5x10⁻⁴ and 1x10⁻³) Ml after doped by PMMA polymer was shown in Figure (4).
Figure 4. UV-VIS Absorption Spectrum of the Acridine Dye Doped PMMA Polymer
From Figure (4), absorption peaks are (376, 378, 379 and 385) nm at different concentrations (5x10⁻⁵, 1x10⁻⁴, 5x10⁻⁴ and 1x10⁻³) Ml respectively also shifted toward the longer wavelengths with increasing concentrations. This shift was overall obtained due to the increasing number of molecules per volume unit at high concentration, this in turn lead to change in energy levels result in effect of vibration field on molecules. Therefore, absorbance increased with increasing concentration.
Copyright © 2015 SAVAP International
www.savap.org.pk
3
ISSN: 2223-9944, eISSN: 2223-9553 www.journals.savap.org.pk
Academic Research International Vol. 6(5) September 2015 ____________________________________________________________________________________________________________________________________________________________________________________________________________________________________________________________________________________________________________
Transmission Spectra The transmission spectra of Acridine dye at concentrations (5x10⁻⁵, 1x10⁻⁴, 5x10⁻⁴ and 1x10⁻³) Ml after doped PMMA polymer were shown in Figure (5).
Figure 5. UV-VIS Transmittance Spectrum of the PMMA after the addition different Concentrations of Acridine Dye
Transmission values at 532 nm are (80,77,73 and 68)% at (5x10⁻⁵, 1x10⁻⁴, 5x10⁻⁴ and 1x10- ) Ml respectively. Transmission values in this case decreased with increasing concentration. The linear absorption coefficient (αo) and linear refractive index (no) obtained from eq. (4), eq. (5) The linear refractive index and linear absorption coefficient of acridine dye listed in Table (1) [5] .
Where t is the thickness of sample, and T is transmission Acridine dye doped PMMA at 532nm, the linear absorption coefficient (αo) and linear refractive index (no) were determined for Acridine dye doped PMMA at 532nm. These values are summarized in Table (1). Table 1. Linear Absorption Coefficient and Linear Refractive Index of Acridine Dye Doped PMMA Concentration Ml
α cm-1
no
5x10⁻⁵
13.9
2
1x10⁻⁴
15.6
2.11
5x10⁻⁴
18.5
2.3
1x10⁻³
22.2
2.54
Copyright © 2015 SAVAP International
www.savap.org.pk
4
ISSN: 2223-9944, eISSN: 2223-9553 www.journals.savap.org.pk
Academic Research International Vol. 6(5) September 2015 ____________________________________________________________________________________________________________________________________________________________________________________________________________________________________________________________________________________________________________
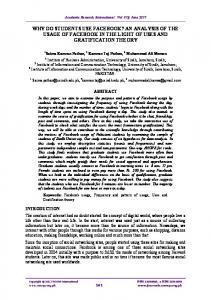
The Nonlinear Optical Properties The Nonlinear Refractive Index Acridine dye solution doped PMMA polymer at the concentrations (5x10⁻⁵, 1x10⁻⁴, 5x10⁻⁴ and 1x10³) Ml, the closed aperture measurements were shown in Figure (6) at wavelength 532 nm.
Figure 6. Closed-Aperture of Acridine Dye Doped PMMA at different Concentrations
In Figure (6), the nonlinear region was extended from -1.5 cm to 1.5 cm and the transmittance difference between peak and valley, ∆p-v at concentrations (5x10⁻⁵, 1x10⁻⁴, 5x10⁻⁴ and 1x10⁻³) Ml equals to (0.31, 0.46, 0.54 and 0.63) respectively. Also high transmission was 1 and small transmission was 0.37 at concentration 1x10⁻³ Ml. Acridine dye doped PMMA polymer indicates that the sign of the refraction nonlinearity is negative, i.e. self-defocusing observed in this figure In order to describe the z-scan behavior in the previous figures. When the sample moves far from the focus, the transmitted beam intensity is low and the transmittance remains relatively constant. As the sample approaches the beam focus, intensity increases, leading to selflensing in the sample tend to collimate the beam on the aperture in the far field, increasing the measured transmittance at the iris position. If the beam experiences any nonlinear phase shift due to the sample as it is translated through the focal region, then the fraction of light falling on the detector will vary due to the self-lensing generated in the material by the intense laser beam. In this case, the signal measured by detector will exhibit a peak and valley as the sample is translated .The position of the peak and valley, relative to the z-axis, depends on the sign of the nonlinear phase shift .Where the change in the normalized transmittance from the peak of the curve to the valley (∆Tpv) is directly proportional to the nonlinear phase shift imparted on the beam. Moreover, if the beam is transmitted through the nonlinear medium the induced phase shift can also be either negative or positive accordingly when the medium is self- defocusing or self-focusing, respectively. The magnitude of the phase shift can be determined from the change in transmittance between peak and valley. After the focal plane, the self-defocusing increases the beam divergence, leading to a widening of the beam at the iris and thus reducing the measured transmittance. Far from focus (z > 0), again the nonlinear refraction is low resulting in a transmittance z-independent [6]. The nonlinear refractive indices were determined from equation (6) at 532 nm was shown in Tables (2). n2 = ΔΦο / Io Leff k …………… (6) Where ΔΦο: nonlinear phase shift Copyright © 2015 SAVAP International
www.savap.org.pk
5
ISSN: 2223-9944, eISSN: 2223-9553 www.journals.savap.org.pk
Academic Research International Vol. 6(5) September 2015 ____________________________________________________________________________________________________________________________________________________________________________________________________________________________________________________________________________________________________________
ΔΦο =ΔT/0.406 …………………………….. (7) k = 2π /λ; λ: is the wavelength of the beam. Io is the intensity at the focal spot given by Io= Ppeak /πω2ο …………………………….. (8) ωo: the beam radius at the focal point, Ppeak: the peak power given by Ppeak= E /Δt …………………………….. (9) Where E: The energy of the pulse Δt: The pulse duration. Leff: The effective length of the sample can be determined from the following formula. Leff = (1-e-αoL) /αo …………………………….. (10) Where, L: the sample length, αo: linear absorption coefficient [7]. Table 2. Nonlinear Refractive Index for Acridine Dye Doped PMMA at different Concentrations Concentrations (Ml)
n2 (cm2/GW)
5x10⁻⁵
0.0755
1x10⁻⁴
0.1073
5x10⁻⁴
0.12381
1x10⁻³
0.1419
Nonlinear Absorption Coefficient (β) To investigate the nonlinear absorption coefficient, at wavelength 532nm. Figure (7) shows open-aperture z-scan at different concentrations at 532nm.
Figure 7. Open-Aperture Z-Scan of Acridine Dye Doped PMMA at different Concentrations Copyright © 2015 SAVAP International
www.savap.org.pk
6
ISSN: 2223-9944, eISSN: 2223-9553 www.journals.savap.org.pk
Academic Research International Vol. 6(5) September 2015 ____________________________________________________________________________________________________________________________________________________________________________________________________________________________________________________________________________________________________________
Figure (7), showed the valley is larger because of effecting PMMA polymer and T min are (0.63, 0.59, 0.55 and 0.44) at the concentrations (5x10⁻⁵, 1x10⁻⁴, 5x10⁻⁴ and 1x10³) Ml. The behavior of transmittance started linearly at different distances from the far field of the sample position (-Z). At the near field the transmittance curve begins to decrease until it reaches the minimum value (Tmin) at the focal point, where Z=0 mm. Afterward, the transmittance begins to increase toward the linear behavior at the far field of the sample position (+Z). The nonlinear absorption coefficient at 532nm were determined from equation (11) was shown in Tables (3).
Where, Z: is the sample position at the minimum transmittance; m: integer. T(z): the minimum transmittance [7]. Table 3. Nonlinear Absorption Coefficients at different Concentrations of Acridine Dye Doped PMMA Concentrations (Ml)
Β (cm/GW)
5x10⁻⁵
41948.3
1x10⁻⁴
38271.2
5x10⁻⁴
35688.9
1x10⁻³
29781.5
Copyright © 2015 SAVAP International
www.savap.org.pk
7
ISSN: 2223-9944, eISSN: 2223-9553 www.journals.savap.org.pk
Academic Research International Vol. 6(5) September 2015 ____________________________________________________________________________________________________________________________________________________________________________________________________________________________________________________________________________________________________________
REFERENCES [1]
Manshad, R. K. (2013). Studing of Nonlinear Optical Properties for Organic Dye. Thesis, University of Basrah.
[2]
Abdul Lateef, A. J. (2012). Study of the Nonlinear Optical and Optical Limiting Properties of New Structres of Organic_Inorganic Materials for Photonic Applications. University of Basrah,
[3]
Collin, G. Hoke, H. (2012). Acridine. Actapolonie Pharmaceutica in Drug Research, 69(1).
[4]
Cholewiñski, G., Dzierzbicka, K., Ko³odziejczyk, A. M. (2011). Natural and synthetic acridines/acridones asantitumor Agents: Their biological activities and methods of synthesis. Pharmacoiogical Reports, 63, 305-336.
[5]
Ali, A. A. (2008). Investigation of nonlinear optical properties for laser dyes-doped polymer thin film. Thesis, University of Baghdad Institute of Laser for Postgraduate Studies.
[6]
Sheik-Bahae, M., Said, A. A., Wei, T.-H., Hagan, D. J. and Van Stryland, E. W. (1990). Sensitive Measurement of Optical Nonlinearities Using a single Beam. IEEE Journal of Quantum Electronic, 26(4), 760-769.
[7]
Al-Sarraji, I. K. (2014). Optical Properties of Prepared Nanostructure Palladium. Thesis, Institute of Laser for Postgraduate Studies, University of Baghdad.
Copyright © 2015 SAVAP International
www.savap.org.pk
8
ISSN: 2223-9944, eISSN: 2223-9553 www.journals.savap.org.pk