Tomographic Image Reconstruction Based on a Content-Adaptive
Recommend Documents
Fluorescent molecular tomographic image reconstruction based on the Green's function. Wei Zou,1,3 Jiajun Wang,1,2,3,* and David Dagan Feng2,3. 1School of ...
Tomographic image reconstruction. Developed by Henrik Turbell. Updated by Maria Magnusson and Klas Nordberg. Computer Vision Laboratory, Linköping ...
TOMOGRAPHIC RECONSTRUCTION BASED ON. FLEXIBLE GEOMETRIC MODELS. K. M. Hanson, G. S. Cunningham, G. R. Jennings, Jr., and D. R. Wolf.
Tomographic image reconstruction using the nonuniform FFT. Jeffrey A. Fessler and Bradley P. Sutton. EECS Department. BME Department. Department of ...
ABSTRACT. In this work we propose the use of a content-adaptive mesh model (CAMM) for tomographic image reconstruction. In the proposed framework, the ...
originate from separate positron-electron annihilations are mistakenly ... Neal Clinthorne for his helpful suggestions, Web Stayman for his help with the modified.
tomographic reconstruction process. Index Terms: ... what is usually done due to the discrete processing of data. ..... Fundamentals of Digital Image Processing.
The impetus for developing optical mam- ... resolved,3,5,6,11,12 and continuous-wave cw7,8 methods ... and late-arriving multiple-scattered photons are used.
University of Heidelberg, Germany, {petra,schnoerr}@math.uni-heidelberg.de ... Abstract. This work focuses on tomographic image reconstruction in.
providing a minimal-support solution. We denote the support of a vector by supp(x) := {i : xi = 0} and by x0 := #supp(x) the sparsity measure. Problem (P0) is ...
Index TermsâCT Reconstruction, Implant Imaging, Metal. Artifact Reduction ... spine surgery, knee and hip implants for joint replacements, and plates and ...
Jan 7, 2013 - Tomographic reconstruction of OH* chemiluminescence in two interacting turbulent flames. This article has been downloaded from IOPscience.
Nov 27, 2013 - The image reconstruction for electrical impedance tomography (EIT) mathematically is a typed nonlinear ill-posed inverse problem.
Sep 24, 2014 - Lei Liu,1 Jingwen Yan,2 Di Guo,3 Yunsong Liu,4 and Xiaobo Qu4 ... Correspondence should be addressed to Xiaobo Qu; [email protected].
The paper introduces a new set of basis functions, called blobs, into the field of process tomography. It also presents preliminary results of a study which.
Mar 3, 2010 - Abstract A constrained algebraic reconstruction tech- nique (CART) is proposed for the tomographic recon- struction of the ionospheric electron ...
Métodos de Reconstrucción Volumétrica Algebraica de Imágenes Tomográficas. [16] Paige C. C. and Saunders M. A., 1982. LSQR: An Algorithm for Sparse ...
The application of compressed sensing is investigated in cardiac CT image ... In general signal processing, the first step is to sample and convert the analog ...
Sep 4, 2013 - long to this class of âhardâ problems [22]) were consid- ered, namely .... ble and robust image recovery from noisy data based ... disk D. In that case, i ranges from 1 to N2, but for ...... and was run on a standard laptop computer
describes the unknown shape and the reconstruction is computed with a maximum a ... Keywords: Bayesian analysis, tomographic reconstruction, geometrical ...
Plasma Tomographic Reconstruction from Tangentially Viewing Camera with. Background Subtraction. M. Odstr cil. *. University Southampton, Southampton ...
Abstract. Tomographic reconstruction from noisy projections do not yield adequate results. Math- ematically, this tomographic reconstruction represents an ...
On the tomographic reconstruction resolution from compressive holography. Yair Rivenson1, Adrian Stern2 and Joseph Rosen1. 1Department of Electrical and ...
AbstractâThis paper presents comparative study and experimentation of Algebraic Reconstruction Technique (ART) and Filter Back Projection (FBP). The ART ...
Tomographic Image Reconstruction Based on a Content-Adaptive
AbstractâIn this paper, we explore the use of a content-adap- tive mesh model (CAMM) for tomographic image reconstruction. In the proposed framework, the ...
202
IEEE TRANSACTIONS ON MEDICAL IMAGING, VOL. 23, NO. 2, FEBRUARY 2004
Tomographic Image Reconstruction Based on a Content-Adaptive Mesh Model Jovan G. Brankov, Member, IEEE, Yongyi Yang*, Senior Member, IEEE, and Miles N. Wernick, Senior Member, IEEE
Abstract—In this paper, we explore the use of a content-adaptive mesh model (CAMM) for tomographic image reconstruction. In the proposed framework, the image to be reconstructed is first represented by a mesh model, an efficient image description based on nonuniform sampling. In the CAMM, image samples (represented as mesh nodes) are placed most densely in image regions having fine detail. Tomographic image reconstruction in the mesh domain is performed by maximum-likelihood (ML) or maximum a posteriori (MAP) estimation of the nodal values from the measured data. A CAMM greatly reduces the number of unknown parameters to be determined, leading to improved image quality and reduced computation time. We demonstrated the method in our experiments using simulated gated single photon emission computed tomography (SPECT) cardiac-perfusion images. A channelized Hotelling observer (CHO) was used to evaluate the detectability of perfusion defects in the reconstructed images, a task-based measure of image quality. A minimum description length (MDL) criterion was also used to evaluate the effect of the representation size. In our application, both MDL and CHO suggested that the optimal number of mesh nodes is roughly five to seven times smaller than the number of projection bins. When compared to several commonly used methods for image reconstruction, the proposed approach achieved the best performance, in terms of defect detection and computation time. The research described in this paper establishes a foundation for future development of a (four-dimensional) space-time reconstruction framework for image sequences in which a built-in deformable mesh model is used to track the image motion. Index Terms—EM algorithm, emission tomography, image reconstruction, mesh modeling, SPECT.
I. INTRODUCTION
M
ESH modeling of an image involves partitioning the image domain into a collection of nonoverlapping (generally polygonal) patches, called mesh elements, defined by their vertices called nodes. In a mesh model, the image function is determined over each element by interpolation based on the values at the nodes. Mesh modeling is an efficient and compact method for image representation and is an effective tool for both rigid and nonrigid motion tracking in image sequences. As a result, mesh modeling has recently found many important Manuscript received August 6, 2003; revised October 22, 2003. This work was supported in part by the National Institutes of Health (NIH) under Grant HL65425 and in part by the Whitaker Foundation. The Associate Editor responsible for coordinating the review of this paper and recommending its publication was J. Fessler. Asterisk indicates corresponding author. J. G. Brankov and M. N. Wernick are with the Department of Electrical and Computer Engineering, Illinois Institute of Technology, Chicago, IL 60616 USA. *Y. Yang is with the Department of Electrical and Computer Engineering, Illinois Institute of Technology, 3301 South Dearborn Street, Chicago, IL 60616 USA (e-mail: [email protected]). Digital Object Identifier 10.1109/TMI.2003.822822
applications in image processing, including image compression [1]–[3], motion tracking and compensation [4]–[8], image processing through geometric manipulation [9], and medical image analysis [10]. In this paper, we investigate tomographic image reconstruction based on a content-adaptive mesh model (CAMM) developed in our previous work [11], [12]. The CAMM is an image representation based on nonuniform sampling, in which the samples (mesh nodes) are placed automatically so that their spatial density varies in relation to the degree of local image detail. When using a CAMM image representation, tomographic reconstruction can be performed by estimating the values of the mesh nodes from the observed data. The use of a CAMM for image reconstruction may have several potential benefits. First, a CAMM is a compact image representation, i.e., an image can often be represented using far fewer mesh nodes than pixels. The problem of reconstructing an underlying continuous function from a finite number of projections is ill-posed. A CAMM provides an accurate approximation to the underlying function in a finite dimensional space with fewer unknowns (i.e., spatial samples). These unknowns are related to the projection data through a system of linear equations, which is over-determined due to the efficiency (i.e., the decreased number of spatial samples) of the CAMM, thus regularizing the inversion problem. As will be demonstrated by the experimental results, a CAMM can improve computation time and image quality. Finally, and perhaps most importantly, a CAMM serves as a natural framework for reconstruction of motion image sequences, wherein mesh elements are allowed to deform over time. The mesh model is an excellent framework for tracking motion, and can lead to substantial computational savings when applied to image sequences. We have demonstrated this capability in prior work, in which we used a CAMM for post-reconstruction spatio-temporal smoothing of image sequences [13]. Our ultimate goal is to develop a (four-dimensional) space-time reconstruction approach for image sequences, in which a built-in deformable mesh model is used to follow the curved motion trajectories. The purpose of this paper is to establish a basic framework for the proposed mesh-modeling approach for image reconstruction. In the literature, a great many methods have been developed for improving the quality of reconstructed images in tomography (see [14] for a review). Most of these methods are pixelbased, i.e., the image is represented and computed directly in a pixel basis. Some methods based on object modeling have also been described in the literature (e.g., [15]–[19]). These methods typically assume a priori a geometric model of the object being imaged. For example, generalized cylinder models were used
BRANKOV et al.: TOMOGRAPHIC IMAGE RECONSTRUCTION BASED ON A CONTENT-ADAPTIVE MESH MODEL
in [15] for image reconstruction from incomplete projections; parametric surface models were investigated in [16], [17]. In addition, spherically symmetric basis functions were used in [20], [21]. These methods have a similar philosophy to our proposed approach in that a model is used to combat the ill-posed nature of the reconstruction problem. However, to our knowledge, content-adaptive mesh modeling of images has not been used before as a basis for tomographic image reconstruction. In [22], a hybrid-grid approach was proposed in which fine-grid pixels were used in the heart region and coarse-grid pixels were used in the rest of a cardiac image, aiming to reduce computation yet preserve accuracy where it matters. While it has a similar spirit to our proposed approach, the use of a CAMM in our approach allows for truly content-adaptive and systematic placement of the image samples. The rest of the paper is organized as follows. In Section II, a mesh-model framework for image reconstruction is introduced, and the mesh-domain imaging model is derived. Reconstruction algorithms in the mesh domain, based on the expectation-maximization (EM) algorithm, the ordered-subsets EM (OSEM) method, and the maximum a posteriori (MAP) method, are presented in Section III. Some practical implementation issues are discussed in Section IV. An evaluation study of the proposed method is described in Section V, and experimental results are presented in Section VI. Finally, conclusions and future work are discussed in Section VII. The Appendix describes the numerical evaluation of mesh elements. II. MESH MODELING FRAMEWORK FOR IMAGE RECONSTRUCTION
203
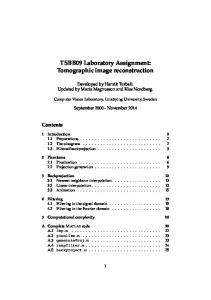
Fig. 1. Mesh modeling of an image involves partitioning the image domain into a collection of nonoverlapping (generally polygonal) patches, called mesh elements (here triangles are used); the image function is then determined over each element through interpolation from the mesh nodes of the elements. The contribution of a node to the image is limited to the extent of those elements attached to that node. With a mesh model, one can strategically place the mesh nodes most densely in regions containing significant features, resulting in a more compact representation of the image than a pixel representation.
For the remainder of the paper, we simplify the notation by using lexicographic ordering to obtain a single index for the mesh nodes, with the understanding that any given mesh node is typically shared among several elements. Using this notation, the mesh representation in (1) can be extended over the whole image domain as follows: (2)
A. Mesh Representation of Images Let denote an image function defined over a domain , which in our problem can be two-dimensional (2-D) or three-dior . In a mesh model, mensional (3-D), i.e., is partitioned into nonoverlapping mesh elethe domain ments, denoted by , so that (see Fig. 1). In practice, polygonal elements (such as triangles or quadrangles) or polyhedral elements are usually used in mesh models because of the geometric simplicity and ease of manipulation of these shapes. is represented by interpoIn a mesh model, the function from the values of its nodes. Speciflation over each element the function is represented as ically, at each point (1) where is the number of nodes defining is the location is the interpolation basis function of the th node of associated with this node, and is the interpolation error. are called shape In the field of finite-element analysis, functions. In practice, computation over individual elements is often carried out through the use of a standard shape, called the master element, to simplify calculations. We use triangular elements in this work; the details of evaluation of triangular elements are given in the Appendix.
where
is the sum of the interpolation basis functions corresponding to the elements attached to node . is strictly limited to these Consequently, the support of elements. When written as in (2), it is apparent that the mesh representation is an image description based on nonuniform sampling, wherein the mesh nodes are the sample points. Therefore, it is evident that the mesh elements (and, thus, the nodes) should be placed strategically according to the local content of the image, with samples arranged most densely in areas having the most image detail. Such placement results in a compact representation of the image determined by a relatively small number of mesh nodes. In our previous work [11], [12], we proposed a fast algorithm, based on a simple halftoning procedure, that can generate a very accurate CAMM representation of an image (in terms of both peak and mean-squared approximation errors [12]). Herein, we use this method as part of an approach to tomographic image reconstruction (Section IV.A). Before concluding our introduction of the mesh model, let us introduce some notation to facilitate subsequent development of denote a vector formed from the the proposed method. Let nodal values of the mesh model (the subscript “m” stands for “mesh”), i.e., (3)
204
IEEE TRANSACTIONS ON MEDICAL IMAGING, VOL. 23, NO. 2, FEBRUARY 2004
where the superscript denotes transposition. Similarly, let denote a vector formed from the interpolation basis functions, i.e.,
As we will demonstrate later, a CAMM can provide a very accurate image representation, therefore, the interpolation error in (12) is negligible compared to the imaging noise. Thus, neglecting , we obtain a familiar linear imaging model in the mesh domain
(4) Then, (2) can be rewritten as
(13) (5)
Now let us relate the mesh-model representation to a conventional pixel representation. Letting denote a vector formed by lexicographic ordering of the pixel values representing the , we rewrite (5) as follows: image (6) where
is a matrix in which each row consists of the vector evaluated at a particular pixel location in the image, and is a similarly obtained vector representation of the error . Equation (6) represents the interpolation operation from a mesh representation to a pixel representation .
B. Mesh Tomography Model Now we frame the tomography problem in terms of the mesh model introduced above. In tomographic imaging, the mean of the observed projection data can be modeled by (7) denotes the response of measurement to an imwhere pulse at location , and is the expectation operator. Our goal is to use a mesh model as a basis for estimation from a noisy realization of the projection data. Thus, of we require a mesh-domain imaging model to describe the data. Such a model is obtained by substituting (2) into (7) as follows:
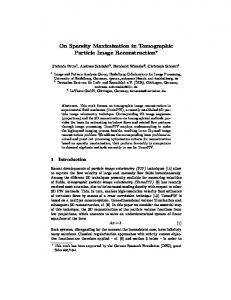
The mesh-domain system matrix relates the observed data to the mesh nodal values . In particular, for emission tomography [such as single photon emission computed tomography (SPECT)] the detector sensitivity cannot be negative; thus, all of are nonnegative. Furthermore, it is evithe elements is determined by two facdent from (9) that each element of the imaging system, tors: 1) the response functions and 2) the mesh structure that defines the interpolation func. Implementation issues related to are discussed tions in Section IV. Based on (13) the reconstruction problem becomes that of estimating from the observed data through the system matrix . The image can then be obtained by using (6) (neglecting ), as explained Section III. III. IMAGE RECONSTRUCTION ALGORITHMS USING MESH MODELING Note that the mesh-domain imaging model (13) has precisely the same form as the conventional pixel-domain imaging model. The difference between the two representations lies only in the form of the basis functions, as illustrated in Fig. 2. Therefore, existing algorithms for image reconstruction can be used directly to solve (13). In this paper, we consider maximum-likelihood (ML) [23] and MAP methods [24]. A. Maximum-Likelihood Solution ML estimation is based on solution of the following problem: (14)
(8) Defining (9) and (10) we rewrite (8) as (11) and Now we construct vectors containing all the measured data and interpolation errors, respectively, and matrix consisting of all the coefficients in (9). Then, the mesh-domain imaging model becomes simply (12)
where is the likelihood function of parameterized by . In this paper, we assume a Poisson likelihood, which characterizes emission tomography. Because the mesh-domain imaging model is identical in form to the usual pixel-domain model, the familiar form of the expectation-maximization algorithm [23] for the Poisson-noise case [25], as well as the ordered-subsets EM (OSEM) algorithm [26], can be directly applied. 1) Mesh Domain EM Algorithm: The EM algorithm for this problem has the following iterative update [25] for the estimates of the nodal values:
(15) where is the iteration index. We refer to this algorithm as MESH ML. Because the MESH ML algorithm in (15) has the same form as the familiar pixel-based EM algorithm, it shares the
BRANKOV et al.: TOMOGRAPHIC IMAGE RECONSTRUCTION BASED ON A CONTENT-ADAPTIVE MESH MODEL
205
B. Maximum a Posteriori (MAP) Solution denote a prior on the unknown nodal values Let Then, the MAP estimate is obtained as
. (17)
In this paper, we assume a Gibbs prior [24], i.e., (18) where tion
is a scalar weighting parameter, and the potential funcis quadratic (19)
In (19), denotes the index set of nodes connected to node . The MAP estimate can be computed by using the following one-step-late expectation-maximization algorithm [27]:
(20) We refer to this reconstruction algorithm as MESH MAP. IV. IMPLEMENTATION ISSUES A. Content-Adaptive Mesh Generation
Fig. 2. Illustration of a pixel model (a) and a mesh-based model (b) for the case of SPECT imaging. In a mesh model, the contribution of mesh node j to the measurement data is spatially varying, while in a pixel model all the pixels play the same role. The support of basis function (x) is limited to those elements attached to the node j .
same properties. In particular, the updated mesh nodal values in (15) always remain nonnegative, provided that their initial estimates are nonnegative. This can be readily seen are nonnegative. Anfrom (15) because all the coefficients other important property is that the total counts are conserved by the iterates generated from the MESH ML algorithm, just as they are in the pixel-based EM algorithm. This is true because of the following identity: (16) which can be derived from (15). 2) Ordered-Subset EM Algorithm: In an OSEM algorithm [26], the projection data are divided into a number of subsets, each containing multiple views. The update expression (15) is then computed iteratively over one subset at a time. OSEM has become popular because it leads to a faster computation than EM [26]. We refer to this algorithm as MESH OSEM.
For the remainder of the paper we focus on a 2-D implementation of the proposed method; however we have developed a 3-D version of the required mesh-generation step (using tetrahedrons) [28], which we will apply to the reconstruction problem in future studies. As we discussed earlier, from the viewpoint of nonuniform sampling, the mesh nodes should be placed most densely in areas of the image that contain significant details. In our previous work [11], [12], we proposed an algorithm, based on a theoretical study of the approximation error of the model, that specifically achieves this goal. The algorithm yields very accurate image representations at extremely low computational cost. In this paper, we employ our mesh-generation algorithm to construct a mesh model for the image to be reconstructed. In [11] and [12], we aimed to produce a good mesh structure for a known image. Of course, here the image to be reconstructed is not known beforehand. Therefore, for purposes of mesh genwith a reference image , eration, we replace the image the purpose of which is to provide an estimate of the distribution of the local image content, according to which the mesh nodes are then placed. A reference image can be obtained from a preliminary reconstruction of the image using a simple algorithm such as filtered backprojection (FBP). A more-sophisticated joint estimation of nodal locations and nodal values will be undertaken in future work. A further option, based on multimodality imaging [29], [30], is to use the higher resolution modality as the reference. A preliminary study of this approach was presented in a recent conference paper [31]. is obtained, the mesh is generOnce the reference image ated by the following procedure: 1) generate a feature map
206
IEEE TRANSACTIONS ON MEDICAL IMAGING, VOL. 23, NO. 2, FEBRUARY 2004
that represents the spatial distribution of the largest magnitude ; 2) apply an errorof the second directional directives of diffusion algorithm—based on the well-known Floyd-Steinberg algorithm [32]—to distribute the mesh nodes in the image domain; and 3) use Delaunay triangulation [33] to connect the mesh nodes. The resulting mesh structure consists of triangular elements that are automatically adapted to the content of the image. This approach is fast, noniterative, easy to implement, and has proven to be very accurate [11], [12]. The theoretical development of this algorithm and its justification are detailed in [12]; the details of some of these steps are further described as follows. 1) Feature Map Extraction: The feature map is comas follows: puted from the reference image
function of . By assumption, the likelihood function of given by
is
(23) in vector form. The where denotes the reference image on is suppressed in (23) for dependency of both and notational simplicity. By taking the log of the likelihood function in (23) and then and , one can obtain maximizing it over the parameters and as the ML estimates of (24) Substituting (23) and (24) into (22), one can rewrite the MDL objective function as (25)
(21) is a constant used to adjust the sensitivity of the where mesh structure to edge features in the image. The feature map in (21) is based on an approximation to the largest magniat . In practice, tude of the second directional directives of is available in a discrete pixel repthe reference image resentation. Accordingly, the feature map in (21) is computed using finite-difference approximations. 2) Placement of Mesh Nodes: The Floyd-Steinberg algorithm is a classical error-diffusion method widely used in digital halftoning [32], where the objective is to distribute ink dots adaptively in the image domain so that their spatial density varies in proportion to the image intensity. Here, we instead apply the Floyd-Steinberg algorithm to place mesh nodes with in (21). density proportional to the extracted feature map This results in an arrangement of the mesh nodes that finely samples regions having high-frequency image content. The readers are referred to [12] for more details. B. Determining the Number of Mesh Nodes The accuracy of a mesh representation depends on the number of mesh nodes used, leading to the question: What is the optimal number of mesh nodes for image reconstruction? In this paper, we apply the minimum description length (MDL) principle [34], a well-known approach to model selection, to determine the number of nodes. The MDL approach is to select, among many alternatives, the model that encodes the reference image with the minimum number of bits. In our problem, the model is the mesh representation in (6), which is specified by the mesh structure and the approximation error. in Under the assumption that the approximation error (6) is independent and identically distributed, zero-mean, and , we can write the MDL Gaussian, with unknown variance objective function as (22) is the number of mesh nodes, where and of pixels in the reference image, of and , respectively, and
is the total number are ML estimates is the likelihood
According to the MDL principle, the number of mesh nodes is determined by minimization of . As we will show, for our application, the number of mesh nodes specified by the MDL criterion agrees with the optimal number of nodes for image quality, as judged by a task-based numerical observer; therefore, MDL appears to be a good strategy for model selection. C. Computation of Mesh-Domain System Matrix Once the mesh is obtained, the mesh-domain system matrix can be computed according to (9). Recall that the interpolation function has support only over those elements attached denote the support of . Then the inteto node . Let gration in (9) reduces to (26) can be computed efficiently by Therefore, the quantity has only limited suptaking advantage of the fact that port. Indeed, the computation in (26) can be further expressed as integration over those individual elements attached to node . As discussed in the Appendix, the integration over these individual elements can be simplified through the use of a master element. When the analytical form of the response function is known, the integration in (26) can then be precalculated in a closed analytical form. This, of course, can reduce greatly the overhead associated with computing the system matrix . In this study, we simply measured the system matrix by probing the input with an impulse function. Specifically, a unit-impulse input was applied at each nodal location of the mesh model, and the response at each detector was computed. In future work, we will refine the method by developing an analytic model. V. PERFORMANCE EVALUATION STUDY A. Simulation Data The proposed CAMM-based reconstruction algorithms were tested using the 4D gated mathematical cardiac-torso (gMCAT) D1.01 phantom [35], which is a time sequence of 16 3-D images. The field of view (FOV) was 28.8 cm. Poisson noise, at a level
BRANKOV et al.: TOMOGRAPHIC IMAGE RECONSTRUCTION BASED ON A CONTENT-ADAPTIVE MESH MODEL
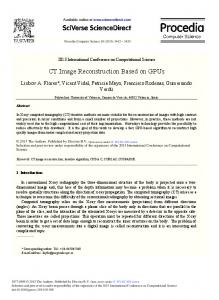
Fig. 3. Illustration of the 16 input channels, which consist of four constant-Q frequency bands with four orientations within each band, used by the CHO in the frequency domain. The four sub-images in each row are the frequency response of the four bandpass filters within a frequency band.
of 4 million total counts for the whole sequence, was introduced gated cardiacinto the projections to simulate a clinical Tc perfusion SPECT study. Our experiments were based on a single slice (no. 35) of the phantom, which has approximately 2400 counts per frame. For each frame, the projections consisted of 64 bins at 64 views over 360 , yielding a total of bins. Thus, there were an average of approximately 0.5 counts per projection bin. The system had a blur of approximately 9 mm full-width at half-maximum (FWHM) at the center of FOV. No attenuation effects were considered in the simulation, and each image frame was reconstructed separately. B. Other Methods for Comparison For comparison purposes, we included the following well-known reconstruction procedures in this study: 1) FBP; 2) pixel-based ML-EM reconstruction [23] (Pixel ML); and 3) a pixel-based MAP method [36] with a spatial Gibbs prior [24] (Pixel MAP). In addition, we considered two accelerated versions of the pixel-based algorithms: 1) ordered-subset reconstruction methods [26] for EM and MAP (Pixel OSEM, and Pixel OS-MAP); and 2) rescaled block-iterative methods for EM [37] (Pixel RBI) and MAP reconstruction [38] (Pixel RBI-MAP). These accelerated algorithms were mainly used to compare execution times, as they produce similar images to their nonaccelerated counterparts. The parameters used for the spatial Gibbs prior as in [36] are for both Pixel MAP and Pixel RBI-MAP. Note that here we are using the same notation for these parameters as in [36]. This should not be confused with any other use of these symbols elsewhere in this paper. For the accelerated OS- and RBI-type methods, we used a total of eight nonoverlapping subsets, each of which consists of projections along eight mutually orthogonal directions. C. Evaluation Methods We assessed image quality by measuring the detectability of cardiac perfusion defects in the reconstructed images. For this purpose, we consider an image to be “good” if it allows perfusion defects to be detected accurately. We used a numerical observer in place of human observers to measure
207
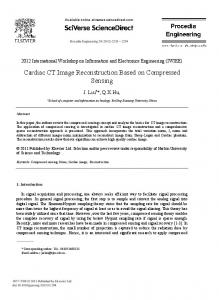
Fig. 4. Simulated perfusion defect (indicated by the arrows) introduced in the gMCAT phantom (slice #35).
detectability. Specifically, we applied a channelized Hotelling observer (CHO) [39]–[41] to detect the presence of a simulated perfusion defect. The CHO is a generalized likelihood-ratio detector, with input modeling the human visual system. It produces binary decisions, i.e., “lesion is present” or “lesion is absent” at the location of interest. In our implementation, 16 input channels were used, corresponding to four constant-Q frequency-bands with four orientations within each band. The frequency selectivity of these input channels is illustrated in Fig. 3. The CHO was applied to reconstructed images of a modified version of the gMCAT phantom having a simulated perfusion defect in the myocardium. The simulated defect was generated in the gated frames as described in [42]. In Fig. 4, we show an image of slice #35 of this frame, in which the defect regions are indicated by arrows. The CHO was applied to detect the region located in the ventricular septum (indicated by the left arrow) in this slice. The 16 input channels of the CHO were centered at this low-intensity spot. The performance of each reconstruction method was summarized using the area under the receiver operating characteristic (ROC) curve. In the ROC study, 400 noise realizations of the reconstructed images were used: 200 with the defect present and 200 with the defect absent. Finally, we will use the peak signal-to-noise ratio (PSNR) to measure the overall error between an image and its approximation (or estimate) , which is computed as follows: dB
(27)
where is the peak image value, and are the image dimensions. To evaluate the CHO and PSNR, the CAMM-reconstructed images were converted to a regular pixel representation. VI. EXPERIMENTAL RESULTS A. Mesh Generation First, we investigate the optimal number of mesh nodes based on the MDL principle. The purpose is to demonstrate that the mesh model can indeed provide an accurate representation of the image to be reconstructed (subject to the intrinsic system
208
IEEE TRANSACTIONS ON MEDICAL IMAGING, VOL. 23, NO. 2, FEBRUARY 2004
Fig. 5. Plot of the MDL function vs. the number of mesh nodes for the original image with different FWHM values.
blur). For this purpose, we used the original image, with different levels of system blur, as the reference image for mesh generation. The system blur is measured by the FWHM of the spatial response function. In Fig. 5, we show a plot of the resulting MDL function versus the number of mesh nodes. According to this plot, the MDL principle indicates that the best mesh model is obtained when the number of mesh nodes is between 800 and 1000 for the mm (i.e., one-sixth to one-quarter of case of the number of projection bins), which is close to the average system blur in this study. In this case, with 819 nodes (about one-fifth as many nodes as projection bins), the approximation accuracy of the mesh model, as measured by PSNR, was found to be 56.7 dB. Indeed, the mesh model provides a very compact and accurate representation. Next, for image reconstruction the mesh structure was estimated from the projection data. For this purpose the reference image was chosen to be a smooth FBP reconstruction of a sum of the 16 frames of data. In Fig. 6(a), we show an example of , consisting of 64 64 pixels, obtained from one particular noise realization. This image was obtained using a lowpass filter (linear-phase finite impulse response (FIR), length 12, and designed with a Hamming window) with a bandwidth of 0.15 cycles/pixel. In Fig. 6(b), we show the resulting mesh structure, constructed from 819 mesh nodes. In the mesh-generation procedure, we used in (21). As can be seen, the algorithm automatically places mesh nodes densely in the important myocardial regions, and most sparsely in the background. B. Reconstruction Results We summarize the numerical results obtained by the reconstruction methods tested in Fig. 7(a), where the area under the ROC curve, denoted by , is plotted for different number of iterations. Whenever applicable, these results were obtained for the best parametric setting (determined empirically) for each method. For MESH ML, the number of mesh nodes used was 585; for MESH MAP, the same number of mesh nodes was used,
2
Fig. 6. (a) The sum of 16 image frames (64 64 pixels) of one 2-D slice obtained from the 4D gMCAT phantom in one noise realization; (b) the mesh structure obtained for the summed image after lowpass filtering with cutoff frequency 0.15 cycles/pixel. A total of 819 mesh nodes were used. This mesh representation has PSNR = 42:8 dB.
and in (18); the parameters for Pixel RBI-MAP were as described earlier. These parameter settings were also used in subsequent results. These results suggest that the best performance was obtained by both MESH ML (at iteration 4) and MESH MAP (at iteration 8). Moreover, as expected, the MAP algorithms for both mesh and pixel outperform their ML counterparts at convergence. In addition, our experiments also demonstrate that, as judged by the CHO, the best detection performance is obtained when the number of mesh nodes is between 450 and 900 for both MESH ML and MESH MAP. This seems to be consistent with the optimum number of nodes determined earlier by the MDL principle (Fig. 5). Finally, for completeness, in Fig. 7(b) we provide a set of results obtained by Pixel ML when using different numbers of pixels. This amounts to reconstructing the image with different pixel sizes. In particular, we show the results obtained by Pixel ML when using 1024 pixels (Pixel ML-1024) and 455 pixels (Pixel ML-455), respectively. Note that, at certain numbers of iterations, the Pixel ML with 1024 pixels (Pixel ML-1024) was
BRANKOV et al.: TOMOGRAPHIC IMAGE RECONSTRUCTION BASED ON A CONTENT-ADAPTIVE MESH MODEL
209
Fig. 7. (a) The area under the ROC curve, denoted by A , obtained by different reconstruction methods, including Pixel ML (4096 pixels), Pixel RBI-MAP, MESH ML, and MESH MAP. (b) A obtained by Pixel ML with 1024 pixels (Pixel ML-1024) and 455 pixels (Pixel ML-455), respectively; for comparison, results for Pixel ML and MESH ML are also shown.
slightly better than Pixel ML (using 4096 pixels), though still worse than MESH ML. We believe that this is largely due to the smoothing inherent in use of larger pixels; similar behavior was also observed when images were evaluated using PSNR (shown in Fig. 9). In Fig. 8, we show some reconstructed images of frame 1 (slice #35) obtained by MESH ML for different numbers of mesh nodes and different numbers of iterations. These images demonstrate the effects of these two factors on the reconstructed images. As can be seen, for the same number of iterations, the reconstructed images appear to become smoother as the number of mesh nodes is decreased; also, for the same number of mesh nodes, the images become noisier as the number of iterations is increased. To establish statistical significance of the result that the proposed method performed best, we applied Fisher’s distribution-free sign test [43]. This was carried out using the following procedure: 1) Among the 400 noise realizations, we paired up (randomly) the images reconstructed when the lesion is present with those when the lesion is absent such that within each pair of images one had the lesion and the other did not, and no image appeared in more than one pair. This yielded a total
of 200 image pairs. 2) We then applied the CHO to each pair of images, and recorded the difference in their corresponding output. A larger difference implies that the lesion is more detectable in the reconstructed images. In fact, this difference corresponds to a measure of the signal-to-noise-ratio (SNR) of the defect (i.e., the signal) in the presence of reconstruction noise [39]. In the end, 200 such differences were obtained. 3) We next applied Fisher’s distribution-free sign test to compare the recorded differences obtained from the proposed methods against those from other reconstruction methods. It was found the proposed that even at a significance level method (MESH MAP) still yields a larger difference than the best case for the pixel methods. Finally, as a quantitative measure of the overall accuracy, we show in Fig. 9 a plot of the PSNR values of the reconstructed images versus the number of iterations for different methods. For consistency, the FBP images were post-filtered by a lowpass filter (linear phase FIR, length 12, and designed with a Hamming window) with a cutoff frequency of 0.35 cycles/pixel (which yielded the best PSNR results). The best PSNR results were obtained by MESH ML at around 15 iterations.
210
IEEE TRANSACTIONS ON MEDICAL IMAGING, VOL. 23, NO. 2, FEBRUARY 2004
Fig. 8. Images reconstructed by the MESH ML algorithms when different numbers of mesh nodes and different numbers of iterations are used. Results are also shown for the Pixel ML algorithm (4096 pixels).
Fig. 9. PSNR vs. the number of iterations for different reconstruction methods.
In Fig. 10, we summarize the execution time for all the methods considered. The abscissa in the plot represents the number of “effective iterations” by each algorithm, and the ordinate represents the execution time (normalized by the time of one iteration of Pixel ML). One “effective iteration” corresponds to one cycle in which every pixel in the image is updated once. For the ordered subset algorithms, 8 effective iterations represent a full cycle through the data. The overall overhead for computing both the mesh and the domain imaging matrix is equivalent to two units of execution time, shared
by all 16 gated frames. As can be seen, the MESH OSEM is approximately two times faster than the fastest pixel-based method (Pixel OSEM) at eight effective iterations, and three times faster at 16 effective iterations; also, the MESH MAP is even faster than the accelerated Pixel OSEM. Note that the MESH MAP can be further accelerated by using an RBI-type algorithm (but this was not implemented in this study). We also emphasize that in our implementation we did not make any effort to develop efficient mesh-based forward projector and backprojector algorithms, so our speed measurements
BRANKOV et al.: TOMOGRAPHIC IMAGE RECONSTRUCTION BASED ON A CONTENT-ADAPTIVE MESH MODEL
211
Fig. 10. The computation time for various reconstruction methods. The abscissa represents the number of “effective iterations” by each algorithm, and the ordinate represents the execution time (normalized by the time of one iteration of Pixel ML). Eight effective iterations correspond to a full cycle through all the projection data. Mesh algorithms gain computational advantage after a few iterations.
for the mesh method are conservative, and can probably be improved substantially. The pixel-based methods, on the other hand, benefited from the existence of fast code for forward and backprojection. VII. CONCLUSION AND FUTURE WORK In this paper, we proposed a mesh modeling approach for tomographic image reconstruction. In this approach, we first model the image to be reconstructed by a compact mesh representation. The problem of image reconstruction then becomes that of estimating the parameters of this model. A key feature in this mesh model is that it uses customized nonuniform sampling, in which samples are placed most densely in areas that contain significant detail. The imaging model was then derived based on this mesh representation, and the reconstruction algorithms were derived based on ML and MAP methods. The proposed reconstruction approach was evaluated for detection of perfusion defects in cardiac gated SPECT images, where a ROC study was performed using a CHO. Our experimental results demonstrate that the proposed approach outperforms several commonly used methods for image reconstruction in terms of image quality and computation time. In this paper, only the 2-D mesh model was used; we conjecture that the use of a fully 3-D CAMM could offer even greater advantage for image reconstruction. This is because a 3-D CAMM can further exploit the redundancy among the different 2-D slices in a volumetric image, offering a much more compact representation than in the 2-D case. Our ultimate goal is to explore the use of a deformable mesh model for reconstruction of image sequences, where the mesh structure in a CAMM is allowed to deform over time. The advantage of such an approach is that a CAMM not only provides a compact representation of the images, but also serves as an effective tool for motion tracking of the sequence.
APPENDIX NUMERICAL EVALUATION OVER MESH ELEMENTS In finite-element methods, a master element is often used to circumvent the difficulty associated with computation over mesh elements with different shapes. A master element typically has a simple geometric shape, over which function interpolation can be easily computed. The computation over an arbitrary element is carried out by first mapping it into the master element. To demonstrate the idea, let us consider the right triangle with vertices at and . For convenience, denote this element by . At a point , a function can be linearly interpolated from the three vertices of as follows: (A-1) where , and . Now consider an arbitrary triangular element the vertices of which are denoted by . The element can be mapped unto as follows:
(A-2) where and
Thus, the interpolation at a point over element can be conveniently computed by first mapping into a point through (A-2), followed by interpolation using (A-1).
212
IEEE TRANSACTIONS ON MEDICAL IMAGING, VOL. 23, NO. 2, FEBRUARY 2004
Next, consider the problem of integration of a function over , i.e., (A-3) By change of variables through the mapping in (A-2), this integration can be computed over the master element instead as (A-4) denotes the function in the mapped where coordinates. of the imaging matrix in (26). Recall the elements They can be computed by using the master element as in (A-4). More importantly, when the analytical form of the is available, we can precalculate the response function in a closed analytical form. This, of course, can elements greatly reduce the overhead associated with computing the matrix . REFERENCES [1] K. Aizawa and T. S. Huang, “Model-based image coding: Advanced video coding techniques for very low bit-rate applications,” Proc. IEEE, vol. 83, pp. 259–271, Feb. 1995. [2] F. Davoine, M. Antonini, J. Chassery, and M. Barlaud, “Fractal image compression based on Delaunay triangulation and vector quantization,” IEEE Trans. Image Processing, vol. 5, pp. 338–346, Feb. 1996. [3] L. Demaret, G. Robert, N. Laurent, and A. Buisson, “Scalable image coder mixing DCT and triangular meshes,” in Proc. IEEE Int. Conf. Image Processing, vol. 3, Vancouver, BC, Canada, Sept. 2000, pp. 849–852. [4] Y. Wang and O. Lee, “Active mesh—A feature seeking and tracking image sequence representation scheme,” IEEE Trans. Image Processing, vol. 3, pp. 610–624, May 1994. [5] Y. Altunbasak and A. M. Tekalp, “Closed-form connectivity-preserving solutions for motion compensation using 2-D meshes,” IEEE Trans. Image Processing, vol. 6, pp. 1255–1269, Sept. 1997. [6] C. Toklu, A. M. Tekalp, and A. T. Erdem, “Semi-automatic video object segmentation in the presence of occlusion,” IEEE Trans. Circuits Syst. Video Technol., vol. 10, pp. 624–629, Apr. 2000. [7] A. Nosratinia, “New kernels for fast mesh-based motion estimation,” IEEE Trans. Circuits Syst. Video Technol., vol. 11, pp. 40–51, Jan. 2001. [8] P. Hsu, K. J. R. Liu, and T. Chen, “A low bit-rate video codec based on two-dimensional mesh motion compensation with adaptive interpolation,” IEEE Trans. Circuits Syst. Video Technol., vol. 11, pp. 111–117, Jan. 2001. [9] M. A. Garcia and B. X. Vintimilla, “Acceleration of filtering and enhancement operations through geometric processing of gray-level images,” in Proc. IEEE Int. Conf. Image Processing, vol. 1, Vancouver, BC, Canada, Sept. 2000, pp. 97–100. [10] A. Singh, D. Goldgof, and D. Terzopoulos, Eds., Deformable Models in Medical Image Analysis. Los Alamitos, CA: IEEE Comput. Soc. Press, 1998. [11] Y. Yang, J. G. Brankov, and M. N. Wernick, “A fast algorithm for accurate content-adaptive mesh generation,” in Proc. IEEE Int. Conf. Image Processing, vol. 1, Thessaloniki, Greece, Oct. 2001, pp. 868–871. [12] Y. Yang, M. N. Wernick, and J. G. Brankov, “A computationally efficient approach for accurate content-adaptive mesh generation,” IEEE Trans. Image Processing, vol. 12, pp. 866–881, Aug. 2003. [13] J. G. Brankov, Y. Yang, and M. N. Wernick, “4D processing of gated SPECT images using deformable mesh modeling,” presented at the 6th Int. Meeting Fully Three-Dimensional Image Reconstruction in Radiology and Nuclear Medicine, Pacific Grove, CA, 2001. [14] R. Leahy and J. Qi, “Statistical approaches in quantitative positron emission tomography,” Statist. Computing, vol. 10, pp. 147–165, 2000. [15] Y. Bresler, J. A. Fessler, and A. Macovski, “A Bayesian approach to reconstruction form incomplete projections of a multiple object 3D domain,” IEEE Trans. Pattern Anal. Machine Intell., vol. 11, pp. 840–858, Aug. 1989. [16] G. S. Cunningham, K. M. Hanson, and X. L. Battle, “Three dimensional reconstruction from low-count SPECT data using deformable models,” in Proc. IEEE. Nuclear Science Symp., vol. 2, 1997, pp. 1469–1473.
[17] K. M. Hanson, G. S. Cunningham, G. R. Jennings, and D. R. Wolf, “Tomographic reconstruction based on flexible geometric models,” in Proc. IEEE Int. Conf. Image Processing, vol. 2, 1994, pp. 145–147. [18] D. J. Rossi and A. S. Wilsky, “Reconstruction from projections based on detection and estimation of objects,” IEEE Trans. Acoust. Speech, Signal Processing, vol. ASSP-32, pp. 886–906, 1984. [19] K. Shmueli, W. R. Brody, and A. Macovski, “Estimation of blood vessels boundaries in X-ray images,” Opt. Eng., vol. 22, pp. 110–116, 1983. [20] R. M. Lewitt, “Alternatives to voxels for image representation in iterative reconstruction algorithms,” Phys. Med. Biol., vol. 37, pp. 705–716, 1992. [21] S. Matej and R. M. Lewitt, “Efficient 3D grids for image reconstruction using spherically-symmetric volume elements,” IEEE Trans. Nucl. Sci., vol. 42, pp. 1361–1370, Aug. 1994. [22] Y. Zhang, J. A. Fessler, N. H. Clinthorne, and W. L. Rogers, “A hybrid-grid parameterization method for SPECT reconstruction,” J. Nucl. Med. (Abs. Book), vol. 36, no. 5, p. 172, May 1995. [23] A. P. Dempster, N. M. Laird, and D. B. Rubin, “Maximum likelihood from incomplete data via the EM algorithm,” J. Roy. Statist. Sect., pp. 1–38, 1977. [24] S. Geman and D. Geman, “Stochastic relaxation, Gibbs distribution, and the Bayesian restoration of images,” IEEE Trans. Pattern Anal. Machine Intell., vol. PAMI-6, pp. 228–238, 1984. [25] K. Lange and R. Carson, “EM reconstruction algorithms for emission and transmission tomography,” J. Comput. Assist. Tomogr., vol. 8, pp. 306–316, 1984. [26] H. Hudson and R. Larkin, “Accelerated image reconstruction using ordered subsets of projection data,” IEEE Trans. Med. Imag., vol. 13, pp. 601–609, Dec. 1994. [27] P. J. Green, “On use of the EM algorithm for penalized likelihood estimation,” J. Roy. Statist. Soc., ser. B, vol. 52, no. 3, pp. 443–452, 1990. [28] J. G. Brankov, Y. Yang, and M. N. Wernick, “Content-adaptive 3D mesh modeling for representation of volumetric images,” in Proc. IEEE Int. Conf. Image Processing, vol. 2, Rochester, NY, 2002, pp. II-621–II-624. [29] R. Leahy and X. Yan, “Incorporation of anatomical MR data for improved functional imaging with PET,” in Information Processing in Medical Imaging, A. C. F. Colchester and D. J. Hawkes, Eds. New York: Springer-Verlag, 1991, pp. 102–120. [30] G. Gindi, M. Lee, A. Rangarajan, and I. G. Zubal, “Bayesian reconstruction of functional images using anatomical information as priors,” IEEE Trans. Med. Imag., vol. 12, pp. 670–680, Dec. 1993. [31] J. G. Brankov, Y. Yang, M. Wernick, and R. M. Leahy, “Multi-modality tomographic image reconstruction using mesh modeling,” in Proc. IEEE Int. Symp. Biomedical Imaging: Macro to Nano, Washington, DC, 2002, pp. 405–408. [32] R. Floyd and L. Steinberg, “An adaptive algorithm for spatial gray scale,” in Tech. Dig. SID Int. Symp., 1975, pp. 36–37. [33] F. Preparata and M. Shamos, Computational Geometry—An Introduction. New York: Springer-Verlag, 1985. [34] J. Rissanen, “Modeling by shortest data description,” Automatica, vol. 14, pp. 465–471, 1978. [35] P. H. Pretorius, M. A. King, W. Xia, B. M. W. Tsui, T. S. Pan, and B. J. Villegas, “Evaluation of right and left ventricular volume and ejection fraction using a mathematical cardiac torso phantom for gated blood pool SPECT,” J. Nucl. Med., vol. 38, pp. 1528–1534, 1997. [36] D. S. Lalush and B. M. W. Tsui, “Space-time Gibbs priors applied to gated SPECT myocardial perfusion studies,” in 3D Image Rec. in Radiology, Dordrecht, The Netherlands: Kluwer Academic, 1996. [37] C. L. Byrne, “Block-iterative methods for image reconstruction from projections,” IEEE Trans. Image Processing, vol. 5, pp. 792–794, May 1996. [38] D. S. Lalush and B. M. W. Tsui, “Block-iterative techniques for fast 4D reconstruction using a priori motion models in gated cardiac SPECT,” Phys. Med. Biol., vol. 43, pp. 875–886, 1998. [39] K. J. Myers and H. H. Barrett, “Addition of a channel mechanism to the ideal-observer model,” J. Opt. Soc. Amer. A, vol. 4, pp. 2447–2457, 1987. [40] A. E. Burgess, “Comparison of receiver operating characteristic and forced choice observer performance measurement methods,” Med. Phys., vol. 22, pp. 643–655, 1995. [41] S. D. Wollenweber, B. M. W. Tsui, D. S. Lalush, E. C. Frey, K. J. LaCroix, and G. T. Gullberg, “Comparison of radially-symmetric versus oriented channel models using channelized hotelling observers for myocardial defect detection in parallel-hole SPECT,” in Conf. Rec. IEEE Nuclear Science Symp., vol. 3, 1998, pp. 2090–2094. [42] K. J. LacCroix, B. M. W. Tsui, E. C. Frey, and R. J. Jaszczak, “Receiver operating characteristic evaluation of iterative reconstruction with attenuation correction in Tc-99m Sestamibi myocardial SPECT images,” J. Nucl. Med., vol. 41, pp. 502–513, 2001. [43] M. Hollander and D. A. Wolfe, Nonparametric Statistical Methods. New York: Wiley, 1973.