Tool Sequence Optimisation Using Preferential MultiObjective Search Alexander W. Churchill
Phil Husbands
Andrew Philippides
University of Sussex Department of Informatics Falmer, Brighton BN1 9QJ
University of Sussex Department of Informatics Falmer, Brighton BN1 9QJ
University of Sussex Department of Informatics Falmer, Brighton BN1 9QJ
[email protected]
[email protected]
[email protected]
ABSTRACT
2. A MULTI-OBJECTIVE APPROACH TO TOOL SEQUENCE OPTIMISATION
This work presents a new multi-objective approach to tool sequence optimisation in end milling applications. In this way, the process planner is presented with a selection of solutions offering a good trade-off between total machining time and total tooling costs. The majority of previous research has concentrated either on optimising tool selection or machining parameters. In the presented approach, each tool in a sequence has its most important parameter, cutting speed, simultaneously optimised creating a problem with both discrete and continuous properties. The major constraint, excess material, is included as an additional objective. The problem is solved using NSGA-II with preferential search modifications to guide solutions towards the feasible region.
Tool sequences, with their related cutting speeds for each individual tool, are evaluated using three separate objectives: 𝑓! () = 𝑡𝑜𝑡𝑎𝑙 𝑚𝑎𝑐ℎ𝑖𝑛𝑖𝑛𝑔 𝑡𝑖𝑚𝑒 𝑓! () = 𝑡𝑜𝑡𝑎𝑙 𝑡𝑜𝑜𝑙𝑖𝑛𝑔 𝑐𝑜𝑠𝑡𝑠 𝑓! () = 𝑚𝑎𝑥𝑖𝑚𝑢𝑚 𝑡ℎ𝑖𝑐𝑘𝑛𝑒𝑠𝑠 𝑜𝑓 𝑒𝑥𝑐𝑒𝑠𝑠 𝑠𝑡𝑜𝑐𝑘 A simulation of a tool sequence applied to a specified part produces a set of tool paths and a 3D model of the remaining material, as described in [1,2]. 𝑓! () is calculated by dividing the length of each tool’s path by its linear travel rate. 𝑓! () is calculated by using Taylor’s Tool Life Equation to work out how much of a tool is consumed during its role in the sequence. This is then multiplied by the tool’s cost. 𝑓! () is the maximum distance from the desired geometry of any material remaining at the end of a sequence and is calculated from the 3D stock model. This is a constraint included as an objective and in the experiments below it is required to be ≤ 1mm.
Categories and Subject Descriptors I.2.8 [Artificial Intelligence]: Problem Solving, Control Methods, and Search – Heuristic Methods
Keywords EMO; CAM; NSGA-II; R-NSGA-II; Roughing; End milling
1. INTRODUCTION
Six multi-objective algorithms are tested using a part and tool library described in [2]. The base algorithm is NSGA-II (N) [3]. The others are modifications that use preferential strategies to guide search towards feasible values of 𝑓! (). These are R-NSGAII [4], NSGA-II with weighted objectives (WO), a single and multi-objective hybrid Guided Elitism (GE) [2], a novel method referred to as Precedential Objective Order Ranking (P) and a hybrid between GE and P (H). WO works using a punishment factor and multiplies 𝑓! () and 𝑓! () by 𝑓! (). R-NSGA-II uses a reference point of [500,500,0.95] corresponding to [𝑓! (),𝑓! (),𝑓! ()]. GE was introduced by the authors’ previously in [2]. 10% of solutions in the child population are automatically included in the new population using this function:
Machining is a subtractive process, involving the removal of material from an initial work piece until a desired final geometry has been produced. There are three main machining processes: drilling, turning and milling [1]. The latter can produce the most complex geometrical forms and is the subject of this work. By using combinations of tools, machining can be performed more efficiently than using a single tool. For example, larger tools can be used to remove the bulk of material, while smaller tools can follow and cut in places that the larger ones cannot reach. Typically, the formation of a tool sequence is performed by a process planner by hand, with no guarantees of being optimal. Genetic Algorithms and other optimisation methods have been successfully applied to this task and a full discussion can be found in [1].
𝑓!"#$%$ () = 𝑓! () + 𝑓! () + 𝑓! () . 10,000 In P, the user specifies an ordered list, L, of constraints and objective preferences. Each entry in the list has a corresponding epsilon value, 𝜀. In a binary tournament, two solutions, x and y are compared for each entry in the list. Starting with the first entry in L, if x has a better value than y, accounting for 𝜀, it wins in the tournament. In the opposite situation, y wins the tournament. If neither wins, we move on to the next entry in L. If L is exhausted without a winner, NSGA-II methods are used. In the experiments, L consists of one entry, 𝑓! () and its corresponding 𝜀 is 0.5mm.
With the exception of [5,7] no work reported in the literature has included machining parameters, such as depth of cut, feed and cutting speed, in tool sequence optimisation. In [7] tool sequences are restricted to two tools and in [5] only single tools are considered. This simplifies the complex combinatorial problem but at the expense of efficient tool sequences. In this work we present the first multiple tool, multi-objective tool sequence optimisation approach with the inclusion of the most important machining parameter affecting tool wear, cutting speed.
Tool sequences are represented as a list of tuples, with each tuple consisting of a pointer to a tool in the tool library and its corresponding cutting speed. As there are discrete and continuous variables, two different mutation operators are used. Discrete mutations modify the tools in the sequence and are described in [1]. Continuous mutations are applied to cutting speeds and work
Copyright is held by the author/owner(s). GECCO’13 Companion, July 6–10, 2013, Amsterdam, The Netherlands. ACM 978-1-4503-1964-5/13/07.
181
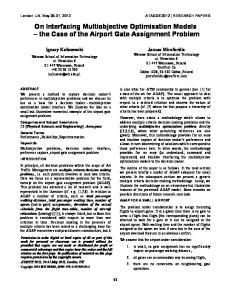
Figure 1. Empirical Attainment Function plots showing the best (red, dashed), median (green, solid) and worst (blue, dashed) surfaces attained by the algorithms. Total machining time (mins) is on the x-axis and total tooling cost (£s) is on the y-axis. N: GE: R:
P:
WO:
H:
all the others apart from the hybrid. P and WO score similarly in terms of HV, with WO performing slightly better on average. This is emulated in the EAF plots, where the median attained surface is similar but WO gets slightly closer to the left and right sides of the front. The hybrid algorithm performs the best across the board. The HV it achieves in its 1st quartile is better than the best scores achieved by any of the other algorithms. In the EAF plots it can be seen that in the median case it attains a surface very close to the Pareto front, and it covers the “knee” region especially well. The results show that this approach could be very useful to process planners, presenting them with a range of Pareto optimal solutions, from which they can make an informed decision.
by adding a random value drawn from a uniform distribution of between ± 3m/min to each value. To reduce computational costs, search was allowed to run for 500 simulations (after which the discrete operators were disabled) and 10,000 continuous function evaluations. The hybrid (H) is formed by running GE for 450 discrete evaluations and then switching to P for the rest of search.
3. EXPERIMENTAL EVALUATION The algorithms described above were tested over 1,000 trials on a cached version of the discrete space. The algorithms were assessed using the hypervolume performance indicator, which uses a reference point to calculate the hypervolume (HV) covered by solutions on the non-dominated front returned by an algorithm at the end of an evolutionary run. The point [15000,15000] is used as the reference, corresponding to [𝑓! (),𝑓! ()]. Only feasible solutions with 𝑓! () ≤ 1mm are considered in the HV calculations. Results for the algorithms can be seen in Table 1. A KruskalWallis test indicated there were significant differences and pairwise analysis with a Wilcoxan rank sum test found significant differences between all algorithms. The Empirical Attainment Function (EAF) [6] was used to evaluate the surfaces attained in the best, worst and median cases and can be seen in Figure 1.
4. REFERENCES [1] Churchill, A.W., Husbands, P. and Philippides, A. 2012. Metaheuristic approaches to tool selection optimisation. In Proceedings of the fourteenth international conference on Genetic and evolutionary computation conference (GECCO '12). ACM, New York, 1079–1086. [2] Churchill, A.W., Husbands, P., and Philippides, A. 2013. Multi-objectivization of the Tool Selection Problem on a Budget of Evaluations. In Proceedings of the 14th international conference on Evolutionary multi-criterion optimization. Springer, Berlin Heidelberg. 600-614.
Unsurprisingly, N, with its lack of constraint handling techniques, is the worst performing algorithm. Its minimum score is very low, indicating that it is unable to many feasible solutions. R performed slightly worse than the others in terms of HV, and it can be seen in Figure 1 that it is biased towards solutions on the left side of the Pareto front. This suggests that more reference points are needed to cover the whole front. Similarly, GE seems particularly good at finding a particular region near the “knee” in the center of the front. This could be seen as the most interesting point on the front and it reaches this more often on average than
[3] Deb, K., Pratap, A., Agarwal, S. and Meyarivan, T. 2002. A Fast and Elitist Multiobjective Genetic Algorithm: NSGA-II. IEEE Trans. on Evolutionary Computation, 6(2), 182-197. [4] Deb, K. and Sundar, J. 2006. Reference point based multiobjective optimization using evolutionary algorithms. In Proc. 8th Annual Conference on Genetic and Evolutionary Computation Conference (GECCO '06), 635-642. [5] Krimpenis, A. and Vosniakos, G.-C. 2008. Rough milling optimisation for parts with sculptured surfaces using genetic algorithms in a Stackelberg game. Journal of Intelligent Manufacturing. 20(4), 447-461.
Table 1. Showing the results of the Hypervolume Performance Indicator for all of the algorithms taken from 1,000 runs. All values are displayed in units of 108. N
GE
R
P
WO
H
Min
0.397
2.041
1.811
2.024
1.713
2.079
1st Quartile
1.915
2.094
2.061
2.134
2.147
2.175
Median
2.014
2.116
2.084
2.152
2.162
2.186
3 Quartile 2.085
2.143
2.107
2.158
2.171
2.19
Max
2.182
2.163
2.183
2.184
2.194
rd
2.161
[6] López-Ibáñez, M., Stützle, T., and Paquete, L. 2010. Graphical tools for the analysis of bi-objective optimization algorithms. In Proc. 12th annual conference companion on Genetic and evolutionary computation.1959-1962. [7] Spanoudakis, P., Tsourveloudis, N. and Nikolos, I. 2008. Optimal Selection of Tools for Rough Machining of Sculptured Surfaces. Proc. Int. MultiConference of Engineers and Computer Scientists, 1697 – 17.
182