Tool Support for Map Interface Design: Individual versus Collaborative Approach Hien Tran, Craig Anslow, Stuart Marshall, Alex Potanin, Mair´ ead de R´ oiste1 School of Engineering and Computer Science School of Geography, Environment and Earth Sciences Victoria University of Wellington PO Box 600, Wellington, New Zealand, 6140 Email: {Hien.Tran,Craig.Anslow,Stuart.Marshall,Alex.Potanin}@ecs.vuw.ac.nz Email:
[email protected] 1
Abstract Recent advances in computer hardware have improved support for co-located collaborative task completion, such as through large, multi-user, multi-touch tables. Software engineers need to complement these advances with improved software user interfaces that reflect any different behaviours that arise from the different interaction techniques (e.g. multi-user, multitouch tables versus single-user, single-mouse desktop computers). In this paper, we present usability observations from our experiment on a tool for online map creation that we developed. The experiment explored if and how user behaviour and task output differed depending on whether the users were collaborating around a touch table, or worked individually on a standard desktop computer. Our findings identify a number of usability issues around our tool’s software user interface, and are useful lessons for others hoping to conduct user experiments on touch table devices, especially in the broad domain of collaborative creation. Keywords: CSCW, Geographic visualization, interactive maps, map design, touch tables, user studies. 1
Introduction
Traditonal cartography relies on both art and rules to communicate geographic information to map users. Makers of a traditional, paper based map rely on the use of a number of conventions in the creation of the map. Some cartographic conventions guide the inclusion and placement of certain map elements (e.g. north arrow and scale bar) (Davis 2001). The movement to an online environment means that users also need to navigate other more interactive map elements or controls. They may need to zoom and pan or even interact with the data themselves online. The user experience of online mapping, therefore, has to contend with a larger number of variables and changing map content. Increasingly, computer users access a wide variety of maps online. Online map applications can be highly interactive, and they provide an advantage over physical maps as they can also be updated in real time. Consequently, many people that visit online map sites use a map for locating — amongst other things — places, businesses, routes, and geographical features that would not ordinarily have been possible to include collectively on physical maps (Nivala c Copyright 2011, Australian Computer Society, Inc. This paper appeared at the Australasian User Interface Conference (AUIC2011), Perth, Australia. Conferences in Research and Practice in Information Technology (CRPIT), Vol. TBC, TBC, Ed. Reproduction for academic, not-for profit purposes permitted provided this text is included.
et al. 2008). Popular online map applications such as Google Maps and MapQuest, report a staggering 42.2 million and 41.5 million unique visitors respectively for each month in 2009 (Sterling 2009). In this paper, we present Map Elements Designer (MED), a software tool that supports map element placement, records the final layouts chosen by participants, and can visualize the aggregated layouts. We also present usability observations from an experiment that used MED. Our study involved participants completing a sequence of four map element placement tasks, either individually on a desktop computer, or as a pair using a touch table. The rest of this paper is organised as follows. Section 2 covers related work. Section 3 describes our tool for placing map elements and analysing the results through visualizations. Section 4 outlines our user experiment and Section 5 presents the results. Section 6 discusses the limitations of our user experiment. Section 7 presents our conclusions and future work. 2
Related Work
There are some user studies that have focused on the use of geographic visualization tools to understand the usability, interaction, and geospatial elements. However, none of the studies have focused on how individual users or groups of users would design interactive maps. The usability of four different online mapping sites was explored by (Nivala et al. 2008) and they identified 403 different usability issues. (de R´oiste 2007) undertook a number of usability tests of local authority mapping applications and found a number of usability issues surrounding the use of online mapping in this context. (Wisniewski et al. 2009) and (Wilson et al. 2008) conducted studies to examine general interaction issues using Google Earth1 and ArcMap2 a desktop map visualization tool. They found that users need support for basic interaction behaviours to make it easier for analysis and to reduce the complexity of the interfaces. They created an initial map interaction framework to improve end user interactions through better interaction design. They suggested improving layer managements, creating techniques for easier comparing data on maps, and supporting customisations of the maps. CircleTwelve recently developed an extension to ArcView which ArcMap is part of that allows multi-user and multi-touch interactions to be used in conjunction with the DiamondTouch table (Dietz & Leigh 2001). 1 2
http://earth.google.com http://www.esri.com/products/index.html
Very few tools have looked at exploring the behaviour of users with geospatial data. GIViz (Aoidh et al. 2008) is a visualization tool for analysing user interaction behaviour with a geospatial data set. The tool captures the user’s mouse behaviour and then superimposes the information as visualizations on the spatial data similar to heat maps. Other visualizations display bar charts and over time. This tool has not be used with collaborative users nor touch tables. Another related technique to employ would be eye tracking (Nielsen & Pernice 2009). Understanding the different behaviours of users with multi-touch tables during collaborative work is a research area within Computer Supported Cooperative Work (CSCW). Some researchers have explored the design of touch table displays for colocated information visualization (Isenberg 2009) and collaborative design (Scott et al. 2004). Others have explored manipulating spatial data combining both hand and feet gestures with a multi-touch wall (Sch¨ oning et al. 2009) and a virtual 3D geospatial environment (Valkov et al. 2010). We are not aware of any user studies that have focused on users collaborating with geospatial applications for multitouch tables.
the elements are either on the map or in the trash can, then they are able to move to the next map. When all four maps are completed, the results are stored to a database for analysis. The application supports collecting the data of where each user places the map elements. 3.1.2
Touch Table (Collaborative)
We have developed Map Elements Designer (MED), a tool that enables users to control the placement of controls and cartographic elements for online maps. The underlying purpose of MED is to explore how users would choose to construct and layout online maps if given the ability to do so. One of our hypotheses was that the layout would differ depending on whether it was created by an individual user, or by a pair of collaborating users. To support this, MED was developed for use on a standard, single user desktop computer, and also a collaborative touch table. MED is a research prototype tool for experimentation, so as well as providing the core functionality for creating online maps, MED also supports subsequent analyse of how users create online maps. MED consists of the map creator and the aggregate map design visualizer.
Another version of the application was developed for a touch table. In the touch table version, the map creator application enables processing of touch events. However, only one touch event is processed at a time, in other words, the application does not support multiple concurrent actions. This single touch processing ensures that participants work together and negotiate to place a single element, whereas if people can move elements at the same time they may tend to work independently. The content of the maps is the same as the web based application. The layout of the interface is different to suit the screen size and to support pairs of users in a touch table environment. The resolution of the multi-touch table is 1024 by 768 pixels which is smaller than the design of the map creator web application which is 1200 by 650 pixels. Therefore components on the right side of the interface had to be moved and adjusted to the bottom of the application. The help box (originally in the top right corner) was moved to the bottom left corner, and the elements box was expanded horizontally and placed in the remaining bottom section. The buttons and trash can remained on the right side. The size of the maps were left unchanged as this kept the maps for both the web and touch table applications consistent. However, it was a major constraint in the possible layout combinations for the application. The buttons and selection points for the map elements were enlarged due to human fingers being the input mechanism (Apted et al. 2009). The movement of the elements box meant that both participants could equally reach elements without overextending, as opposed to the original layout where one user would be disadvantaged (all map elements on the right) (Toney & Thomas 2006).
3.1
3.1.3
3
MED: Map Elements Designer
Map Creator
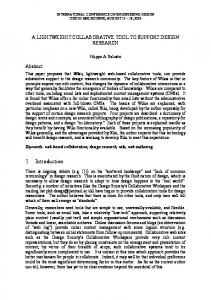
The map creator application supports web based and touch table based versions. Figure 1 illustrates some of the maps contained within the map creator application. 3.1.1
Web Application (Individual)
For our first experiment, the map creator application was embedded into a web page. The map creator application was developed in ActionScript and runs within the Adobe Flash Player. The application consists of four maps, each with specific map elements for the same geographic location. Instructions are shown at the beginning of each map. When the user proceeds, they are presented with an image of the current map, an instructions box on the top right corner, a box (map elements box) containing the different map elements with tooltips providing descriptions for each element (some elements had to be reduced in size to fit inside the box and when dragged outside they enlarge to their original size), and a trash can for discarding unwanted map elements. The user is instructed to drag whichever elements they deem suitable to a desired place on the map, with the option to discard unwanted elements. Once the user is satisfied with his/her placements and all
Design Decisions
MED did not allow users to skip to the next map unless they had placed everything, either on the map or in the trash can. This would ensure that no elements were unintentionally skipped. The trash can was introduced to force users to think about discarding unwanted elements. A message dialog appears confirming the user’s intention of deletion. Trashsed elements disappear reducing unwanted clutter. Freeing up space in the elements box would also give the user a sense of progress. Due to the time constraints with implementation, the user was not able to see or retrieve previously discarded elements out of the trash can. The only way to undo such an action was to reset all the elements which was a major drawback for the user and necessitated that the user has to rethink the placement of all the elements from scratch. The reset button allowed users to start afresh, when pressed, all the elements (including trashed elements) reset back to their original positions in the elements box. We incorporated a back button to allow users to return to previously completed maps and to change or to reflect on their decision. A brief instructions box was provided to give direction to users that skipped the initial instructions or didn’t completely understand it. Furthermore, the
descriptive instructions could be reopened with the instructions button. The elements were positioned randomly on the elements box and aligned neatly so that they would fit inside the box. Any elements that were too large for the box had to be reduced in size, this was especially evident for the last two map scenarios where the map was also a movable element. We did not find any way around this. The size of the elements were adjusted appropriately to best match the size of the content on the map. Moreover, common sizes used for elements in existing map applications, were best replicated for our elements. The application is 1200 by 650 pixels. This was to ensure that it could fit inside a web browser on most computers without compromising size. Tool tips were provided to help users identify unknown elements. If a user hovers over (with a mouse) an element when it is in the elements box, a tool tip would appear instantly identifying the element and providing a description of it. Moreover, if the element was out of the elements box there would be a one second delay before it showed up. This stopped users from getting frustrated with tool tips constantly appearing and blocking their view of the map. 3.2
Map Design Visualizer
The map design visualizer was developed to analyse the placement of elements by users. The visualizer allows us to review the placement results; either all elements, a subset of elements, or an individual element. The results are displayed using visualization techniques. Figures 4 and 5 illustrate the Heat Map and Choropleth Map visualizations. Also supported is the Graduate Symbol Map. Users can swith between the different visualization technique at any time. • Heat Map (Wilkinson & Friendly 2009) - semi transparent coloured icons of the original elements were placed for each placement result, the more overlapping elements there were, the darker the colour would get. • Choropleth Map (Heer et al. 2010, National Center for Chronic Disease Prevention and Health Promotion 2010) - commonly used to show statistical data on geographical regions, the map is split up into grid regions and a colour is used to represent the percentage of placements in that area. • Graduate Symbol Map (Heer et al. 2010) - similar to the Choropleth Map but instead of using colours a symbol such as a column bar is used to show the percentage of placements. Individual map elements can be selected to be shown using the currently selected visualization. A single click on the element triggers the visualization, the element glows with a unique colour to show that it is active. A repeat click on an active element disables the visualization. Multiple elements can be selected simultaneously. Any elements that were discarded by participants during the study are displayed as a placement on top of the trash can. Two radio buttons are provided to switch between the touch table or web study results are displayed. When the heat map visualization is active, users are able to click on a point at which single or multiple heat map elements are present. This causes all the corresponding elements from the same placement session to be displayed. This feature enables us to view the layout of corresponding elements from the position of a single specific map element. For example,
if a user placed the north arrow in the bottom right corner of the map, where would they have placed the rest of their map elements? The colours chosen for the heat map, are usually distinct for each map element, but as the number of elements grow, as it does in the last map. It was hard to find enough distinct colours, as a result, some similar colours were used. 4
User Experiment
In this section, we outline the experiment we conducted using MED. The experiment’s substantive phases were to firstly get 46 participants to individually use MED via their desktop computers, and then secondly to get 12 participants to use MED in pairs at a collaborative touch table. We developed four map scenarios for use in these phases, and ran a brief pilot study on MED’s user interface to capture and correct any immediate functional problems. 4.1
Map Scenarios
The four map scenarios used in our experiment ranged in complexity, and in their use of interactive controls. Figure 1 illustrates the different map scenarios. Interactive Map: The first is a basic interactive map displayed within a homepage of a website, see Figure 1(a). The map itself shows a particular geographic location. It also contains a significant portion of low detailed space in the form of a large water body to the top right of the map. The map elements to be placed contain interactive elements from Google Maps, such as a zoom control and a pan control. Users can also place standard map elements such as a north arrow, a scale bar, and map title. Note that this is a touch table version with controls placed at the bottom of the map other than for navigation and trash can. Non-Interactive Map: The second map shows the same homepage and map content (with different symbology) but uses a non interactive (standard static image) containing no interactive components, see Figure 1(b). For this map, the user is asked to place the following standard map elements: a legend, map title, north arrow, and scale bar. The screenshot also shows the instruction screen displayed if the user clicks the “Instructions” button. PDF Map: Many complex maps currently provided on the Internet are in PDF format. In most cases, this limits interaction with the map and data to resizing and other standard PDF controls located in the browser window. The third map is a land use planning map in PDF format which requires more detailed cartographic map elements (for example, a legend may be needed to explain the different symbology), see Figure 1(c). Unlike the first two basic maps where the location on the simulated webpage was predetermined, this scenario allows you to move the map around within the web browser, and two layout versions of the same legend map element are provided (the legend may be longer in length or in width). Map elements are resized to fit in the map elements box, and as they are dragged and dropped inside the map, the element enlarges back to its original size. The screenshot also demonstrates a tool tip identifying each element positioned by the user.
GIS Map: The final map contains the same content as the previous scenario but is shown as a highly interactive map using online GIS controls displayed inside a blank webpage, see Figure 1(d). Advanced controls such as ‘data export’ (export spatial data from the map), ‘measure’ (allows you to measure distances across map) and ‘identify’ (get information at a particular map location or feature) are included. These controls are similar to the controls provided in a desktop GIS and are available in some online interactive mapping applications. This screenshot also demonstrates the confirmation dialog when a user tries to delete an element. 4.2
Individual Map Element Design
In the first phase, the data collection program was accessed through a link, and shown inside a blank web page. Instructions were provided within the program to guide the user. When the map placement program was completed, the participant was taken to a survey on demographics and map experience as well as comments about the program. Participants used the map creator web application (§3.1.1).
(a) 1. Interactive Map (Touch Table version)
Environment and Procedure: Participants used standard desktop computers, and interaction was via a keyboard and mouse. The study was completed individually during a lab session, and took approximately 10-15 minutes to complete. Participants: 46 participants completed this experiment who were second and third year undergraduate and postgraduate GIS students. The second year and postgraduate students were enrolled in an introductory GIS course and the third year students were completing their second GIS course. Each student has created a small number of maps for coursework and are familiar with basic GIS and cartographic concepts. The mean age range was 20-29. 4.3
(b) 2. Non-Interactive Map (with Instructions Screen)
Collaborative Map Element Design
Our second phase involved participants working in pairs to complete the same map scenarios on a touch table. The participants were observed in our usability lab and used the map creator touch table application (§3.1.2). Environment and Procedure: The touch table has 1024 by 768 resolution and the screen surface physical size is 570mm by 420mm. The table top stands at 980mm height from the floor. The room is dimly lit due to the touch table’s sensitivity to light. Two microphones are positioned to the side of the table for voice recording and a video camera is elevated to a height pointing front-on towards the table, and rotated to a 45 degrees angle. This records video of the participant’s hand movements above the table. Furthermore, a direct screen capture from the touch table is also recorded to see how the application is manipulated by the participants. Each testing session is completed by a pair of participants. At the start of a session, participants are given a simple puzzle program to complete, see Figure 2. One person is instructed to wear a special red ring signifier on both hands, this is to differentiate between whose hand is which, see Figure 2(b). The puzzle seen in the photos allows the participants to familiarize themselves with the touch table in an informal environment before real testing was carried out. Once the puzzle is completed or the evaluator believes it is appropriate, participants are told that
(c) 3. PDF Map (with Element Name Tool Tip)
(d) 4. GIS Map (with Discard Confirmation)
Figure 1: Map Scenarios.
only one person can interact with the table at a time and testing begins. The evaluator may assist participants with any issues or inquires during testing, but may not provide any personal opinions on the content. Participants: There were twelve participants, with different experience and knowledge levels in GIS and cartography. The user testing comprised of novice– novice, expert–novice and expert–expert pairings. 5
Results
We now report on our results for the individual user web map creator application, collaborative user map creator application, and the map design visualizer tool. 5.1
Individual
Before we began our individual user expiriment with the map creator application, we conducted a small pilot study with four postgraduates with varying GIS expertise using MED to place elements on the four maps. Using a “think out loud” method we observed that the single user version of MED was intuitive, easy to understand and easy to use (Nielsen 1994). Although this was the case, participants suggested some minor improvements that could still be made. For example, due to the long length of the instructions text, people tended to skip this, hence it had to be shortened. Some map elements were too small and the element graphic could not be identified, hence they needed to be enlarged. Map elements should dynamically change sizes when placed on the map placement region or the elements box, this would allow users to move elements back to the elements box without compromising the available space. The program was then improved from these suggestions. 5.2
(a) Multiple Users.
(b) Red ring signifier to distinguish between user hands, worn by the user on the right.
Figure 2: Multi-touch Puzzle.
Collaborative
Our observations of the participants using the touch table highlighted a number of issues regarding the usability of the tool, and their behaviour while constructing the final layouts. Figure 3 shows a representative example of dragging objects using our touch table. Interaction: The vast majority of participants used their index or middle finger to interact with the table. Interestingly, one participant chose to use their thumb, which is not as dexturous or as comfortable as the other fingers. This participant struggled with selecting and moving elements, and their use of the thumb appears to be driven by their selection of which finger to wear the ring on when the experiment began. Usability Problems: While the application was single touch, the table itself supported (and could detect) multiple touches. This led to one interesting usability problem, whereby participants might place two fingers on the table, and the application would switch between which finger was controlling the movement of the element. This switch would typically occur if the participant accidentally released pressure on the (currently) controlling finger. In two cases, the second finger (that was not meant to be controlling movement) was over the trash can when control switched to it, causing the selected item to nearly be deleted accidentally.
(a) Map 2. Dragging an element from the elements box at the bottom of the interface.
(b) Map 2. Placing an element on the desired locaton on the map.
Figure 3: Collaborative Map Elements Design.
Positioning Elements: Five of the six participant pairs frequently revisited already placed items to make small positional changes. These small positional changes were — in the majority of cases — aimed at aligning items placed early in the process with items placed recently. The changes were also a consequence of participants finding it difficult to finely acquire the target location, especially early on. One reason for this is that there is a small delay between the finger moving on the table and the selected item following this movement. Participants took a while to learn to compensate for this delay. Order of Elements: Participants overwhelmingly placed the map view element first. This element was naturally the largest, and typically the next element placed was the map key. After that, there was no detectable order to how the remaining elements were placed, although it is worth noting that participants typically delayed selecting elements for deletion until late in the experiment. Static vs Dynamic Representation: Several of the map construction activities involved participants creating layouts for dynamic map applications. Three of the six participant pairs noted at several stages that they were confused over whether the target map was dynamic or static. This confusion was reinforced by the fact that the map view element was a single static image. Our second design principle for future map construction tools is to afford the dynamic elements (such as the map view) with some limited dynamic behaviour within the tool, so that users can see the impact of tool and data placement as the view shifts over the larger map. Deleting Items: MED supported deleting elements through a trash can metaphor. Participants did use this feature, although deletion was not easily reversible so at least one entailment of the metaphor was broken. The basket served the purpose of removing extraneous elements from the element pool, although did so at the cost of making some part of the screen unusable for placing elements. There was also the problem of accidentally deleting elements through incorrectly recognised touches, as discussed later in this section. Our third design principle is to not use a separate space for deleting items. Rather, elements could be grayed out and deactivated if not wanted so that they can’t be accidentally moved, and don’t distract from those elements that will be placed. It should be possible to reactivate elements through some other gesture, so as to support undoing of actions. 5.3
(a) Map 1. - Individual Users.
(b) Map 1. - Collaborative Users.
Figure 4: Map Design Visualizer - Heat Map
(a) Map 1. - Individual Users.
Map Design Visualizer
Having collected the map element placement information, the map design visualizer allows users to click on a map element to display its corresponding visualization, either heat map (Figure 4) or choropleth map (Figure 5)). The visualisation tool allows one to select the map elements to visualise (e.g. title, file menu, pan control, zoom control, north arrow) and then show these elements based on the individual user or touch table pairs data respectively. The heat map allows users to select multiple elements to visualize, which makes it useful for comparing between different map elements, see Figure 4. Furthermore, it is possible to toggle element visualizations on and off, and currently displayed elements
(b) Map 1. - Collaborative Users.
Figure 5: Map Design Visualizer - Choropleth Map
glow with their corresponding colour to be easily identified in the visualization. The clear option makes it easy to clear all the currently visualized elements in one click. The program allowed the user to click on an area or a heat map element to display corresponding elements from the same placement session(s) (we call this the show layout feature). This shows the entire layout of all the elements, and how users that placed something in a particular way placed their other elements. The heat map visualizes elements as their original size and shape, allowing us to picture exactly where each element was placed and the amount of space it used. However, the heat map only shows the shape of one transparent colour, and there is no option to show the actual map element. Because only one colour is used for each element, it makes it hard to tell exactly how many placements for a given map element are present in the same area. Some colour keys used for elements are lighter than others, this makes it harder to compare the density of the placements between two different elements, as a lighter colour may look less populated. When visualizing all the elements for the movable maps, its impossible to extract any valuable information. For the choropleth visualization, there are no distinctive areas to split the map into, see Figure 5. Therefore only arbitrary grid squares are used to best match the content. However this does not always accurately show the information, as the hotspots could be spread between areas. Furthermore, it was slightly problematic matching the colours to the keys, as the choropleth was overlaid over the map. The map design visualizer does not allow us to compare the placements for multiple maps at the same time. Similarly it does not allow us to compare between individual element placements and collaborative element placements at the same time. When switching maps, it does not save the state of the visualization. In the last two map scenarios (Figures 1(c) and 1(d)), the maps are movable. This makes the visualizations harder to interpret as the element placements are greatly affected in relation to the map. As a result, it is harder to detect hotspots as elements are a lot more spread. Most of the time, users want to know where an element is in relation to the map. The only way to identify this is through the show layout feature, which makes it an essential part of our analysis process. As an example of using the Map Design Visualiser, consider Figure 4. One can observe that the individual users tended to place the selected elements inside the boundaries of the map while the collaborative and negotiating users with the touch table tended to place elements outside the map area. When examining Figure 5 one can also observe that all the collaborating users decided not to place the title of the map on the map instead they put the title into the trash can. The majority of the individual users chose to place the title somewhere more useful on the map. 6
Discussion
No video or audio recording was taken of the individual user sessions. This prohibited us from seeing what element placement strategies the uers employed with the map scenarios. Nor could we contrast these strategies with the collaborative user experiment. Our collaborative user experiment was limited to six pairs of participants due to a large overhead in video recording and post processing each experiment. Our collaborative user experiment only had users working collaboratively with the touch table and not
the web based application. This was deliberate as a collaborative experiment using a keyboard driven test would require one of the two users to drive and potentially lead the experiment and the other user may not have articulated their opinions or have taken a secondary role. Given a small map (first map), people would place interactive elements outside of it on the touch table compared to inside for the web. No significant difference was observed for the other maps. 7
Conclusions
Surprisingly, in both collaborative design by a pair and in the individual user experiments the final map designs were very similar. This was in spite of the touch table causing the pairs to discuss each element placing and deal with limitations such as the physical positions of the two people relative to the map causing the participants to place elements closer to “their side” by first preference. We tentatively think that collaborative map design using a touch table will not make much difference to the resulting output. However, we found that the touch table approach does encourage a large amount of discussion that can be captured on video/audio recording and used by GIS researchers to analyse the thought processes involved when designing maps - which would be harder to achieve in a single user map design scenario. We plan to publish the actual findings regarding the map element placing in an appropriate GIS publication venue once we complete a more detailed analysis of our results. Our hope for this paper is that it leads other user interface researchers towards better user studies involving collaboration around touch tables and map interface designs. Acknowledgments This work is supported by the New Zealand Foundation for Research Science and Technology for the Software Process and Product Improvement project, and a Telstra Clear scholarship. Thanks to Roger Cliffe for assistance with the user studies. Thanks to Pippin Barr, Rilla Khaled, Jordan Hochenbaum, and Owen Vallis for technical assistance with the multitouch table. References Aoidh, E. M., Bertolotto, M. & Wilson, D. C. (2008), ‘Understanding geospatial interests by visualizing map interaction behavior’, Information Visualization 7(3), 275–286. Apted, T., Collins, A. & Kay, J. (2009), Heuristics to support design of new software for interaction at tabletops, in ‘CHI ’09 Workshop on Multitouch and Surface Computing’. Davis, B. E. (2001), GIS: a visual approach, Onword Press, New York. de R´oiste, M. (2007), The Provision of Public Planning Information and Services on the Internet by Irish Local Authorities: A User Centric Perspective, PhD thesis, Trinity College Dublin. Dietz, P. & Leigh, D. (2001), Diamondtouch: a multiuser touch technology, in ‘Proceedings of the Symposium on User Interface Software and Technology (UIST)’, ACM, pp. 219–226.
Heer, J., Bostock, M. & Ogievetsky, V. (2010), A tour through the visualization zoo, in ‘Communications of the ACM’, pp. 59–67. Isenberg, P. (2009), Collaborative Information Visualization in Co-located Environments, PhD thesis, University of Calgary. National Center for Chronic Disease Prevention and Health Promotion (2010), ‘Choropleth Map of Obesity in the United States (1995 to 2008)’, http://hci.stanford.edu/jheer/files/ zoo/ex/maps/choropleth.html. Nielsen, J. (1994), Usability Engineering, Morgan Kaufmann. Nielsen, J. & Pernice, K. (2009), Eyetracking Web Usability, New Riders Press. Nivala, A.-M., Brewster, S. & Sarjakoski, L. T. (2008), ‘Usability Evaluation of Web Mapping Sites’, The Cartographic Journal 45(2), 129–138. Sch¨ oning, J., Daiber, F., Kr¨ uger, A. & Rohs, M. (2009), Using hands and feet to navigate and manipulate spatial data, in ‘Proceedings of the International Conference Extended Abstracts on Human Factors in Computing Systems (CHI)’, ACM, pp. 4663–4668. Scott, S. D., T., M. S., Carpendale & Inkpen, K. M. (2004), Territoriality in collaborative tabletop workspaces, in ‘Proceedings of the Conference on Computer Supported Cooperative Work (CSCW)’, ACM, pp. 294–303. Sterling, C. (2009), ‘Comscore To Report Google Maps Now Number 1’, http: //searchengineland.com/comscore-toreport-google-maps-now-number-1-16570. Toney, A. & Thomas, B. H. (2006), Considering reach in tangible and table top design, in ‘Proceedings of the International Workshop on Horizontal Interactive Human Computer Systems (Tabletops)’, IEEE, pp. 57–58. Valkov, D., Steinicke, F., Bruder, G. & Hinrichs, K. H. (2010), Navigation through geospatial environments with a multi-touch enabled humantransporter metaphor, in ‘Proceedings of Geoinformatik’. Wilkinson, L. & Friendly, M. (2009), ‘The history of the culster heat map’, The American Statistician 63(2), 179–184. Wilson, D. C., Lipford, H. R., Carroll, E., Karr, P. & Najjar, N. (2008), Charting new ground: modeling user behavior in interactive geovisualization, in ‘Proceedings of the international conference on Advances in geographic information systems (GIS)’, ACM, pp. 1–4. Wisniewski, P. K., Pala, O., Lipford, H. R. & Wilson, D. C. (2009), Grounding geovisualization interface design: a study of interactive map use, in ‘CHI ’09: Proceedings of the 27th international conference extended abstracts on Human factors in computing systems’, ACM, pp. 3757–3762.