describe the tools, techniques, and results of performance ... or event potentially large) causes difficulties for monitoring systems. ..... of the Tomcat web server.
Tools and Techniques for Performance Measurement of Large Distributed Multiagent Systems Aaron Helsinger, Richard Lazarus, William Wright, John Zinky BBN Technologies 10 Moulton Street Cambridge, MA 02138, USA 1 (617) 873-8000
[ahelsing, rlazarus, wwright, jzinky]@bbn.com ABSTRACT Performance measurement of large distributed multiagent systems (MAS) offers challenges that must be addressed explicitly in the agent infrastructure. Performance data is widely distributed and voluminous, and poor data collection can impact the operation of the system itself. However, performance metrics are essential to internal system function, e.g., autonomous adaptation to dynamic environments, as well as to external assessment. In this paper we describe the tools, techniques, and results of performance characterization of the Cougaar distributed agent architecture. These techniques include infrastructure instrumentation, pluginbased instrumentation of agents, and dynamic control of metric collection. We introduce multiple redundant “channels” for metric delivery, each serving separate quality of service requirements. We present our techniques for instrumenting the agent society, justify the metrics chosen, and describe the tools developed for collecting these metrics. We also present results from distributed agent societies comprising hundreds of agents.
Categories and Subject Descriptors D.2.8 [Software Engineering]: Metrics - Performance measures; C.4 [Performance of Systems]: Measurement techniques
General Terms Management, Experimentation
Measurement,
Performance,
Design,
Keywords Multiagent systems, Adaptation, measurement, Distributed systems
Run-time
performance
1. INTRODUCTION Multiagent systems are increasingly common. These newer systems are often quite large, and distributed over wide area networks where communication and CPU resources are variable Permission to make digital or hard copies of all or part of this work for personal or classroom use is granted without fee provided that copies are not made or distributed for profit or commercial advantage and that copies bear this notice and the full citation on the first page. To copy otherwise, or republish, to post on servers or to redistribute to lists, requires prior specific permission and/or a fee. AAMAS’03, July 14–18, 2003, Melbourne, Australia. Copyright 2003 ACM 1-58113-683-8/03/0007…$5.00.
and unpredictable. To operate in such challenging environments, detailed performance measurements must be available to system designers and operators. But due to the dynamic nature of such systems, these data must also be available and tunable at run-time. Many designs for measurement systems avoid impacting the running system by permitting dynamic selection of what data is collected, how it is aggregated, and where it is transmitted. However, the requirements on this data are too varied to use a one-size-fits-all approach. Different kinds of performance data have different quality of service requirements on the data stream. By taking advantage of these differences to deliver each stream over a differently optimized delivery “channel,” we can minimize the impact of each stream on the system, without having to design for the lowest common denominator. A distinguishing feature of agent systems is their ability to reason about their environment. Multiagent systems should be able to measure their own performance and that of the environment around them to adapt and optimize their operations. Many multiagent systems have not used performance measurements internally, but this is a key feature of our architecture. In this paper, we describe our design, implementation, and experience with a performance measurement system built into the Cougaar agent architecture. This system allows system designers to collect a wide variety of performance data, deliver them using a variety of mechanisms, and build agents that reason over this data so that the agents can self-adapt to their changing environment. To better explain our intent and approach, Section 2 of this paper outlines the difficulties and requirements for performance measurement particular to large distributed multiagent systems. Section 3 outlines expected uses for performance measurements. In Section 4, we briefly introduce the Cougaar agent architecture, into which we built mechanisms to measure system performance. Our approach and tools are described in detail in Section 5, along with sample results from systems involving over 170 distinct agents running over 50 machines, followed by a comparison to related work in Section 6, and a look at future work in Section 7.
2. DIFFICULTIES POSED BY LARGE DISTRIBUTED MULTIAGENT SYSTEMS Measuring the performance of distributed systems requires care, particularly in distributed multiagent systems. Specifically, the large volumes of data involved, the increased risk of using critical network or compute resources in making measurements, and the dynamic nature of the systems, all make performance
measurement in such systems difficult. These hurdles impose unique requirements on metric collection for multiagent systems.
2.1 Voluminous Data The sheer volume of data generated by multiagent systems (multiple data sources, sending data frequently, each transmission or event potentially large) causes difficulties for monitoring systems. The transmission, processing, and storage of the data may cause an unacceptable performance hit. There may be too much data to process in a timely fashion. And analysis algorithms may not be able to handle the stream of data at all. Therefore, it is desirable to perform some local processing to reduce data volume before transmission. In addition, it must be possible to ask the precise question of interest to each performance data client, without requiring that all questions give all possible answers. Finally, the frequency of response must be as low as possible; in particular, answers must come back only when necessary to meet the needs of the user.
2.2 Coordinated Data Gathering and Retrieval Composed distributed systems require extra care in measuring system performance. Particularly when looking at multiagent systems, understanding the individual performance of each component, plus all of the communication channels, is critical to an understanding of overall system performance. To ensure accuracy, data retrieval must often be synchronized, and the results timestamped and centrally stored. However, this is expensive – requiring excessive communications bandwidth and central CPU time. Therefore, it is extremely desirable to be able to avoid the necessity of doing central processing. Additionally, it should be possible to relax the requirement for synchronized answers where synchronization is not necessary. However, in unsynchronized environments, data consistency is problematic, imposing additional requirements on data clients.
2.3 Measurements Impact Performance It is well understood that any process for measuring the performance of a system should not itself impact that performance. In multiagent systems, this requires care not to overwhelm communications resources. In addition, this requirement works against the apparent advantage of doing preprocessing of performance data local to the source – such preprocessing may steal CPU or memory from the running system. Getting the data from the system requires some computations local to the system – greater computations to reduce the volume of data transmitted. The challenge is to balance impact on the system with the expected value of the retrieved data. Therefore, multiagent systems require flexible performance measurement systems. They must be capable of locally preprocessing data where the impact on communications must be minimized. Such a system must also be configurable to disable measurements where they will not be used. In general, making the system fully configurable allows system administrators to limit system impact, and to focus it in areas where the impact will have the least overall impact on system performance.
2.4 Changing Needs and Priorities However well a performance measurement system matches expected needs, these needs may change over the life of the MAS. As their environment changes, agents are uniquely able to adapt, moving the collective distributed system in unexpected directions. A performance measurement approach must be able to adjust to changing circumstances during the operation of a system. Performance data may be used in many ways, with many different semantics. Some users want to know every time a value changes (event notification). In this case, missing a value (e.g. a spike) would be significant. But in other cases, the system wants to change a processing mode, and so avoiding such peaks is desirable. Over time however, the desired sensitivity may change, such that every change becomes important (e.g., a security system may become more sensitive to failed logins over time). Therefore, it is important that the system have a variety of “channels” through which it can access similar data, with minimal impact on the performance of the system. The system must be capable of dynamically selecting and configuring these “channels.”
2.5 Performance Measurement Requirements These various difficulties lead to a particular set of requirements for measuring system performance in a distributed multiagent system. First, the system must be capable of gathering the desired data, whatever it might be. This suggests a built-in mechanism for extensibility. Second, the system must have minimal impact on system performance. Third, the system must make the data available with the sufficient required timeliness, coordination, and accuracy, for the use for which it is intended. The system must be capable of dealing with large volumes of data. And the system must be capable of changing the data that is gathered, as new needs may arise at runtime. These requirements are better understood after characterizing the uses of performance data.
3. TYPES OF PERFORMANCE METRICS We categorize the uses of performance measurement data in a number of ways. First, by who is using the data, and secondly, by the information it imparts. Third, we classify metrics data based on the method used for its propagation: in-band or out-of-band. Finally, we identify three abstraction levels for MAS performance metrics. Together, these categories help clarify the possible delivery channels, such that all metrics and uses are served.
3.1 Data Consumer Because different consumers use metrics in different ways, the intended use of the data affects the data collection requirements.
3.1.1 Internal System Function A powerful feature of many agents is their ability to reason about their environment. To do so, agents require data about their environment. The types of measurements vary, but network load between agents is a clear example. Over the life of the system, the particular measurements of use may change. But at any given point, the agent needs a real-time and relatively trust-worthy measure of the value in question.
3.1.2 External Assessment Most performance data are used externally. System developers look at data collected “around” their system to evaluate performance in various conditions. These measurements typically focus on performance indicators such as overall time to complete
a task. Required resources must be anticipated and managed. Such data may not need to be collected in real-time, but typically require great detail, central processing and long-term storage.
3.2 Data Usage Metrics data can be put to many uses and these uses imply requirements for its collection and propagation, in the needed timeliness, precision, and completeness of the metrics data. These different uses could be ignored, and a single data source provided for all uses, but that would be inefficient, because much of the data would be unused. We use the concept of a “channel,” an implementation of a collection mechanism that meets the requirements for a subset of the clients. To see why different transmission mechanisms are needed for different functions, compare the transmission of status information with that of a particular performance variable history. At first sight, a status variable may be viewed as the value of a history at a particular time. The difference is that a history can contain additional information: for example, the length of time it is aggregated over, or from what baseline value it represents a deviation. This information would be wasted on a status variable. Maintaining unused or irrelevant data means unnecessary overhead. Furthermore, the system requirements of status and history messages are very different: typically, status is sensitive to time, while trend analysis applications are run in batch mode and can suffer delays with minimal impact. This approach entails some redundancy, since there would potentially be multiple ways of specifying and transmitting a particular value. However, this is a minor inconvenience, compared to the efficiency gained from customizing the collection and transmission to specific needs, rather than attempting to define a universally applicable, and therefore inefficient, language. Hence, we use the various categories of data use to develop distinct data transmission channels.
3.2.1 Trend Analysis After a system has run, a common usage is to look for trends in system performance. In these cases, timeliness of the data is not expected, and completeness is not a requirement. In fact, intelligent filtering of the data is often desirable. However, preserving proper ordering is important. Such log file analysis would usually be done offline, but could be done by a low priority system process to tune the multiagent system.
3.2.2 Change Notification Other uses require real-time data, but history is not useful. Automated systems can look at changes to see, for example, when a threshold has been crossed, and take appropriate actions. An event is generated and will be forwarded on to the clients of the event. The order of events is critical to the clients and events should not be lost, unless explicitly filtered. Event delivery can be delayed, to increase the chance that the event will not be lost. In the critical execution path, an event sensor only creates its event, and queues it for transfer to the clients. Event processing happens out-of-band from the critical path. Along the way from the sensor to the client, events can be filtered, copied, transferred, and correlated. One common optimization is for the sensor to test for clients of the event before generating and queuing it.
3.2.3 State Information In other circumstances, consumers need access to current performance values or system condition values, which may require integration of raw sensor data. These consumers do not need to see every sensor output, or to access complete histories, nor should each consumer compute this system state individually. Such state information is useful for internal system control, as well as real-time external assessment.
3.3 Data Management The requirements of the metrics data also drive the design of the data management scheme(s). Data transmitted from agent to agent can be sent through the existing agent communications channels. This allows the metrics collection to use the same reliability features as the agents themselves. However, it becomes difficult to separate the metrics collection from the actions of the agents. Alternatively, data can be collected outside the bounds of the MAS itself. These independent collection channels can have a smaller effect on the system being measured (while usually not eliminating the effect), but require wholly new mechanisms. One approach to metrics processing is to collect the data at a central location for analysis. This allows the analysis to find globally optimal solutions, but timeliness and scalability can be limited. Additionally, the impact on system performance is often much greater. The alternative is to maintain the metrics data in the distributed MAS, near where it is collected, and aggregate it on demand. This allows data to be immediately useful, as there is no bottleneck as with a centralized collection, but guaranteed, globally optimal solutions are not possible.
3.4 Data Abstraction Level A system can be measured at various levels of abstraction. Consumers may require any one of these. We divide metrics data into three abstraction levels. Computer system level metrics include information concerning the effects that the MAS has on the host computer systems. Data such as CPU utilization, network throughput, and memory consumption are examples of these data. System administrators may rely on these metrics. One level higher are generic agentsystem level metrics, such as message traffic, task counts, etc. These data are useful for system architects. Our highest level of abstraction is application-specific measurements, which concern data structures, central compute processes, and functional performance relative to the application requirements. These metrics, often derived from lower-level metrics, are used to determine overall system success. These requirements, and their application across these categories of metrics, have been incorporated into the design and implementation of the Cougaar agent architecture.
4. THE COUGAAR ARCHITECTURE The performance measurement tools described here are part of Cougaar, a 100% Java agent architecture for building large distributed multiagent systems, comprising around 400,000 lines of code. The prototype application uses over 170 distinct agents distributed over a 5-LAN network of over 50 machines. Cougaar was designed to support data intensive, inherently distributed applications, where application scalability is paramount. Intraagent communication is accomplished via publish and subscribe
to a local blackboard to reduce latency for tightly-coupled component interaction. Inter-agent communication transfers locally published objects to targeted recipients to allow wide distribution of loosely-coupled interactions. Communities of agents form to manage resources and provide scalable services. One innovation of Cougaar is its hierarchical component model, based on the JavaBeans API. This model provides unique security and composition properties for Cougaar agents. All internal system functions and application functions are added at configuration or run-time into a Cougaar agent as “components,” where one or more “binders” may wrap each component to mediate and secure component access to system functions. The Cougaar agent architecture has been sponsored by DARPA through the former ALP program (1996-2001) and the current Ultra*Log program (2001-2004). In addition, Cougaar is open source (www.cougaar.org) and enjoys a worldwide user community. The focus of the Ultra*Log program (www.ultralog.net) is to extend Cougaar itself to inherently ensure survivability under extremely chaotic and high-stress environments, with particular focus on security, robustness and scalability. Survivability is predicated on maintaining the highest quality of service across many dimensions based on mission or application objectives. Hence, it is essential that the agents are aware not only of their own performance, but also of the externally available resources. Cougaar has several sub-systems for measuring and acting on performance data. These include the Metrics Service, Logging Service, and Cougaar Events mechanism, all described in section 5. Each agent’s “Adaptivity Engine” can independently tune Cougaar components. Following a set of plays, the Adaptivity Engine uses input from local or remote sensors (received via message relays) to determine how to set various properties (or “operating modes”) of each system component. Higher-level system policies (set dynamically by other agents, or by a human operator) may restrict valid “plays” that the agent may enforce. In this way Cougaar agents use sensors to adapt to changes in the environment, to optimize application goals. Each Cougaar node (agent container, one per JVM) contains a Tomcat web server [7] that provides access to the agent’s blackboard to external clients such as user interfaces and status monitors. Data access is provided by servlets – dynamically loadable plugins provided by the client. These servlets have full access to agent-state and load/execute only when invoked. For example, the CSMART UI for Cougaar configuration uses servlets both for system control, and runtime monitoring. Under the Ultra*Log project, access control systems have been added as Cougaar components (binders) to limit component access to agent-internal data (restricted subscriptions), do Tomcat servlet access control, and to restrict messaging between agents. The security sub-system can both provide performance metrics, and use such metrics at runtime to tune access rules. This security system thereby dynamically controls access to performance data generated from the Cougaar tools described in this paper. These subsystems collect and use overlapping sets of performance data, but with radically different usage requirements and quality of service characteristics. Based on our experience with Cougaar, this paper motivates the need for such mechanisms in any comprehensive performance measurement framework.
5. PERFORMANCE MEASUREMENT IN COUGAAR To effectively measure the performance of a complex distributed agent-based system, multiple types of data must be delivered and processed in multiple ways, with multiple different sets of quality characteristics. The actual data or usage needed by the system or its observer often changes over time. Our approach combines these 3 facets: many data streams at multiple levels of system architecture, several different distribution channels with different quality attributes, and the ability to dynamically select among these varied choices as needs and environment changes. This approach is currently used in the Ultra*Log program to make annual assessments of the Cougaar architecture against program objectives. The baseline system used for this assessment requires planning a military logistics deployment. In this baseline society, 139 military organizations are each modeled by a distinct Cougaar agent, with multiple application management agents providing security and robustness support. These agents are distributed across 50 machines and five firewall-separated networks. A key recent addition to the application has been a set of internal sensors used by the application to adapt to changing resources. From these and other sensors, we have collected large quantities of data. These results, examples of which are provided here, give a representative sample of the powerful performance data available both for run-time adaptation and human monitoring, and for post-run analysis.
5.1 Channels – Scopes and Types of Data As we have argued, the different users of performance data, and the ways in which this data will be used, impose different requirements on the metrics collection and transmission channels. Building multiple channels results in some duplication of data, but far greater wins in overall performance. In Cougaar, we have built upon this premise, implementing multiple channels for access to the various categories of performance data. When used in combination, these channels provide a rich set of metrics for real-time and offline adaptation and analysis. The primary sensors implemented in Cougaar are sensor polling, event publishing, status dissemination, history archiving, and control actuation. Sensors are instrumentation points in the critical path of system execution. Therefore, a sensor may expend only a small effort to collect data, without impacting the performance of the system. It maintains only simple data structures, such as counters, and stores the values locally. External clients can poll the sensor’s storage to obtain a snapshot of the accumulated values. Client polling is done out-of-band from the application processing thread, and many clients may be polling the accumulated values at different rates, and for different purposes. The burden of processing and interpreting the data falls completely on the client, while the sensor remains simple, fast, and efficient. Such raw sensors are the primary channel for many of the lowlevel measurements done of computer system level and architecture level metrics. In particular, the thread service (which manages use of Java threads within Cougaar), the message transport service (which controls inter-agent communications and watches effective network load), and even the blackboard service
(for intra-agent communication) use such raw sensors with a sensor-polling channel available.
processing. Clients are responsible for polling for the results and doing any necessary aggregation or other computations.
Event sensors are also in the critical path. Events are generated when the execution of the system passes through predefined places in the code. These are used to support change notification, as described above. Cougaar generates “Cougaar Events” as one example of such sensors.
We collect network, CPU, and memory usage statistics. Perceived network throughput for each host may be used to adjust message compression. When network bandwidth is scarce, the messages are compressed; when it is plentiful, compression would waste CPU resources. A CPU- or memory-bound agent can reduce the fidelity of its processing until more compute resources are available.
Status sensors capture the current state of the system, or may predict the state of the system in the near future. These sensors use local data to summarize the state of a local component. Then the status is disseminated to all of its clients. Status calculations tend to be performed outside the critical path. Status sensors may themselves be clients of polling and event sensors, and may perform statistical functions on the raw values, such as averaging. The timely delivery of status values is more important than delivering all changes in status values. The Cougaar metrics service uses quality-of-service “contracts” (using BBN’s QuO technology [4]) to do some status calculations from raw sensors using this channel. Additionally, Cougaar uses automated “relays” of objects on one agent’s blackboard to another agent’s blackboard. When this other agent is a community manager, this is often a status channel. History or trend analysis, as motivated earlier, is a key channel in Cougaar. The history of the system brings together the locally collected instrumentation in a common storage. The clients of the history often aggregate the history records over the dimensions of time, component, and instrumentation point. Storing historical data is done completely out-of-band. This data is needed and used by load balancing processes, and security trend analysis. Finally, there is the control channel. Control moves data into the components, instead of out. The control data must be reliably delivered, with feedback to the client after acceptance. Control data is usually low volume. Clients require sufficient privileges to control a component. Also, arbitration may be required between clients wishing to control the same component. External controls tend to use synchronous calls, using primarily Cougaar servlets. Internally, the Adaptivity Engine uses blackboard relays for operating mode and policy propagation.
5.2 Abstraction Levels of Measurement The Cougaar architecture includes facilities to measure performance at the two lowest levels of abstraction described above. The application-level metrics are outside the scope of the architecture, but we will describe how application metrics are supported by the architecture and examine how they are handled in an example application.
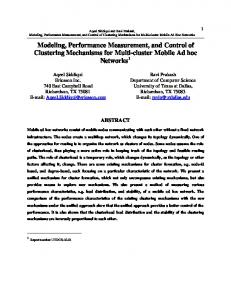
These metrics can be aggregated across communities of agents for load balancing agents across machines or allocating resources across agents on one machine. Sample statistics are in Figure 1.
5.2.2 Agent Architecture Level Instrumentation These measurements capture data intrinsic to the MAS architecture. In Cougaar, these include inter-agent messages, blackboard objects, etc. These measurements are often best captured by the services that provide the resource being measured. These metrics are used by both the internal Adaptivity Engine to optimize system performance, and by external system designers and administrators evaluating architecture performance. These metrics are examined in detail below.
5.2.2.1 Blackboard Metrics Service The key communication feature of the Cougaar architecture is the agent blackboard. Application plugins (modules) exchange and propagate information through this publish and subscribe mechanism. As with other key Cougaar services, the blackboard intrinsically calculates a set of performance metrics that are available to application and infrastructure components through the BlackboardMetricsService. As many of the blackboard objects are specific to a domain, many of the metrics that are implemented are specific to the Cougaar workflow language. These metrics are also primarily accessed via a raw sensor channel. The blackboard metrics service provides the following state information: •
Time stamps: Time stamps that indicate the publish time for blackboard objects can be maintained. This information is generated for objects of interest as indicated in the subscriptions for these objects.
•
Counts: The count of particular blackboard objects can be obtained.
•
Rates: The rate of change for particular blackboard objects can be obtained.
Table 1 lists the metrics available from this service. Table 1. Blackboard Metrics
5.2.1 Computer System Level Instrumentation
Metric
Description
These measurements are focused on the compute and network resources available to the system. Naturally, the implementation of the collection of these metrics is dependent to some degree on the host operating system. The NodeMetricsService recasts these platform-specific measurements into device-independent values.
Asset Count
The total number of “asset” objects on the local blackboard.
Plan Element Count
The total number of “plan element” objects on the local blackboard.
For example, these metrics are used by the Cougaar Adaptivity Engine to adjust the fidelity of processing or balance load to the resources available. Resources can be allocated across agent service and application processing threads. These metrics are primarily accessed via the raw sensor channel described above. They are collected within the critical loop, but with little or no
Task Count
Count of “tasks” on the local blackboard.
Object Count
Count of Objects on the local blackboard.
Custom Object Count
Count objects matching a user-specified predicate.
As security policy permits, Cougaar components may have access to this data stream.
5.2.2.2 Message Transport Metrics The Cougaar message transport service captures statistics on the messages that flow through it. These statistics can be used for real-time adaptation as well as trend analysis. They are available internally (in-band) through the message transport service and externally (out-of-band) through a Cougaar servlet. In-band, they may be used for load balancing of agents. Externally, they may be used to re-configure agent organization. Some of the metrics available from the message transport service are listed in Table 2.
Additionally, Cougaar extends the Log4J mechanism by adding an additional level for events. Because the Log4J system processes logging messages as text, these “Cougaar Events” are structured as XML documents that capture architecture level information about the event such as the agent involved, the Cougaar component involved, etc. When significant moments in application execution are noticed, these events may be published to the logging stream, as well as on the local Cougaar blackboard, where they can be used by any Cougaar component to control its behavior. For example, events in the prototype military logistics application include indications of when application initialization is complete, the mission to be planned (OPLAN) has been published, and when planning is complete.
Table 2. Message Transport Metrics Metric
Description
Queue Length
The average number of outgoing messages waiting to be sent.
Message Bytes
The total size of all messages sent.
Message Count
The number of messages sent.
These events generated from the logging service are propagated either via internal relays for use by in-band components, or using an out-of-band mechanism. This mechanism is built using a common instant-messaging protocol (Jabber [6]) that provides a low-overhead and scalable way of filtering and archiving the events. The event stream provides a way for the analyst to reconstruct the activities of the MAS offline.
5.2.2.3 Metrics Plugins There are a number of plugins that are distributed with Cougaar for the purpose of metrics collection. Some of these are used simply to query the various raw sensors described above, and log these for post-run trend analysis. For example, the CSMART module MetricsPlugin collects a configurable subset of the node, message transport and blackboard metrics described above, logging them at configurable intervals to a per-agent history file for post analysis. Other plugins may aggregate raw sensor values, making them available on the agent blackboard as status values, or relaying them to registered clients as events. For example, running our prototype society, we collected some of the compute resource metrics at one-second intervals, for one JVM. These
5.2.3 Application Level Instrumentation Although application level measurements are outside of the scope of the agent architecture by definition, the architecture can provide tools for the collection and propagation of application level metrics. Cougaar provides several mechanisms that facilitate the collection of such data. These data are primarily of use for external visibility into the workings of the MAS application, but they can also be used by the application itself to tailor its behavior. In the case of a logistics planning application, these data include measurements of the higher-level resources such as tasks and schedulable assets.
200 180
Threads Free Mem (MB) Total Mem (MB) CPU Load (%)
160 140 120
5.2.3.1 Custom Servlets
100 80 60 40 20
Seconds Figure 1. Sample Compute Resource Metrics
results were logged for post analysis, as seen in Figure 1.
5.2.2.4 Event and Logging Service The Cougaar logging service provides the primary way for events to be reported and propagated. The logging service is based on the Log4J [8] logging package, which provides several “levels” of logging that can be filtered as required. As a traditional logging service, significant events may be logged for later trend analysis, or even for run-time forensic evaluation.
460
440
412
401
393
352
325
283
226
190
183
178
167
159
72
154
9
0
0
Most Cougaar subsystems implement some custom servlets that can format blackboard data for debugging or user display. These servlets are simply Cougaar components that can also respond to HTTP (web) data requests. Servlets provide the principal out-of-band data access mechanism for Cougaar agents. These servlets have access to the full power of the Tomcat web server. As Cougaar components, they have access to the local agent blackboard, from which they can access any of the lower-level metrics services (described above), or even register aggregation agent queries (described below). If security policy permits, servlets may even be loaded dynamically at run-time (perhaps initiated by a user, or even by another part of the runtime system).
As part of the prototype application, an external GUI uses some servlets to collect blackboard objects from a specific set of agents, to generate a complete military logistics transportation plan. This query employs just a few simple servlets in each agent, and then performs out-of-band aggregation and computation to display the full data at the user desired level of detail. Cougaar also supplies a number of other servlets that may be included in a given configuration for more architecture level information. The TopologyReaderServlet accesses the
TopologyService to find the current assignment of agents to machines, allowing real-time monitoring of moving agents. Another servlet (the PlanViewServlet) allows users to easily browse the objects on the blackboard, following references to other objects crossing agent boundaries. The Completion Servlet shows counts of “Tasks” in each agent that have been completely planned, giving a useful indication of the state of the application. Finally, there are several servlets used by the Cougaar CSMART tool that allow a graphical representation of the objects on the agent blackboards, allowing users to follow the communication across agents and see the state of the overall application. Other applications can easily build their own servlets with specific knowledge of that application’s semantics.
5.3.1.1 Adaptivity Engine
5.2.3.2 Aggregation Agents
The Metrics service allows great runtime flexibility in both the data to collect and how it is collected. It employs callbacks and listeners to produce measures of various messaging statistics such as queue length, number of queues, and message delivery time. These measures are only computed if there is an interested client. Clients indicate interest by registering for these measurement services. When no clients are registered, there is no overhead for the operations of this service. In particular, the service responds directly to the requests of the clients, producing only the data requested, in the form requested.
Cougaar includes a set of components that provide the ability to receive generalized queries and respond with structured XML data. These “aggregation agents” can collect data from several other agents, combine it in an application-specific manner, and format the results as application-specific XML documents. They provide an in-band mechanism for data access that can be used for internal control or external data access. Users distribute one or more such agents throughout the society, and include the appropriate components in each other agent in the society. When needed, data can be collected at one or more points from all agents in the society, and pre-processed there before submitting the final answer to the client. When used in-band, agents submit queries, registering themselves as clients of these fixed sensors. These sensors aggregate lower level data, acting as status or event channels. For example, a security manager agent may use this to watch for security violations in the society. A load-balancing agent may watch for message queue lengths growing beyond some threshold. As these queries are registered at run-time, agents may modify their queries as conditions change, for example lowering the threshold for determining that an agent has too many messages waiting to be delivered, and needs to be relocated to get better network access. When used out-of-band, the aggregation infrastructure usually acts as an event sensor, alerting human users (e.g. security managers) to interesting run-time conditions. At other times this infrastructure is used to collect pre-filtered and aggregated history for post-run trend analysis. Users can dynamically modify the conditions that they watch for, as their interests change. Note that the aggregation agents and plugins only act when queries are registered. Additionally, data transmission and processing are distributed to minimize system impact.
5.3 Dynamic Instrumentation Control Cougaar provides the powerful capability to dynamically modify what instrumentation is in place, and how these instruments behave based on current system-state. This important capability is used to minimize the impact of instrumentation on the actively executing society, by enabling metrics only when needed, and reducing measurement frequency when requirements allow. This maps to the control channel, described in section 5.1. Servlets (such as described in section 5.2.3.1) may be loaded when needed, serving as an out-of-band control channel. Additionally, the Cougaar Adaptivity can dynamically modify the behavior of the Metrics Service and other dynamic instrumentation.
The Adaptivity Engine uses a set of plays to dictate system response to measured operating conditions. These measurements are the results of the raw sensors described in sections 5.2.1 and 5.2.2, whose values may be propagated between agents via the message relay protocol. These plays control the modes of various system components, including the sensitivity of sensor components. For example, a security management agent may lower the threshold for login violations before an alert is filed, based on the current security posture. Or, when network load is high, it may lower the rate of health check status reports. In this way, Cougaar includes a self-steering mechanism.
5.3.1.2 Metrics Service Flexibility
Together the Cougaar performance measurement channels have a minimal impact on system performance, and no impact when not in use. For example, a small prototype society (70+ agents over 2 JVMs) runs in about 7 min. 42 sec. with no measurements taken. Collecting nearly all possible raw sensor data and logging it to disk on the same machine, increases the run-time to only 8:40. The Cougaar performance measurement system offers a great range of performance data, through a variety of channels, with dynamically modifiable operating modes, with low system impact.
5.4 Application of Cougaar Measurements A recent test of the usefulness of the Cougaar measurement system was the 2002-3 Ultra*Log Engineering assessment which conducted over 150 runs of 68 distinct tests. These tests used the Cougaar Events channel to detect application completion, the servlets channels for user monitoring and application control, as well as log files and other channels. Of particular note was the use of the Metrics Service to indicate agent availability and to move agents as necessary to allow processing to complete. Note that for different tests the engineering team used different metrics, minimizing the system impact. Other Cougaar developers have similarly opted for the power of on-demand servlets, judging by comments on Cougaar mailing lists. To date, no formal analysis of the runtime impact of our measurements has been completed.
6. RELATED WORK The Cougaar effort builds on previous efforts in improved agent architectures and in understanding the performance characteristics of these systems. Researchers at BT [9] studied the effect of communication protocols and organizational structure on the performance of their MAS. Through post analysis of system throughput and response time, they demonstrated that these are key factors in predicting the performance of a multiagent system. The AgentScape project was similarly focused on system scalability for multiagent systems [12]. This project however
focused on the ability of the system to modify attributes like communication latency, location, and organization at run-time. This idea of a self-controlling system relies on run-time status information. That was the goal in the HiFi measurement system [2]. The challenge is to be scalable, and avoid impacting the performance of the underlying system. HiFi is built of a hierarchy of components, and allows run-time modifications using an “adjustable event reporting mechanism.” Additionally, HiFi includes a “control component” configured to act when specified “events” occur. HiFi correctly emphasizes flexibility as well. In other work [1], HiFi was used explicitly for performance monitoring, emphasizing variable data source priority and managing large volumes of data. However, this system was built to monitor a separate system, allowing for a heavier weight monitoring application, and requiring additional resources. Other researchers explored the benefits of multi-pronged approaches. The ZM4/SIMPLE package for software debugging and tuning combines software and hardware approaches [5]. They determined however that instrumentation must be limited to limit impact on the system, and relied on event-driven monitoring for behavior analysis. However, Cougaar supports a variety of uses. There is much work in the literature on self-steering systems. Autopilot is a system for “performance tuning” using “distributed sensors.” [11] The writers note that resources change during system execution. They reiterate that sensors must trade off local “computation against communication based on available resources,” concluding that sensors should often locally compute derived results to minimize system impact. HiFi also recognizes the importance of tuning at the sensors to minimize impact [3]. A HiFi goal is that only data that will be used is collected, and runtime adaptation (by the monitoring agents) is necessary. Researchers are increasingly interested in “run-time detection” to understand system performance, and to modify how the system runs [10]. Many researchers look at streams of discrete “events” about the system, and then apply various techniques (including pseudo-SQL queries) to filter and reason about these streams for making performance decisions. The previous research has only begun to develop the ideas of steering agent systems, or self-steering systems. Future designs must focus on system scalability, and application knowledge of its own performance. System designers must incorporate a variety of measurement approaches to accommodate both application selfadaptation and post-analysis of system performance.
7. CONCLUSION Multiagent systems have rigorous performance measurement requirements, and a unique ability to use such data to adapt to environmental changes. By building into the system architecture itself a monitoring system including a wide variety of data types, and a set of data distribution channels tuned to the requirements of the users, we can collect the required data with minimal impact on the running system. This Cougaar approach to measuring the performance of multiagent systems has been proven under the Ultra*Log program in systems of over 170 distinct agents. Our future efforts will focus on tuning our various collection and distribution mechanisms, and adding to the library of built in sensors available for system designers. Further research into the relative cost of each of these mechanisms is under way. Finally, a
clean support layer is necessary so that application builders can easily make intelligent decisions about what data to monitor, how to allow components to be configurable, and how to modify component behavior to best optimize overall system behavior.
8. ACKNOWLEDGMENTS The work described here was performed under the DARPA Ultra*Log contract #MDA972-01-C-0025. These ideas represent contributions by the many individuals who participated in the DARPA ALP and Ultra*Log programs.
9. REFERENCES [1] Al-Shaer, E., Abdel-Wahab, H. and Maly, K. A Scalable Monitoring Architecture for Managing Distributed Multimedia Systems, in IFIP/IEEE Int. Conference on Managing Multimedia Networks and Services, Montreal, CA, June 1997.
[2] Al-Shaer, E., Abdel-Wahab, H. and Maly, K. Hierarchical Filtering-based Monitoring Architecture for Large-scale Distributed Systems, in International Conference on Parallel and Distributed Computing Systems, New Orleans, LA, Oct. 1997.
[3] Al-Shaer, E. Programmable Agents for Active Distributed Monitoring, in Tenth IFIP/ IEEE International Workshop on Distributed Systems: Operations and Management (DSOM'99), 1999.
[4] BBN Quality Objects framework. http://quo.bbn.com/. [5] Hofmann, R., Klar, R., Mohr, B., Quick, A., and Siegle, M. Distributed Performance Monitoring: Methods, Tools, and Applications, in IEEE Transactions on Parallel and Distributed Systems, vol. 5, n. 6, June 1994, pp.585-598.
[6] The Jabber Software Foundation. http://www.jabber.org/. [7] The Jakarta Project, Apache Tomcat web server. http://jakarta.apache.org/tomcat/.
[8] The Jakarta Log4j Project. http://jakarta.apache.org/log4j/. [9] Lee, L.C., Nwana, H.S., Ndumu, D.T., De Wilde, P. The stability, scalability and performance of multiagent systems, in BT Technology Journal, vol 16 no 3, July 1998.
[10] Plale, B. and Schwan, K. Run-time detection in parallel and distributed systems: Application to safety-critical systems. In International Conference on Distributed Computing Systems (ICDCS), pages 163-170, June 1999.
[11] Ribler, R.L., Vetter, J.S., Simitci, H., and Reed, D.A. Autopilot: Adaptive Control of Distributed Applications. Proceedings of the 7th IEEE Symposium on High Performance Distributed Computing, July 1998.
[12] Wijngaards, N.J.E., Overeinder, B.J., van Steen, M., and Brazier, F.M.T. Supporting Internet-scale multiagent systems. In Data and Knowledge Engineering, 41(2-3): 229245, June 2002.