found in EEG frequency domain (the present study) with EEG amplitude and phase domains ..... asked to abstain from alcohol for 2 days before EEG registration. ...... and IT support and anonymous reviewers for their valuable comments.
1
Below is the unedited draft of the article that has been accepted for publication (© Neuroscience Research, 2010, V. 68, No 3, P. 207–224.)
Topographic Mapping of Rapid Transitions in EEG Multiple Frequencies: EEG Frequency Domain of Operational Synchrony Alexander A. Fingelkurts1* and Andrew A. Fingelkurts1 1
BM-Science – Brain and Mind Technologies Research Centre, Espoo, Finland
Abstract This paper describes for the first time the phenomenon of spatio-temporal mapping of interchannel temporal coincidences of rapid transition processes (RTPs) in multiple EEG frequencies. It is suggested that RTPs in multiple EEG frequencies found in different EEG channels could reflect the process of switching between brain operations performed by different neuronal assemblies. Systematic non-random temporal coincidences among RTPs found in those EEG channels could reflect functional (operational) synchrony. However, until now there have been no studies examining the existence of systematic RTPs synchronization among different EEG channels in a frequency domain. Therefore functional synchrony based on precise (point to point) temporal coincidence of RTPs found in different EEG channels and comparison with surrogate data were estimated. Findings of the present study demonstrated for the first time that non-random temporal coincidence of RTPs in EEG multiple frequencies exist for both closed and open eyes conditions. Each of the states had its own distinguished peculiarities. Similarity of the main peculiarities of operational synchrony found in EEG frequency domain (the present study) with EEG amplitude and phase domains (previous studies) permitted us to conclude that operational synchrony is a universal phenomenon in brain activity. Therefore, patterns of interaction between the cortical areas, which are usually calculated with classical cross-correlation and coherence analysis, may be complemented with operational synchrony.
Key words: Electroencephalogram (EEG); Frequency domain; Multiple brain oscillations; Short-term spectral patterns; Functional synchrony and Connectivity; Metastability and Brain operations.
List of abbreviations: EEG – Electroencephalogram RTPs – Rapid transition processes SC – Synchrocomplex SP – Spectral pattern
2
1. Introduction At present it is well established that an electroencephalogram (EEG) is a highly nonstationary signal (Bodenstein and Praetorius, 1977; Barlow, 1985; Jansen and Cheng, 1988; Shishkin et al., 1997; Kaplan, 1998; Kaplan et al., 2005) and may be considered to be the result of “gluing” of short-term stationary casual processes with different probability characteristics (a piecewise stationary) (Brodsky et al., 1999; Fell et al., 2000). Considering that an EEG signal is characterized by three major components (amplitude, frequency and phase), one may assume that each of them can exhibit non-stationary behavior. Indeed, it has been demonstrated that all three EEG characteristics change abruptly with the progression of time (for EEG amplitude see: Fingelkurts et al., 2004; Kaplan et al., 2005; Fingelkurts and Fingelkurts, 2008, 2010a; for EEG frequency see: Fingelkurts et al., 2003a,b; for EEG phase see: Freeman, 1990, 2004; Wallenstein et al., 1995; Kozma and Freeman, 2002; Puljic and Kozma, 2003). In other words, the values of EEG amplitude, frequency and phase persist for some time around some stable average, then abruptly “jump” up or down to a new stable average which after some time is replaced by another average level. These “jumps” in EEG characteristics or rapid transitional periods (RTPs) as we named them (Fingelkurts and Fingelkurts, 2001, 2008) mark the boundaries of segments of relatively stable brain functioning. It has been proposed that during these stationary periods a particular brain system (transient neuronal assembly) executes separate operations (for a review see Fingelkurts and Fingelkurts, 2005). Neuronal assembly is defined as a set of neurons that cooperate (synchronize their activity) to perform a specific computation (operation) required for a specific task (Palm, 1990; Eichenbaum, 1993; von der Malsburg, 1999; Buzsáki, 2006). The abrupt transition from one EEG segment to another in this sense reflects the changes of transient neuronal assembly state or changes in the activity of the two or more of such assemblies (Lehmann, 1971; Jansen and Cheng, 1988; Kaplan et al., 2005). This suggests that ongoing brain activity occurs in discontinuous steps (Freeman, 1990, 2004; Freeman and Holmes, 2005; Kozma and Freeman, 2002; Kozma et al., 2005) and confirms the view that the cerebral cortex is continuously active even in wakefulness (Thatcher and John 1977; Herscovitch 1994; Arieli et al., 1996; Tsodyks et al., 1999; Raichle et al., 2001; Raichle and Snyder, 2007).
3
Studies on EEG amplitude domain (for the reviews see Fingelkurts and Fingelkurts 2001, 2005, 2008, 2010a) and EEG phase domain (Freeman and Rogers, 2002; Freeman and Holmes, 2005; Kozma et al., 2005) demonstrated that (a) RTPs observed in different EEG channels systematically coincide in time and (b) this RTP temporal synchronicity is not occasional, it occurs significantly higher or lower than is expected by chance alone. The RTP synchrony estimates periods of the mutual temporal stabilization of quasi-stationary segments in the multichannel EEG (Fingelkurts et al., 2005). At the neurophysiological level this implies that various neuronal assemblies located in different cortical regions synchronise their operations on a particular time-scale (Freeman and Holmes, 2005; Fingelkurts and Fingelkurts, 2005). Such synchronization reflects brain functional connectivity (as it is defined by Friston et al., 1993, 1996) and was named Operational Synchrony (Fingelkurts and Fingelkurts, 2001). Although it is often claimed that volume conduction is the main obstacle in interpreting EEG data in terms of brain connectivity, it has been shown previously through experimental studies that in contrast to many other measures of functional synchrony, brain connectivity measure based on temporal coincidences of RTPs is sensitive to the morpho-functional organization of the cortex rather than to the volume conduction and/or reference electrode (for relevant details, we refer the reader to Kaplan et al., 2005; Fingelkurts and Fingelkurts, 2008). These findings also suggested the existence of statistical heterogeneity (anisotropy) of electromagnetic field in regard to the processes of mutual stabilization of quasi-stable periods in regional EEGs. In addition and contrary to other EEG measures of functional connectivity, the measure based on temporal coincidences of RTPs does not require implicit or explicit source model for the interpretation of its results (Fingelkurts and Fingelkurts, 2001). Additionally, there have been actual cases (for the review see Fingelkurts and Fingelkurts, 2010b) where electrode-functional source correspondence was seen in studies focusing on the cortical activities immediately under the skull thus suggesting that local EEG is sensitive to morpho-functional organization of the cortex: (1) Covariance between neighboring electrodes across cortex functional boundaries (e.g., parietal to temporal areas) is much smaller than covariance within functional regions (e.g., left parietal to midline parietal area), indicating that multiple distinct functional areas are assessed by topographic EEG (Kooi, 1971; Bullock and McClune, 1989). (2) Experimental findings demonstrated that the probabilities of firing of neurons observed singly and in small groups simultaneously are in close statistical
4
relationship to the EEG recorded in the near vicinity (Freeman, 1975; Eeckman and Freeman, 1990, 1991). Therefore the EEG can provide an experimental basis for estimating the local mean field of contributory neurons. (3) Important work came from Cook et al. (1998) who demonstrated experimentally the accuracy of topographic EEG mapping for determining local (immediately under the recording electrode) brain activity. Study demonstrated that there are statistically significant linear relationships between EEG power and perfusion in the majority of frequency bands (Cook et al., 1998). This finding is in line with earlier study of Inouye et al. (1986), where the authors demonstrated that endogenous EEG activity originated from underlying cortex area contributes the most to the spectral power measured from the given EEG electrode. Whereas exogenous EEG activities originated from the other cortical areas contribute to spectral power of the same EEG electrode insignificantly. Thus, together described works suggest that topographic EEG mapping can accurately reflect local brain function and that it is comparable to other topographic methods. Notice that in these studies there are no inferences about primary generators (sources) of the EEG activity in different cortex areas. Considering that all activities (influences) from multiple primary sources are not just mixed, summed or averaged in a given cortex area, but are integrated within the current state (activity) of this area, the local EEG is considered to represent a functional source, which is defined as the part or parts of the brain that contribute to the activity recorded at a single sensor (Stam, 2005; Wackermann and Allefeld, 2007). A functional source is an operational concept that does not have to coincide with a well defined anatomical part of the brain, and is neutral with respect to the problems of localization of primary source and volume conduction (Stam, 2005; Wackermann and Allefeld, 2007). Until now there have been no studies examining the existence of systematic RTPs synchronization among different EEG channels in a frequency domain. At the same time, exactly different frequencies of EEG oscillations reflect functionally different components of information processing acting on various temporal scales (Klimesch et al., 2005). It is suggested that the oscillatory activity of neuronal pools, which is reflected in characteristic EEG rhythms, constitutes a mechanism by which the brain can regulate changes of a state in selected neuronal networks to cause qualitative transitions between modes of information processing (Lopes da Silva, 1996). Hence, different oscillatory patterns may be indicative of different information processing states, and it has been proposed that the oscillatory patterns play an active role in these states (Bhattacharya, 2001; Lakatos et al., 2005).
5
Various EEG oscillatory patterns can be indexed by different types of short-term EEG spectral patterns (SPs) – a distribution of spectral power values (Fingelkurts et al., 2003a), where each SP type may be considered as a single event in EEG phenomenology (Fingelkurts and Fingelkurts, 2010b). It was demonstrated that even at rest the EEG SP types emerge, persist for some time and then disappear to be replaced by other SP types (Fingelkurts et al., 2003a,b). Additionally, the dynamics of spatio-temporal variability of resting EEG short-term SPs was characterized by abrupt alteration of relatively stable periods, the duration of which were significantly different from the respective characteristics of a random process (Fingelkurts et al., 2006). The obtained results suggest an existence of a special operational synchrony within basic EEG rhythms. In contrast to classical synchronization methods (coherence, correlation, phase and others), this kind of synchrony reflects a temporal consistency of quasi-stationary modes of brain oscillatory activity. Currently, a number of EEG measures of integrative brain activity indexed by functional connectivity are available. They are: (1) correlation and coherence coefficients (for the reviews, see Thatcher et al., 1986; Nunez et al., 1997) as well as partial directed coherence (Baccala and Sameshima, 2001); (2) dynamic imaging of coherent sources (Gross et al., 2001), and phase synchrony based on wavelet (Lachaux et al., 1999) or Hilbert (Tass, 1999) transforms; (3) indices of mutual information (Xu et al., 1997); (4) “geometric” estimations of joint coordination of local EEGs calculated with the help of factor analysis (Manmaru and Matsuura, 1989; Lazarev, 1997) and multivariate linear regression (Wada et al., 1996; Lehmann et al., 1995) of the primary EEG characteristics; (5) chaotic dynamics of an EEG vector composed of simultaneous momentary counts of local EEGs (Matousek et al., 1995); (5) spectro-correlative characteristics of local EEGs (Ivanitski et al., 1990; Sviderskaya and Korol’kova, 1997); and (6) spatially oriented segmentation of cortical potentials proposed by Lehmann (Lehmann, 1971, 1987). Even though, many of these approaches have proved to be useful for characterization of integrative brain activity, all of them have one or more drawbacks and limitations from the following list (for the critical and detailed discussion, see Fingelkurts et al., 2005; Fingelkurts and Fingelkurts, 2005): Such methods (1) are designed predominantly for EEG analysis only in pairs of derivations, (2) do not take into consideration the non-stationary nature of the signal, (3) indicate only the linear statistical link between time-series curves in a frequency band, (4) require long time epochs of analysis, (5) can be applied only to homogeneous
6
medium, which is an unrealistic assumption for the brain, (6) borrow complex methodologies and conceptual frameworks from physics, mathematics, and engineering, but use them loosely when applying to the analysis of physiological signal, (7) as very averaged indices they lose a substantial part of their diagnostic value for studying discrete functional states of the brain, (8) local EEGs participate in the formation of the resulting dipole vector far from equally, what is unjustified from the viewpoint of indubitable neurobiological equivalence of cortical areas, (9) the measures used to characterize the EEG are often difficult to interpret in terms of their physiological correlate, (10) all existed measures of brain functional connectivity do not directly estimate metastability in the brain (Fingelkurts and Fingelkurts, 2004). Additionally, lack of initial “attachment” of the majority of the abovementioned measures to brain oscillations makes results ontologically unpromising. At the same time, different frequencies of brain oscillations reflect functionally different components of information processing acting on various spatial scales (Klimesch et al., 2005). It is supposed that brain functioning is based on short- and long-range interactions between neuronal assembles which oscillate at multiple frequencies (Jing and Takigawa, 2000; Bhattacharya, 2001) which are coherent and specific and thus capable of resonance – functional communication (Basar et al., 2001). Therefore, it was proposed to combine the advantages of the temporal and frequency approaches for the analysis of segment-to-segment organization of the cortical biopotential field. In such a way, this approach results in the topographic map of the EEG SP transitions and thus, enables researches to study spatio-temporal variability of brain oscillatory states (indexed by short-term spectral descriptions) in multichannel EEG. This analysis of topographic SP variability may permit researches to trace episodes of the metastable cortical inter-area cooperations independently on partial correlation and/or coherency between the local EEGs. Additionally, this method requires no a priori assumptions about which frequency bands should be synchronised, but rather relies on the natural statistical properties of the data. In context of the aforementioned it is reasonable to study episodes of synchrony within the dynamics of the spatial mosaic of different EEG oscillations. Hence, the aim of this study was to investigate systematic temporal coincidences of RTPs in EEG oscillatory patterns
7
(indexed by EEG SP types) in a broad frequency range (0.5–30 Hz) among different EEG channels.
2. Materials and methods 2.1. Subjects Twelve healthy, right-handed adult male volunteers (aged 19–26) participated in the study. None of the subjects reported any history of brain traumas or concussions, neurological or psychiatric disorders, acute or chronic medical illness, or was on medication at the time of the EEG registration. In addition, all of them have normal blood pressure and pulse rate. All of the subjects were informed beforehand about the nature of the procedure. Written, informed consent from all subjects and institutional ethical committee approval were obtained prior to the experiment. The study has been performed in accordance with the ethical standards laid down in the 1964 Declaration of Helsinki. Since alcohol influences variation of normal EEG (Propping et al., 1980), subjects were asked to abstain from alcohol for 2 days before EEG registration. To control variation due to food intake, participants were asked to have breakfast with two slices of toast, jelly and orange juice, and were instructed to avoid caffeine for 12 h prior to the recordings. The EEG registrations began at 10:00 a.m. 2.2. Procedure and data acquisition Eight Ag/AgCl electrodes were placed bilaterally on the subject's scalp using the 10/20 system of electrode placement at O1, O2, P3, P4, C3, C4, F3 and F4. Vertical and horizontal electro-oculograms were recorded. All electrodes were referred to linked ears (linked-ears reference was obtained digitally from two separate, impedance-checked channels). Raw EEG signals were amplified and bandpass-filtered in the 0.5–30 Hz frequency range and digitized at a sampling rate of 128 Hz by a 12-bit analog-to-digital converter with a resolution of 1µV/bit. This frequency range was chosen because approximately 98% of spectral power lies within these limits (Thatcher, 2001).
8
Even though frequencies above 30 Hz (gamma band) have been proposed to be functionally informative, there are a number of methodological issues which lead us to exclude frequencies above 30 Hz from the present analysis: (a) it was shown, that there is little effect of volume conduction on the shape of the spectrum below about 25 Hz and spatial filtering is significant only for frequencies above 25 Hz (Robinson et al., 2001); (b) high-frequency spindles have very low signal-to-noise ratio, what results in considerable contamination of gamma band by noise; (c) dynamics of high-frequency responses may be a trivial by-product of power changes in lower frequencies (Pulvermuller et al., 1995) and/or due to ringing of filters by EEG spikes recurring at theta rates (Freeman, 2003); (d) gamma oscillations are present during states such as deep anesthesia, where conscious cognitive processing is absent (Steriade and Amzica, 1996; Steriade et al., 1996); (e) it was demonstrated that some of the induced gamma activity that was attributed to feature binding generated in visual cortical areas were in fact artifacts of miniature saccades evoked by the stimuli (Yuval-Greenberg et al., 2008). In addition, a strong link between gamma band oscillations and (un)conscious facial muscle activity during cognitive tasks was confirmed by showing that such oscillations disappear despite normal cognitive performance when the muscles are paralyzed (Whitham et al., 2007, 2008; Ball et al., 2008); (f) comprising only 2% of spectral power (Thatcher, 2001), contribution of high-frequency band into spectrum cannot be significant; (g) Bullock et al (2003) demonstrated many “good” rhythms in the 2–25 Hz range which were mainly sinusoidal, but did not find them in 30–50 Hz band; (h) gamma band is often known to carry cognitively relevant information, however presented study was conducted during resting conditions. Considering all of these, there might be difficulties in the meaningful interpretation of effects in high-frequency band regardless of how powerful or statistically significant they may be. The impedance of the recording electrodes was always below 5 k. The presence of an adequate EEG signal was determined by visual inspection of the raw signal on the computer screen. After the electrodes were placed on the subject’s head and the instrument calibrated, the subject was seated in a comfortable chair in a registration room and the procedure was explained. To reduce muscular artefacts in the EEG signal, the subject was instructed to assume a comfortable position and to avoid movement.
9
Instructions designed to minimize movement and relax jaw muscles resulted in suppressing the myogram class of artifact to the extent that the high-frequency spectrum was not significantly affected. A subject was instructed also to look straight in front of him/her (even when the eyes were closed) and to avoid unnecessary eye movements. Constant visual EEG monitoring allowed the selection of only artifact-free 1-min EEG recordings for analysis. Alertness of subjects during the EEG recording was determined by the design of the study: separate 1-min EEGs were recorded in a relatively well-lit room with a short break inbetween to assume a comfortable position. Such design should keep subjects awake. Vigilance of subjects was controlled by visual detection for the presence of sleep spindles which appear naturally during drowsiness (Rechtschaffen and Kales, 1968). None of the subjects demonstrated sleep spindles in the recorded EEGs. For each subject ten 8-channel 1-min EEGs were recorded randomly during steady resting conditions for closed and open eyes separately. Such ongoing EEG activity during resting condition reflects the current functional state of neuronal masses rather than a random process (Livanov, 1984). A total of 102 (for closed eyes) and 45 (for open eyes) artifact-free 1-min EEGs were selected for the analysis. According to literature two one-min EEGs have proven to produce reliable estimates of internal consistency (Coan et al., 2001). Moreover, even the duration of 20 sec of EEG epoch is sufficient to reduce adequately the variability inherent in the EEG (Gasser et al., 1985). In the present study majority of the subjects contributed to EEGs’ pool with 10 one-min EEGs (for closed eyes) and 4 one-min EEGs (for open eyes), which is well above the aforementioned limits. 2.3. Data Processing EEG analysis was undertaken in four stages (Fig. 1). Since EEG is widely referred to as a non-stationary signal with varying characteristics (for the reviews see Barlow, 1985; Jansen and Cheng, 1988; Kaplan, 1998; Kaplan et al., 2005), EEG oscillations are expected to be dynamic in nature. During the first stage of EEG analysis the data series were divided into overlapping windows in order to capture EEG changing dynamics. EEG oscillations were
10
quantified by calculation of individual short-term EEG SPs. Individual power spectra1 were calculated in the range of 0.5–30 Hz with 0.5-Hz resolution (61 values), using FFT with a 2sec Hanning window shifted by 50 samples (0.39-sec) for each channel of 1-min EEG. According to previous studies, these values proved the most effective for revealing oscillatory patterns from the signal (Levy, 1987; Kaplan, 1998). The works which have studied the effect of epoch length on the variability of power spectrum (Levy, 1987; Kaplan, 1998) demonstrated that (a) the epoch-to-epoch variability with power spectra computed using 2-sec epochs was significantly less than the variability when power spectra were computed using longer epoch lengths, and (b) analysis using 2-sec epochs identified changes more rapidly than analysis using any longer epoch length, and the differences were clinically significant as well. Moreover, a 2-sec epoch is long enough to get a reliable estimation of the lowest frequency (0.5 Hz), and is short enough to be quasistationary (McEwen and Anderson, 1975; Inouye et al., 1995). Taken together these findings suggest that 2-sec epoch lengths are preferable when power spectrum analysis is used. Further, according to the work of Kaplan (1998) in which the author studied the effect of window shift on disclosing oscillatory patterns from the signal using shifts from 1 to 256 samples, the window shift in 50 samples was the most effective. Sliding spectral analysis with overlapping segments, previously applied to EEG signals (Keidel et al., 1987; Tirsch et al., 1988), (a) takes the non-stationarity of the time series into account, (b) compensates for the effects of windowing and (c) prevents loss of information due to residual activity. We did not used predefined and isolated from each other narrow frequency bands because by doing so we could not examine behaviour of the actual/natural composition of brain oscillations involved. Earlier it was demonstrated that brain functioning is represented by multiple oscillations (Basar et al, 2000). According to the superposition principle introduced by Basar et al. (1999), brain activity is accompanied by superimposed multiple brain oscillations in many frequency bands (for the review, see Basar et al., 2004). 1
Log transformation of the power spectra was not used in the present study for the following reason: Log transformation usually normalizes a power spectrum, but, at the same time, it artificially reduces the contrast of the differences between large and small power values. This leads to the increased contribution of the small-amplitude values and correspondently, the noise into a total spectrum. For the purpose of this paper “clean” power spectra without noise contamination are of great importance. Additionally, log transformation can exaggerate extremely small, but topographically reproducible errors in areas with low EEG power.
11
After calculation of EEG short-term SPs, the total number of individual SPs for each channel of one-min EEG was 149 (Fig. 1). Each SP was labelled according to the index of the class to which it belongs with the help of a probability-classification analysis of the short-term EEG SPs (see Appendix to this article). Sequential single EEG SPs were adaptively classified in each channel of 1-min EEG using a set of standard SPs, which were generated automatically from the EEG data itself – and was not chosen arbitrary. The number of SPs classes in this study was 18–26 (for different EEG channels) (see Appendix to this article). As the result of classification procedure, each current SP was labelled according to the index of the class to which it belongs. Hence, each EEG signal was reduced to a sequence of individually classified SPs (Fig. 1). During the second stage, segmentation of EEG signal based on the changes of SP type was performed (Fig. 1). A single EEG spectrum illustrates the particular integral dynamics of tens and hundreds of thousands of neurons in a given cortical area at a particular point in time (Dumermuth and Molinari, 1987). Therefore, the absence of variance of a single SP type during several analyzed epochs proves that in a given cortical area the same macro-regimen of neuronal pool activity is maintained throughout that period. Thus, periods of several consecutive EEG epochs which are characterized by the same SP type comprise a SPsegment – EEG segment of quasi-stationary oscillatory activity. The moment of change of the type of SP-segment marks a RTP. In such a way, time coordinates of each RTP for each EEG channel separately were determined (Fig. 1). The theoretical concepts behind segmentation analysis of EEG are described elsewhere (for the reviews see Fingelkurts and Fingelkurts, 2001, 2008; Kaplan et al., 2005). During the third stage, functional brain connectivity based on temporal coincidence2 of RTPs found in different EEG channels was estimated (Fig. 1). The number of RTP’s temporal coincidences was counted for each 1-min EEG and compared with that of surrogate data. Two (or more) EEG channels were considered functionally connected if systematic temporal relationship among them (the number of coincided RTPs per 1-min EEG) was different from random level measured in surrogate data (see below). The values which are statistically 2
Technically, two (or more) RTPs from different EEG channels were considered coincident temporally when these RTPs had the same temporal coordinates. However, position of temporal coordinate of a given RTP is dependent on a discrete temporal lag of 0.39s used for calculation of SPs (see above). Therefore, the actual temporal coincidence is occurred in 0.39s window. Considering that the shift in 0.39s was the most effective on disclosing oscillatory patterns from the signal in modelling study (Kaplan, 1998), one may assume that measured temporal coordinates of RTPs are approach the real ones.
12
13
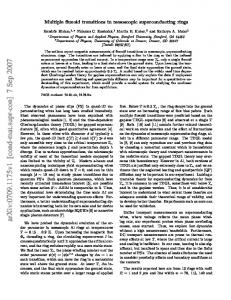
Figure 1. The scheme of the data processing. First stage: Sliding spectral analysis and adaptive classification of short-term spectral patterns (SP) were done separately for each subject and each channel of 1-min EEG. O1 = Left occipital EEG channel. Gray small numbers under each SP represent the running numbers from 1 to 149 of EEG epoch analysis. The number in the square represents the class to which a given SP was assigned during classification procedure. Second stage: Segmentation of EEG signal based on the changes of SP type was performed. The moment of change of type of SP-segment marked a rapid transitory period (RTP). In such a way, time coordinates of each RTP for each EEG channel separately were determined. Third stage: Functional connectivity based on precise (point to point) temporal coincidence of RTPs found in different EEG channels was estimated. Fourth stage: EEG structural synchrony mapping was performed based on mapping onto schematic brain maps synchronised EEG channels (synchrocomplexes) by connecting lines between the EEG channels involved.
significantly above the random level indicate ‘active’ coupling of EEG segments (synchronization of EEG segments is observed significantly more often than it expected by chance), whereas the values which are statistically significantly below the random level indicate ‘active’ decoupling of EEG segments (synchronization of EEG segments is observed significantly less than it expected by chance). Notice that synchronised RTPs mark transitions between different types of SPs, which are usually different in various EEG channels (Fig. 1, third stage, insertion). Therefore, described RTPs-based measure of functional connectivity, in contrast to conventional approaches, is free from similarities of the EEG signals in different channels. In this context, stabilization of SP RTPs simultaneously in several cortical areas may reflect formation of steady cooperation between cortical areas independently on particular characteristics of these SPs within each EEG channel. Result of such cooperation represents a metastable state (Kelso, 1995; Bressler and Kelso, 2001; Kozma et al., 2005; for the resent reviews on metastability in the brain, see in Fingelkurts and Fingelkurts, 2004, 2005, 2008 and Werner, 2007). It was suggested that this measure reveals functional (operational) interrelationships between cortical sites different from those measured by correlation, coherence and phase analysis (Kaplan et al., 2005; Fingelkurts et al., 2005). From a qualitative perspective, the coupling of EEG segments corresponds to the phenomenon of synchronization of brain operations or operational synchrony – OS (Kaplan et al., 1997; Fingelkurts and Fingelkurts, 2001, 2004, 2005, 2008).
14
Each case of temporally synchronised RTPs between two or more EEG channels is described as a synchrocomplex (SC). The number of cortical areas recruited in SC is described as “the order of areas recruitment.” All SCs were divided into seven categories based on the number of cortex areas involved: SC2 – SC with 2nd order of area recruitment, SC3 – SC with 3rd order of area recruitment, SC4 – SC with 4th order of area recruitment, SC5 – SC with 5th order of area recruitment, SC6 – SC with 6th order of area recruitment, SC7 – SC with 7th order of area recruitment and SC8 – SC with 8th order of area recruitment. Notice that any given SC was considered as a member of its own category (for example, SC3) only if correspondent RTPs coincided in time among correspondent number of EEG channels (in this example, 3). However, any three SC2s which could comprise the SC3 but which did not coincide in time between each other were not considered as producing SC3 type and, therefore was not counted. The same logic was applied for any SCs and for any category. At stage four, EEG structural synchrony mapping was performed (Fig. 1). The most frequent SCs which occurred (a) in the largest number of repetitions (in %) among all found SCs (n = 14156 of all SCs for closed eyes and n = 6195 of all SCs for open eyes) and (b) in more than 40% of all EEGs (n = 102 for closed eyes and n = 45 for open eyes) were mapped onto schematic brain maps as connecting lines between the EEG channels involved. 2.4. Control for a non-random RTP synchrony Control for a non-random RTP synchrony was performed by comparing results of synchrony from real EEG with those of surrogate data: Surrogate data: Surrogate data were used to control for the neural origin of spatial-temporal dynamics of SPs, which is commonly applied as direct probing a signal for a non-random spatial-temporal structure (Ivanov et al., 1996). Surrogate signals have identical parameters with the original signals but do not have spatial-temporal correlations. Construction of surrogate data is illustrated in figure 2. In order to simulate a situation with full temporal mismatch, 8 channels of the initial 1-min EEGs were mixed such that no two channels were recorded at the same time in each of the newly constructed 8-channel 1-min EEGs. This way, the natural time relations between channels in surrogate EEG were completely destroyed; however, the natural dynamics of SP-
15
segments sequence and the ratio between different types of SP-segments within each EEG channel remained the same (Fig. 2).
Real 8-channel EEGs
Surrogate data (8-channel EEG)
1st minute 1 2
.. . 7 8
2nd minute
One minute EEG
1 2 7 8
1
.. .
2
...
... 7
7th minute 1 2
8
.. . 7 8
8th minute 1 2
.. . 7 8
Temporal mixing
Figure 2. Construction of surrogate data: only one channel from each real 8-channel EEG (one minute) was mixed into surrogate 8-channel EEG (one minute). Thus, mixing of the real EEG channels was done in such a way that each channel of surrogate EEG was recorded in a different time.
16
2.5. Statistics In order to reveal statistically significant differences between closed eyes and open eyes conditions, and surrogate data the Wilcoxon matched pairs t-test was used. Statistical significance was assumed when p < 0.05 (only statistically significant values are displayed).
3. Results 3.1. EEG functional (operational) connectivity EEG segmentation revealed that EEG channels were characterised by 30 to 114 RTPs (average values for each EEG channel for closed and open eyes separately are presented in Table 1). In general, open eyes condition had more RTPs per EEG channel than closed eyes condition (p < 0.008) with larger difference in the posterior part of the head. After RTPs in EEG multiple frequencies (indexed by the change of the type of SP-segments) were determined in each EEG channel, the absolute number of RTP’ temporal coincidences between different EEG channels (or SCs) was calculated. There was no statistically significant difference between the total number of SCs for closed and open eyes conditions (see insertion in Fig. 3).
17 Total number of SCs *** ns *
152 147 142
30
137
CE ***
OE
132 127
25
122
The number of SCs (in %)
Mch
CE
***
OE
Mch
20
15
*
**
10
* ***
5
*** ***
0 2
3
4
5
6
7
8
Categories of SCs with particular order of areas recruitment Figure 3. The number of synchrocomplexies (SCs) within each category (in % from the total number of SCs in one-minute EEG). In the insertion the total number of SCs per oneminute EEG is presented. Data averaged across 102 EEGs (for closed eyes - CE) and 45 EEGs (for open eyes - OE). MCh = mixed channels (surrogate data); ns = statistically nonsignificant; * = p=0.71
i = 1..n
Figure 8. Second, third and fourth steps of a probability-classification analysis of the short-term EEG SPs. s-SPj – standard spectral pattern of type j, c-SPi – current spectral pattern of type i, a-SPj – actual spectral patterns of type j, CC – coefficient of correlation.
During the third step, the current SPs included in a particular class were averaged within this class (Fig. 8). The same procedure was performed for all classes separately for each EEG channel. On the back of this, the standard spectra were reconstructed but this time taking into account the peculiarities of the spectral description of concrete channel of the particular EEG. In this way an “actualization” of the initial standard SP set was performed. In other words, standard SPs were converted into so-called actual spectral patterns. Notice that the main frequency peaks in the actual SP of every class stay the same as in the corresponding standard SP’s classes. However, overall shape of the power spectrum was automatically
36
modulated in the direction to better represent the multitude of all SPs within each class in a given EEG channel. An actual SP set was in turn used for the fourth step – the final classification of the current SPs: each of current SPs was attributed to only one actual SP class for which the CC was the maximum of the set of r ≥ 0.71 (Fig. 8). The probability-classification technique employs two correction algorithms to achieve a significant reduction in the variance of single spectral estimations and to take into account the relationship between neighbour frequencies in the frequency continuum (Kaplan et al., 1999; Fingelkurts et al., 2003a): (a) spectrum glide smoothing, (b) choosing the maximum CC out of the three values of the correlation function, which was calculated between the standard SP and the current SP on zero shift and on double-side shift by one step (±0.5 Hz). According to tests and modelling calculations, the latter procedure was chosen in this study. This justifies the use of individual short-term SPs and increases the sensitivity of this analytical approach in revealing the dynamics of EEG oscillatory patterns. This SP classification method made it possible to identify up to 100% of the individual single spectra in the EEGs due to the algorithm’s ability to adapt to local signals. Therefore at every time step a valid classification was reached, i.e., there was no 'undecided' category. Considering that a single EEG spectrum illustrates the particular integral dynamics of tens and hundreds of thousands of neurons in a given cortical area at a particular point in time (Dumermuth and Molinari, 1987), it can be said that the SPs within each class are generated by the same or similar dynamics with the same or similar driving force. SPs from different classes, however, have had in effect different driving forces and therefore have been generated by different dynamics (Manuca and Savit, 1996). In this case, one type of SP may be considered as a single event in EEG phenomenology from the viewpoint of its spectral characteristics (Fingelkurts and Fingelkurts, 2010b). In this context, this analytical approach implicitly considers the non-stationarity of EEG (for the review on EEG non-stationarity see Kaplan et al., 2005). As a result of the probability-classification technique, each current SP was labelled according to the index of the class to which it belongs. Thus, a sequence of SP labels that represents the sequence of EEG oscillatory states through which the system passes was obtained. Hence, each EEG signal was reduced to a sequence of individually classified SPs (Fig. 1).
37
References
Ames, A.I., 2000. CNS energy metabolism as related to function. Brain Res. Rev. 34, 42–68. Arieli, A., Sterkin, A., Grinvald, A., Aertsen, A., 1996. Dynamics of ongoing activity: explanation of the large variability in evoked cortical responses. Science 273, 1868–1871. Attwell, D., Laughlin, S.B., 2001. An energy budget for signalling in the grey matter of the brain. J. Cereb. Blood Flow Metab. 21,1133–1145. Babiloni, C., Miniussi, C., Babiloni, F., Carducci, F., Cincotti, F., Del Percio, C., Sirello, G., Fracassi, C., Nobre, A.C., Rossini, P.M., 2004. Sub-second "temporal attention" modulates alpha rhythms. A high-resolution EEG study. Brain Res. Cogn. Brain Res. 19, 259–268. Baccala, L.A., Sameshima, K., 2001. Partial directed coherence: a new concept in neural structure determination. Biol. Cybern. 84, 463-474. Ball, T., Demandt, E., Mutschler, I., Neitzel, E., Mehring, C., Vogt, K., Aertsen, A., SchulzeBonhage, A., 2008. Movement related activity in the high gamma range of the human EEG. NeuroImage 41, 302–310. Barlow, J.S., 1985. Methods of analysis of nonstationary EEGs, with emphasis on segmentation techniques: A comparative review. J. Clin. Neurophysiol. 2, 267-304. Basar, E., Basar-Eroglu, C., Karakas, S., Schurmann, M., 1999. Are cognitive processes manifested in event-related gamma, alpha, theta and delta oscillations in the EEG? Neurosci. Lett. 259, 165-168. Basar, E., Basar-Eroglu, C., Karakas, S., Schurmann, M., 2000. Brain oscillations in perception and memory. Int. J. Psychophysiol. 35, 95-124. Basar, E., Basar-Eroglu, C., Karakas, S., Schurmann, M., 2001. Gamma, alpha, delta, and theta oscillations govern cognitive processes. Int. J. Psychophysiol. 39, 241-248. Basar, E., Özgören, M., Karakas, S., Basar-Eroglu, C., 2004. Super-synergy in the brain: The grandmother percept is manifested by multiple oscillations. Int. J. Bifurcat. Chaos 14, 453491. Bhattacharya, J., 2001. Reduced degree of long-range phase synchrony in pathological human brain. Acta Neurobiol. Exp. 61, 309-318. Bodenstein, G., Praetorius, H.M., 1977. Feature extraction from the electroencephalogram by adaptive segmentation. Proc. IEEE 65, 642-652. Bressler, S.L., Kelso, J.A.S., 2001. Cortical coordination dynamics and cognition. Trends Cogn. Sci. 5, 26–36. Brodsky, B.E., Darkhovsky, B.S., Kaplan, A.Y., Shishkin, S.L., 1999. A nonparametric method for the segmentation of the EEG. Comp. Methods Prog. BioMed 60, 93-106. Bullock, T.H., 1997. Signals and signs in the nervous system: The dynamic anatomy of electrical activity. PNAS 94, 1-6. Bullock, T.H., McClune, M.C., 1989. Lateral coherence of the electroencephalogram: A new measure of brain synchrony. Electroencephalogr. Clin. Neurophysiol. 73, 479-498. Bullock, T.H., McClune, M.C., Enright, J.T., 2003. Are the EEGs mainly rhythmic? Assessment of periodicity in wide-band time series. Neuroscience 121(1), 233-252. Buzsáki, G., 2006. Rhythms of the Brain. Oxford University Press, Oxford. Coan, J.A., Allen, J.J.B., Harmon-Jones, E., 2001. Voluntary facial expression and hemispheric asymmetry over the frontal cortex. Psychophysiol. 38, 912–925. Cohen, D., Cuffin, B.N., Yunokuchi, K., Maniewski, R., Purcell, C., Cosgrove, G.R., Ives, J., Kennedy, J., Schomer, D., 1990. MEG versus EEG localization test using implanted sources in the human brain. Ann. Neurol. 28, 811-817.
38
Cook, I.A., O’Hara, R., Uijtdehaage, S.H., Mandelkern, M., Leuchter, A.F., 1998. Assessing the accuracy of topographic EEG mapping for determining local brain function. Electroencephalogr. Clin. Neurophysiol. 107, 408-414. Dumermuth, H.G., Molinari, L., 1987. Spectral analysis of the EEG. Some fundamentals revisited and some open problems. Neuropsychobiol. 17, 85-99. Eeckman, F.H., Freeman, W.J., 1990. Correlations between unit firing and EEG in the rat olfactory system. Brain Res. 528, 238-244. Eeckman, F.H., Freeman, W.J., 1991. Asymmetric sigmoid nonlinearity in the rat olfactory system. Brain Res. 557, 13-21. Eichenbaum, H., 1993. Thinking about brain cell assemblies. Science 261, 993-994. Fell, J., Kaplan, A., Darkhovsky, B., Röschke, J., 2000. EEG analysis with nonlinear deterministic and stochastic methods: a combined strategy. Acta Neurobiol. Exp. 60, 87108. Ferree, T.C., Luu, P., Russell, G.S., Tucker, D.M., 2001. Scalp electrode impedance, infection risk, and EEG data quality. Clin. Neurophysiol. 112, 536-544. Fingelkurts, An.A., 1998. Spatial-Temporal organization of the human EEG segmental structure. Ph.D. Dissertation. Moscow State University, Moscow, pp. 401 (In Russian). Fingelkurts, An.A., Fingelkurts, Al.A., 2001. Operational architectonics of the human brain biopotential field: towards solving the mind-brain problem. Brain Mind 2, 261-296 Available from: http://www.bm-science.com/team/art18.pdf Fingelkurts, An.A., Fingelkurts, Al.A., 2004. Making complexity simpler: Multivariability and metastability in the brain. Int. J. Neurosci. 114(7), 843-862. Fingelkurts, An.A., Fingelkurts, Al.A., 2005. Mapping of the brain operational architectonics. In: Chen, F.J. (Ed.), Focus on brain mapping research, Chapter 2, Nova Science Publishers, Inc., pp. 59-98. Available at URL: http://www.bmscience.com/team/chapt3.pdf Fingelkurts, An.A., Fingelkurts, Al.A., 2006. Timing in cognition and EEG brain dynamics: discreteness versus continuity. Cogn. Process. 7, 135-162. Fingelkurts, An.A., Fingelkurts, Al.A., 2008. Brain-mind Operational Architectonics imaging: technical and methodological aspects. Open Neuroimag. J. 2, 73-93. Fingelkurts, An.A., Fingelkurts, Al.A., 2010a. Alpha rhythm operational architectonics in the continuum of normal and pathological brain states: Current state of research. Int. J. Psychophysiol. 76, 93-106. Fingelkurts, Al.A., Fingelkurts, An.A., 2010b. Short-term EEG spectral pattern as a single event in EEG phenomenology. Open Neuroimag. J. (In press). Fingelkurts, Al.A., Fingelkurts, An.A., Kaplan, A.Ya., 2003a. The regularities of the discrete nature of multi-variability of EEG spectral patterns. Int. J. Psychophysiol. 47(1), 23-41. Fingelkurts, Al.A., Fingelkurts, An.A., Krause, C.M., Kaplan, A.Ya., 2003b. Systematic rules underlying spectral pattern variability: Experimental results and a review of the evidences. Int. J. Neurosci. 113, 1447-1473. Fingelkurts, An.A., Fingelkurts, Al.A., Kivisaari, R., Pekkonen, E., Ilmoniemi, R.J., Kähkönen, S.A., 2004. Local and remote functional connectivity of neocortex under the inhibition influence. NeuroImage 22(3), 1390-1406. Fingelkurts, An.A., Fingelkurts, Al.A., Kähkönen, S., 2005. Functional connectivity in the brain – is it an elusive concept? Neurosci. Biobehav. Rev. 28, 827-836. Fingelkurts, Al.A., Fingelkurts, An.A., Kaplan, A.Ya., 2006. Interictal EEG as a physiological adaptation. Part II: Topographic variability of composition of brain oscillations in interictal EEG. Clinl. Neurophisiol. 117(4), 789-802.
39
Fingelkurts, An.A., Fingelkurts, Al.A., Neves, C.F.H., 2009. Phenomenological architecture of a mind and Operational Architectonics of the brain: the unified metastable continuum. New Mathematics and Natural Computation 5(1), 221–244. Freeman, W.J., 1975. Mass Action in the Nervous System. Academic Press, New York. Freeman, W.J., 1990. On the problem of anomalous dispersion in chaoto-chaotic phase transitions of neural masses, and its significance for the management of perceptual information in brains. In: Haken, H., Stadler, M., (Eds.), Synergetics of Cognition, vol. 45. Springer-Verlag, Berlin, pp. 126-143. Freeman, W.J., 2003. The Wave Packet: An Action Potential for the 21st Century. J. Integr. Neurosci. 2, 3-30. Freeman, W.J., 2004. Origin, structure, and role of background EEG activity. Part 2. Analytic phase. Clin. Neurophysiol. 115, 2089-2107. Freeman, W.J., Rorers, L.J., 2002. Fine temporal resolution of analytic phase reveals episodic synchronization by state transitions in gamma EEGs. J. Neurophysiol. 87, 937–945. Freeman, W.J., Holmes, M.D., 2005. Metastability, instability, and state transitions in neocortex. Neural. Netw. 18, 497-504. Friston, K.J., Frith, C.D., Liddle, P.F., Frackowiak, R.S.J., 1993. Functional connectivity: the principal component analysis of large (PET) data sets. J. Cereb. Blood Flow Metab. 13, 514. Friston, K.J., Frith, C.D., Fletcher, P., Liddle, P.F., Frackowiak, R.S.J., 1996. Functional topography: Multidimensional scaling and functional connectivity in the brain. Cereb. Cortex 6, 156-164. Gasser, T., Bacher, P., Steinberg, H., 1985. Test–retest reliability of spectral parameters of the EEG. Electroencephalogr. Clin. Neurophysiol. 60, 312–9. Gevins, A., Smith, M.E., McEvoy, L., Yu, D., 1997. High resolution EEG mapping of cortical activation related to working memory: effects of task difficulty, type of processing, and practice. Cereb. Cortex. 7, 374–385. Gross, J., Kujala, J., Hamalainen, M., Timmermann, L., Schnitzler, A., Salmelin, R., 2001. Dynamic imaging of coherent sources: studying neural interactions in the human brain. PNAS 98, 694-699. Gusnard, D.A., Akbudak, E., Shulman, G.L., Raichle, M.E., 2001. Medial prefrontal cortex and self-referential mental activity: Relation to a default mode of brain function. PNAS 98, 4259–4264. Herscovitch, P., 1994. Radiotracer techniques for functional neuroimaging with positron emission tomography. In: Thatcher, R.W., Halletr, M., Zeffro, T., John, E.R., Huerta, M. (Eds.), Functional Neuroimaging: Technical Foundations. Academic Press, San Diego. Ingber, L., 1991. Statistical mechanics of neocortical interactions: A scaling paradigm applied to electroencephalography. Phys. Rev. A 44(6), 4017-4060. Inouye, T., Toi, S., Matsumoto, Y., 1995. A new segmentation method of electroencephalograms by use of Akaike’s information criterion. Brain Res. Cogn. Brain Res. 3, 33-40. Inouye, T., Shinosaki, K., Yagasaki, A., Shimizu, A., 1986. Spatial distribution of generators of alpha activity. Electroencephalogr. Clin. Neurophysiol. 63, 353-360. Ivanitski, A.M., Podkletnova, I.M., Taratynova, G.M., 1990. Study of the dynamics of interregional cortical interaction during mental activity. Journal VND (Journal of Higher Nerve Activity) 40, 230-237 (In Russian). Ivanov, D.K., Posch, H.A., Stumpf, C., 1996. Statistical measures derived from the correlation integrals of physiological time series. Chaos 6, 243-253.
40
Jansen, B.H., Cheng, W.K., 1988. Structural EEG analysis: an explorative study. Int. J. Biomed. Comput. 23, 221-237. Jing, H., Takigawa, M, 2000. Comparison of human ictal, interictal and normal non-linear component analyses. Clin. Neurophysiol. 111, 1282-1292. Jung, R., 1953. Neurophysiologishe Untersuchungsmethoden. In: von Bergmann, G., Frey, W., Schwiegk, H., (Eds.), Handbuch der Inneren Medizin, vol. 1. Springer, Berlin, pp. 1216-1325. Kaiser, D.A., 2000. QEEG. State of the art, or state of confusion. J. Neurotherapy 1530017X, 4(2), 57-75. Kaplan, A.Ya., 1998. Nonstationary EEG: Methodological and experimental analysis. Uspehi Fiziologicheskih Nauk (Success in Physiological Sciences) 29(3), 35-55 (in Russian). Kaplan, A.Y., Fingelkurts, Al.A., Fingelkurts, An.A., Ivashko, R.M., Darkhovsky, B.S., 1997. Topological mapping of sharp reorganization synchrony in multichannel EEG. Am. J. Electroneurodiagnostic Technol. 37, 265-275. Kaplan, A.Ya., Fingelkurts, Al.A., Fingelkurts, An.A., Grin’, E.U., Ermolaev, V.A., 1999. Adaptive classification of dynamic spectral patterns of human EEG. Journal VND (Journal of Higher Nerve Activity) 49, 416-426 (in Russian). Kaplan, A.Y., Fingelkurts, An.A., Fingelkurts, Al.A., Borisov, S.V., Darkhovsky, B.S., 2005. Nonstationary nature of the brain activity as revealed by EEG/MEG: methodological, practical and conceptual challenges. Signal Processing 85, 2190-212. Keidel, M., Keidel, W.-D., Tirsch, W.S., Poppl, S.J., 1987. Studying temporal order in human CNS by menas of ‘runing’ frequency and coherence analysis. In: Rensing, L., an der Heiden, U., Mackey, M.C., (Eds.), Temporal disorder in human oscillatory systems, vol. 36. Springer series in synergetics, Springer, Berlin, pp. 57-68. Kelso, J.A.S., 1995. Dynamic patterns: The self-organization of brain and behavior. MIT Press, Cambridge, MA. Klimesch, W., 1999. EEG alpha and theta oscillations reflect cognitive and memory performance: a review and analysis. Brain Res. Rev. 29, 169-195. Klimesch, W., Doppelmayr, M., Wimmer, H., Gruber, W., Rohm, D., Schwaiger, J., Hutzler, F., 2001. Alpha and beta band power changes in normal and dyslexic children. Clin. Neurophysiol. 112, 1186–1195. Klimesch, W., Schack, B., Sauseng, P., 2005. The functional significance of theta and upper alpha oscillations. Exp. Psychol. 52, 99-108. Kooi, K.A., 1971. Fundamentals of electroencephalography. New York: Harper & Row Publishers. Kozma, R., Freeman, W.J., 2002. Classification of EEG patterns using nonlinear dynamics and identifying chaotic phase transitions. Neurocomputing 44, 1107-1112. Kozma, R., Puljic, M., Balister, P., Bollobas, B., Freeman, W.J., 2005. Phase transitions in the neuropercolation model of neural populations with mixed local and non-local interactions. Biol. Cyber. 92, 367-379. Lachaux, J.P., Rodriguez, E., Martinerie, J., Varela, F.J., 1999. Measuring phase synchrony in brain signals. Hum. Brain Mapp. 8, 194-208. Lakatos, P., Shah, A.S., Knuth, K.H., Ulbert, I., Karmos, G., Schroeder, C.E., 2005. An Oscillatory hierarchy controlling neuronal excitability and stimulus processing in the auditory cortex. J. Neurophysiol. 94, 1904–1911. Lazarev, V.V., 1997. On the intercorrelation of some frequency and amplitude parameters of the human EEG and its functional significance. Communication I: Multidimensional neurodynamic organization of functional states of the brain during intellectual, perceptive and motor activity in normal subjects. In.t J. Psychophysiol. 28, 77-98.
41
Leahy, R.M., Mosher, J.C., Spencer, M.E., Huang, M.X., Lewine, J.D., 1998. A study of dipole localization accuracy for MEG and EEG using a human skull phantom. Electroencephalogr. Clin. Neurophysiol. 107, 159-173. Lehmann, D., 1971. Multichannel topography of human alpha EEG fields. Electroencephalogr. Clin. Neurophysiol. 31, 439-449. Lehmann, D., Grass, P., Meier, B., 1995. Spontaneous conscious covert cognition states and brain electric spectral states in canonical correlations. Int. J. Psychophysiol. 19, 41-52. Lehmann, D., 1987. Principles of spatial analysis: Methods of analysis of brain electrical and magnetic signals. In: Gevins, A.S., Remond, A., (Eds.), EEG Handbook (revised series), vol.1, chapter 12. Elsevier Science Publishers B.V., pp. 309-354. Lennie, P., 2003. The cost of cortical computation. Curr. Biol. 13, 493–497. Levy, W.J., 1987. Effect of epoch length on power spectrum analysis of the EEG. Anesthesiology 66(4), 489-495. Livanov, M.N., 1984. Electroencephalogram rhythms and their functional significance. Gurnal Vischei Nervnoi Deyatelnosty (Journal of High Nerve Activity) 34, 613-626 (in Russian). Lopes da Silva, F.H., 1991. Neuronal mechanism underlying brain waves: from neuronal membranes to networks. Electroencephalogr. Clin. Neurophysiol. 79, 81-93. Lopes da Silva, F.H., 1996. The generation of electric and magnetic signals of the brain by local networks. In: Greger, R., Windhorst, U., (Eds.), Comprehensive Human Physiology, vol. 1. Springer-Verlag, pp. 509-528. Luria, A.R., 1973. The frontal lobes and the regulation of behavior. In: Pribram, K.H., Luria, A.R., (Eds.), Psychophysiology of the Frontal Lobes. Academic Press, New York, pp. 3– 26. Manmaru, S., Matsuura, M., 1989. Quantification of benzodiazepine-induced topographic EEG changes by a computerized waveform recognition method: application of a principal component analysis. Electroencephalogr. Clin. Neurophysiol. 72, 126-132. Mantini, D., Perrucci, M.G., Del Gratta, C., Romani, G.L., Corbetta, M., 2007. Electrophysiological signatures of resting state networks in the human brain. PNAS 104(32), 13170–13175. Manuca, R., Savit, R., 1996. Stationarity and nonstationarity in time series analysis. Physica D 99, 134-161. Matousek, M., Wackermann, J., Palus, P., 1995. Global dimensional complexity of the EEG in healthy volunteers. Neuropsychobiol. 31, 47-52. McEwen, J.A., Anderson, G.B., 1975. Modeling the stationarity and gaussianity of spontaneous electroencephalographic activity. IEEE Trans. Biomed. Engin. 22(5), 361369. Nunez, P.L., 1989. Generation of Human EEG by a Combination of Long and Short Range Neocortical Interactions. Brain Topogr. 1(3), 199-215. Nunez, P.L., 1995. Neocortical dynamics and human EEG rhythms. Oxford University Press, New York. Nunez, P.L., Srinivasan, R., Westdorp, A., Wijesinghe, R.S., Tucker, D.M., Silberstein, R.B., Cadusch, P.J., 1997. EEG coherency I: Statistics, reference electrode, volume conduction, laplacians, cortical imaging, and interpretation at multiple scales. Electroencephalogr. Clin. Neurophysiol. 103, 499-515. Palm, G., 1990. Cell assemblies as a guideline for brain research. Concepts in Neuroscience 1, 133-47. Pfurtscheller, G., Lopes da Silva, F.H., 1999. Event-related EEG/MEG synchronisation and desynchronisation: basic principles. Clin. Neurophysiol. 110, 1842-1857.
42
Propping, P., Kruger, J., Jonah, A., 1980. Effect of alcohol on genetically determined variants of the normal electroencephalogram. Psychiatry Res. 2, 85-98. Puljic, M., Kozma, R., 2003. Phase transitions in a probabilistic cellular neural network model having local and remote connections. IEEE 831-835. Pulvermüller, F., Preissl, H., Lutzenberger, W., Birbaumer, N., 1995. Spectral responses in the gamma-band: physiological signs of higher cognitive processes? NeuroReport 6, 2057–2064. Raichle, M.E., Gusnard, D.A., 2005. Intrinsic brain activity sets the stage for expression of motivated behavior. J. Comp. Neurol. 493, 167–176. Raichle, M.E., Mintun, M.A., 2006. Brain work and brain imaging. Annu. Rev. Neurosci. 29, 449–476. Raichle, M.E., Snyder, A.Z., 2007. A default mode of brain function: A brief history of an evolving idea. NeuroImage 37(4), 1083-1090. Raichle, M.E., MacLeod, A.M., Snyder, A.Z., Powers, W.J., Gusnard, D.A., Shulman, G.L., 2001. A default mode of brain function. PNAS 98, 676–682. Rechtschaffen, A., Kales, A., 1968. A manual of standardized terminology, techniques and scoring system for sleep stages in human subjects. Washington DC: Public Health Service, US Government, Printing Office. Robinson, P.A., Rennie, C.J., Wright, J.J., Bahramali, H., Gordon, E., Rowe, D.L., 2001. Prediction of electroencephalographic spectra from neurophysiology. Physical Review E 63, 021903-1–021903-18 Shishkin, S.L., 1997. Investigation of synchronisation of moments of sharp changes in alpha activity in human EEG. Ph.D. Dissertation. Moscow State University, Moscow, pp. 241 (In Russian). Shishkin, S.L., Brodsky, B.E., Darkhovsky, B.S., Kaplan, A.Ya., 1997. EEG as a nonstationary signal: an approach to analysis based on nonparametric statistics. Hum Physiol (Fiziologia Cheloveka) 23(4), 124-126 (in Russian). Shulman, R.G., Rothman, D.L., Behar, K.L., Hyder, F., 2004. Energetic basis of brain activity: implications for neuroimaging. Trends Neurosci. 27, 489–495. Sokolov, E.N., 1963. Higher nervous functions: the orienting reflex. Annu. Rev. Physiol. 25, 545–580. Stam, C.J., 2005. Nonlinear dynamical analysis of EEG and MEG: Review of an emerging field. Clin. Neurophysiol. 116, 2266–2301. Steriade, M., Amzica, F., 1996. Intracortical and corticothalamic coherency of fast spontaneous oscillations. Proc. Natl. Acad. Sci. U. S. A. 93, 2533-2538. Steriade, M., Amzica, F., Contreras, D., 1996. Synchronization of fast (30-40 Hz) spontaneous cortical rhythms during brain activation. J. Neurosci. 16, 392-417. Sviderskaya, N.E., Korol’kova, T.A., 1997. Spatial organization of electrical processes in the brain: Problems and solutions. Journal VND (Journal of Higher Nerve Activity) 47, 792811 (In Russian). Tass, P.A., 1999. Phase resetting in medicine and biology. Springer, Berlin, pp. 247-248. Thatcher, R.W., 2001. Normative EEG databases and EEG biofeedback. J. Neurother. 2-4, 129. Thatcher, R.W., John, E.R., 1977. Functional Neuroscience, vol. 1: Foundations of Cognitive Processes. Lawrence Erlbaum, New York. Thatcher, R.W., Krause, P.J., Hrybyk, M., 1986. Cortico-cortical associations and EEG coherence: a two-compartmental model. Electroencephalogr. Clin. Neurophysiol. 64, 123143.
43
Tirsch, W.S., Keidel, M., Poppl, S.J., 1988. Computer-aided detection of temporal patterns in human CNS dynamics. In: Willems, J.L., van Bemmel, J.H., Michel, J., (Eds.), Progress in computer-assisted function analysis. Elsevier, North Holland, pp. 109-118. Tsodyks, M., Kenet, T., Grinvald, A., Arieli, A., 1999. Linking spontaneous activity of single cortical neurons and the underlying functional architecture. Science 286, 1943–1946. Uhtomskiy, A.A.,1966. The dominant. Nauka, Leningrad. Verstraeten, E., Cluydts, R., 2002. Attentional switching-related human EEG alpha oscillations. Neuroreport 13, 681-684. von der Malsburg, C., 1999. The what and why of binding: the modeler’s perspective, Neuron 24, 95-104. Wackermann, J., Allefeld, C., 2007. On the meaning and interpretation of global descriptors of brain electrical activity. Including a reply to X. Pei et al. Int. J. Psychophysiol. 64: 199– 210. Wada, M., Ogawa, T., Sonoda, H., Sato, K., 1996. Development of relative power contribution ratio of the EEG in normal children: A multivariate autoregressive modeling approach. Electroencephalogr. Clin. Neurophysiol. 98, 69-75. Wallenstein, G.V., Kelso, J.S.A., Bressler, S.L., 1995. Phase transitions in spatiotemporal patterns of brain activity and behaviour. Physica D: Nonlinear Phenomena 84(3-4), 626634. Ward, L.M., Doesburg, S.M., 2009. Synchronization analysis in EEG and MEG. In: Handy, T.C., (Ed.), Brain signal analysis. Advances in neuroelectric and neuromagnetic methods. The MIT Press, Massachusetts, pp. 171-204. Werner, G., 2007. Metastability, criticality and phase transitions in brain and its models. Biosystems 90, 496–508. Whitham, E.M., Pope, K.J., Fitzgibbon, S.P., Lewis, T., Clark, C.R., Loveless, S., Broberg, M., Wallace, A., De LosAngeles, D., Lillie, P., Hardy, A., Fronsko, R., Pulbrook, A., Willoughby, J.O., 2007. Scalp electrical recording during paralysis: Quantitative evidence that EEG frequencies above 20 Hz are contaminated by EMG. Clin. Neurophysiol. 118, 1877–1888. Whitham, E.M., Lewis, T., Pope, K.J., Fitzgibbon, S.P., Clark, C.R., Loveless, S., DeLosAngeles, D., Wallace, A.K., Broberg, M., Willoughby, J.O., 2008. Thinking activates EMG in scalp electrical recordings. Clin. Neurophysiol. 119, 1166-1175. Xu, J., Liu Zeng-ron, Liu Ren, Yang Qing-Fei., 1997. Information transmission in the human cerebral cortex. Physica D 106, 363-374. Yuval-Greenberg, S., Tomer, O., Keren, A.S., Nelken, I., Deouell, L.Y., 2008. Transient Induced Gamma-Band Response in EEG as a Manifestation of Miniature Saccades. Neuron 58, 429-441.