Water Air Soil Pollut (2013) 224:1511 DOI 10.1007/s11270-013-1511-7
Topographical Influences on the Spatial Distribution of Soil Mercury at the Catchment Scale Thushara Gunda & Todd M. Scanlon
Received: 21 September 2012 / Accepted: 26 February 2013 / Published online: 15 March 2013 # Springer Science+Business Media Dordrecht 2013
Abstract Inorganic forms of mercury (Hg) can be converted by natural processes into methylmercury, a highly potent neurotoxin that can bioaccumulate in food chains and pose a risk to human health. Although Hg can enter aquatic environments through direct deposition, the predominant source derives from complex terrestrial cycling in nearby ecosystem vegetation and soils. Here we assess the spatial distribution of soil and litterfall Hg within two paired catchments of the Shenandoah National Park: the northwest-facing North Fork Dry Run (NFDR) and the southeast-facing Hannah Run (HR) catchments. Litterfall Hg concentrations were not significantly different between the NFDR and HR catchments. This may be attributable to the speciation of Hg (gaseous elemental Hg) that is involved in leaf-level accumulation. Significant differences in soil organiclayer Hg concentrations were observed between the two study catchments, with NFDR soils having roughly 50 % higher Hg concentrations than those from HR. These differences can be explained by differences in soil N content (and to a lesser extent soil C content) between catchments, as both elements exert a strong control of the amount of Hg bound in soils. We found no evidence that topographic aspect contributes to the spatial T. Gunda : T. M. Scanlon (*) Department of Environmental Sciences, University of Virginia, Charlottesville, VA 22904, USA e-mail:
[email protected] T. Gunda Now at Department of Civil and Environmental Engineering, Vanderbilt University, Nashville, TN 37232, USA
variability of soil Hg concentrations in these paired catchments, but did detect an influence from elevation. Soils located near ridges in mountainous catchments can contain relatively high Hg concentrations due to (1) lower turnover rates in soil organic matter pools, (2) enhanced deposition, and (3) limited mobilization of Hg from those areas. Keywords Mercury . Watershed . Soil . Litterfall . Elevation
1 Introduction High volatility and atmospheric mobility are factors that contribute to mercury (Hg) being a global pollutant (Schwesig et al. 1999; Grigal 2003). Levels of Hg in the environment have increased by approximately three-fold over the last century as a result of human activities (Fitzgerald 1995). This increased abundance poses a concern since inorganic forms of Hg can be converted by naturally occurring biological processes into the highly potent neurotoxin methylmercury (MeHg) (Schroeder and Munthe 1998), which has the potential to bioaccumulate in ecosystems, especially in aquatic environments (Schroeder and Munthe 1998; Ravichandran 2004; Biswas et al. 2007; Driscoll et al. 2007). Although Hg can enter aquatic environments through direct deposition, it predominantly tends to be introduced through mobilization of Hg deposited to nearby terrestrial sources (Grigal et al. 2000). Therefore, understanding the complex intermediate Hg cycling in vegetation and soils is crucial to predicting its transport to water bodies and potential
1511, Page 2 of 13
introduction into food chains (Xu et al. 2000; Moore and Carpi 2005). Previous studies have characterized Hg cycling with respect to forest type (Demers et al. 2007; Johnson et al. 2007), soil type (Schwesig et al. 1999; Natali et al. 2008), and fire history (Amirbahman et al. 2004; Biswas et al. 2007). However, less attention has been paid to the spatial distribution of Hg within catchments, which ultimately affects its potential for mobility from terrestrial environments to streams and lakes. This study aims to characterize the role of topographical factors in governing the spatial variability of Hg accumulation in litterfall and soils. Atmospheric Hg derives from natural sources including wildfires, volcanoes, and geothermal sources, but a greater portion derives from anthropogenic sources such as coal-fired power plants, medical/municipal waste incineration, and manufacturing/smelting, which release close to 3,000 tons of Hg/year worldwide (Pirrone et al. 1996; Pai et al. 2000; Yan et al. 2003). Atmospheric Hg occurs in three primary forms: gaseous elemental mercury (Hg(0)g), reactive gaseous mercury (Hg(II)g), and particulate mercury (Hgp) (Prestbo and Gay 2009; Zhang et al. 2009). Hg(0)g is typically much more abundant compared with the other forms (Pai et al. 2000; Fang et al. 2001). It is well mixed and can persist for an estimated 6 to 12 months in the atmosphere (Lin and Pehkonen 1999), making long-range transport possible for this species. Hg(II)g and Hgp, on the other hand, are predominantly released from anthropogenic sources and have much shorter lifetimes in the atmosphere (ranging from days to weeks), and the abundance of these species in the atmosphere can be strongly influenced by proximity to sources such as coal-fired power plants (Lindberg and Stratton 1998). Atmospheric deposition of Hg in catchments can occur in either wet or dry forms. Wet deposition refers to Hg that reaches the surface through rain or snow. Dry deposition encompasses all other deposition to surfaces during non-precipitation periods (Grigal 2002). Various studies have demonstrated that dry deposition can account for more than 50 % of the total deposition to landscapes (Cohen et al. 2004; Miller et al. 2005), making this an important pathway for Hg accumulation in the environment. In mountainous catchments, rates of dry deposition can vary depending on the presence or lack of vegetation (Miller et al. 2005). This is because forest canopy can effectively scavenge Hg from the atmosphere due to its high surface area, which is enhanced by mountainous topography (Miller et al. 2005;
Water Air Soil Pollut (2013) 224:1511
Johnson et al. 2007). Dry deposited Hg may be washed off plant surfaces as throughfall and stemflow (Schroeder and Munthe 1998) or may accumulate within leaves. Upon senescence, the Hg that remains in the leaves can reach the forest floor via litterfall, representing a significant source of Hg deposition in humid, forested landscapes (St. Louis et al. 2001; Rea et al. 2002; Demers et al. 2007). 1.1 Mercury in Litterfall Mercury is known to accumulate in vascular plants through three possible mechanisms: (1) through the roots as ionic or dissolved gaseous Hg, (2) through the stomata from the atmosphere as Hg(0)g, or (3) through foliar adsorption of Hg(II)g and Hgp (Leonard et al. 1998; Ericksen and Gustin 2004). Recent research has suggested that cuticular diffusion of Hg(0)g may also be a significant pathway for accumulation in plant leaves (Stamenkovic and Gustin 2009; Converse et al. 2010). Studies have revealed that less than 10 % of annual Hg deposition in litterfall has been attributed to root uptake and subsequent sequestration in leaves, while almost all of the Hg in foliar tissue originates from the dry deposition of atmospheric Hg species (Hanson et al. 1995; Bishop et al. 1998; Grigal 2002; Rea et al. 2002; Ericksen et al. 2003; Ericksen and Gustin 2004). Foliar Hg concentration varies as a function of age and vegetation type. Hg concentration in leaves tends to increase as a function of leaf age and progression through the growing season (Rea et al. 2002), although others have found Hg concentrations to level off several months after leaf emergence (e.g., Ericksen et al. 2003). Studies conducted by Sheehan et al. (2006) and Johnson et al. (2007) revealed that softwood trees such as red spruce and balsam fir have a higher scavenging efficiency (i.e., accumulate more Hg per unit surface area) than hardwood species such as American birch, sugar maple, and quaking aspen. Litterfall tends to be the dominant form of Hg deposition in forested watersheds, surpassing precipitation, and throughfall (Rea et al. 2000). This is especially the case for deciduous forests, as annual litterfall mass is greater than in coniferous forests (Ericksen et al. 2003). 1.2 Mercury in Soil Once leaves senesce and fall to the forest floor, they become a source of Hg to the underlying soils
Water Air Soil Pollut (2013) 224:1511
(Ericksen et al. 2003). Soil Hg concentrations are also influenced by wet and direct dry deposition onto the soil surface (Grigal 2003). The Hg added into the soil can either be stored, volatilized, or mobilized. Soils, often considered to be a net “sink” for the Hg pool, play a crucial role in Hg storage, accounting for up to 90 % of Hg in forests, with the remainder in living vegetation (Schroeder and Munthe 1998; Grigal 2003; Ericksen et al. 2006). The mineral layer typically contains an estimated four to five times the mass of Hg compared to the organic layer (Grigal 2003). However, it is the organic soil layer that often scavenges recent mercury input to the ecosystem, as indicated by higher Hg concentrations found in this layer (Arfstrom et al. 2000; Matilainen et al. 2001; Friedli et al. 2007). Numerous factors can influence Hg volatilization from the organic layer, including sunlight, which can act as a reducing agent (Zhang and Lindberg 2001), temperature, which affects the vapor pressure of volatile Hg species and rate of chemical reactions (Schlüter 2000), and soil water content, which influences the availability of Hg binding sites (Gustin and Stamenkovic 2005). The quality of the soil itself (i.e., soil organic matter (SOM) content, pH, and texture) is another factor that governs the amount of Hg stored versus the amount volatilized (Grigal 2002). SOM and Hg interact strongly with each other; their interactions can greatly influence the transport, transformation, and mobility of Hg (Ravichandran 2004). As a soft metal, Hg preferentially binds to ligands of sulfur, which is often present in SOM. This chemical bond helps stabilize Hg in the soil system and inhibits volatilization into the atmosphere (Skyllberg et al. 2000; Schlüter 2000). Changes in soil pH alter not only the speciation of Hg in soil water but can also change soil characteristics. As pH of the soil increases, more Hg is released from the soil due to decreasing affinity of Hg to its binding groups in the organic matter. Volatilization of Hg in soils is also influenced by the soil texture such as the amount and shape of pore space and porosity of soil particles. Clay content plays a key role since this texture often provides more binding/stabilizing sites for Hg (Schlüter 2000). In general, higher Hg volatilization rates are associated with higher soil pH and lower clay and SOM contents (Schlüter 2000). Acidic, finer-textured, drier, and more organic-rich soils tend to accumulate more Hg (Zhang and Lindberg 1999), and the accumulated Hg is
Page 3 of 13, 1511
predominantly complexed with SOM (Zhang and Lindberg 1999; Schwesig and Matzner 2000; Skyllberg et al. 2000; Grigal 2003; Biswas et al. 2007). Given this complexation, the mobilization of Hg from soil to stream is influenced by the same factors involved in the mobilization of organic matter. Evidence for this can be found in the high degree of correlation between stream water concentrations of dissolved Hg and dissolved organic carbon (DOC) observed over a range of discharge conditions (e.g., Bishop et al. 1995; Dittman et al. 2010; Riscassi and Scanlon 2011). Concentrations are typically elevated during high-flow conditions, when dissolved organic carbon is “flushed” from organic-rich upper soil layers (e.g., Boyer et al. 1997) as a result of shallow subsurface stormflow (Freeze 1972; Scanlon et al. 2000) or a rising water table that approaches the surface (Hewlett and Hibbert 1967; Creed and Band 1998). In either case, source areas for the mercury supplied to streams during high-flow events are primarily situated in lowlying areas of catchments, in the vicinity of the stream network. 1.3 Objectives of Study Quantifying the distribution of mercury in litterfall and soil is a necessary step in understanding the cycling and fate of Hg in forested ecosystems (Demers et al. 2007). At present, studies have predominantly focused on either the role of vegetation type (Ericksen et al. 2003; Sheehan et al. 2006; Demers et al. 2007) or soil history (Johnson et al. 2007) on Hg sequestration. Less attention has been given to how Hg in litterfall and soils varies spatially within catchments, and what role topography, hydrology, and prevailing wind conditions may have in modifying these distributions. The role of topographic aspect has been noted by Johnson et al. (2007), who found that throughfall deposition rates of Hg were higher in southwest-facing sampling sites than in south, east, or southeast-facing sites within two catchments in Maine. They attributed this to differences in vegetation types as well as topographic orientation (aspect) of the sites. In addition to containing more softwood species, the catchment with the higher Hg concentrations in throughfall also faced to the southwest and intercepted the prevailing, more polluted westerly winds (Johnson et al. 2007). Studies have yet to identify if aspect may play a role in the distribution of Hg in litterfall and soils.
1511, Page 4 of 13
Drawing on the study by Johnson et al. (2007), west-facing slopes in Shenandoah National Park (SNP), Virginia may be expected to have greater Hg accumulation due to the prevailing wind conditions and the geographical distribution of Hg sources (i.e., coal-fired power plants to the west, concentrated in the Ohio River Valley). We focus on leaf litter and organic soil concentrations, which are influenced both by the rates of deposition as well as the subsequent Hg volatilization and mobilization. The specific objectives of this paper are: (1) to compare the Hg distributions in leaves and soils between two paired catchments that have differing aspects, (2) to characterize the spatial variability of leaf litter and soil Hg within these catchments, and (3) to provide insights into the role of topographic and biophysical factors in controlling Hg accumulation within forested catchments.
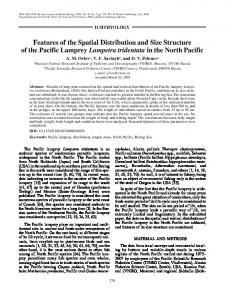
2 Methods 2.1 Site Description The annual precipitation for the SNP study area is approximately 132 cm, with snowfall typically accounting for less than 10 % of this amount. Winds are predominantly from the west and southwest. The climate is seasonal, with monthly mean temperatures ranging from −4 °C in January to 19 °C in July (Buffam et al. 2001; Lawrence and Hornberger 2007). Storms occur throughout the year and typically track from the west and head toward the northeast (Buffam et al. 2001). Two paired catchments in SNP with contrasting aspects, northwest-facing North Fork Dry Run (NFDR) and southeast-facing Hannah Run, were chosen for our study (Fig. 1). Multiple factors aside from varying aspects influenced the selection of these paired catchments. Similarities in elevation, vegetation type, catchment size, underlying geology, and latitude were also considered. Both NFDR and Hannah Run catchments are roughly 2 km2 in area, have a mean elevation of ∼800 m, and a mean slope of 23° (Table 1). In addition, deciduous trees underlain by granitic soils dominate both catchments (Gathright 1976; Young et al. 2006). A stratified random sampling design was used to select accessible sites within each catchment. TOP
Water Air Soil Pollut (2013) 224:1511
MODEL topographic index (TI; TI=ln(a)/tan(β), where a is the upslope contributing area per unit contour width and β is the local slope), which characterizes the likelihood of soils being saturated (Beven and Kirkby 1979), was used to divide the catchment into three classes of equal area. These regions are roughly delineated by steep regions proximal to the ridges (TI values 4.2–5.8), intermediate regions (TI values 5.8–6.9), and flatter regions proximal to the streams (TI values 6.9–15). Within each TI-defined region, five sites were randomly selected for a total of 15 sites per catchment. 2.2 Sample Collection Litterfall basins, measuring 46 by 46 cm, were deployed in late October 2008, approximately 1 month prior to peak litterfall in SNP. Plastic mesh was stretched over thin wooden frames to construct these basins. A total of 90 basins were deployed, with three basins at each of the 30 sites. At each site, triplicates of litterfall samples were collected on November 22, 2008 during a rain-free period to avoid leaching of Hg during sample collection and preservation (Demers et al. 2007). All sample collection was conducted using a modified clean hands/dirty hands EPA protocol (1996), as in Johnson et al. (2007). One basin was demolished by wildlife, leaving a total of 89 litterfall samples that were double-bagged in polyethylene bags for transport from the field and were frozen until analysis, following the approach of Sheehan et al. (2006) and Demers et al. (2007). At each site, triplicates of soil organic matter were sampled within a meter of each of the litterfall basins. The upper 5 cm of soil, spanning the organic horizon, was collected by using plastic trowels and placed into double plastic bags (Skyllberg et al. 2000). A few of the sites were located among rocky boulders, and thus, collection of soil samples from the area was not feasible. Immediately after collection, the 85 soil samples were sieved through a 2mm plastic screen to remove large rocks and sticks before being frozen until analysis (Demers et al. 2007). 2.3 Sample Processing and Analysis All leaves from each basin were identified at the species level. A smaller, representative portion of the
Water Air Soil Pollut (2013) 224:1511
Page 5 of 13, 1511
Fig. 1 Locations of the North Fork Dry Run (NFDR) and Hannah Run (HR) catchments, both within Shenandoah National Park, Virginia, USA
litterfall samples were ground with an acid-cleaned mortar and pestle, digested in hot nitric acid, diluted in 5 % BrCl, and analyzed using EPA Method 1631 in a Tekran 2600 Cold Vapor Atomic Fluorescence Spectrometer (CVAFS) (Olson and DeWild 1999). The detection limit of the CVAFS was 0.19 ng/l. Peach leaves (NIST SRM #1547) were used as a standard to verify quality assurance; the observed Hg concentrations of the standard were continuously within the range of known value of 0.031±0.007 μg/g. All data were blank corrected with system and method blanks to ensure quality control. Table 1 Physical characteristics of the NFDR and HR catchments NFDR
HR
Area (km2)
2.32
1.72
Mean elevation (m)
860
778
Mean slope (deg)
23
23
Hg concentrations in soil samples were analyzed according to the procedures outlined by Tekran (Applications Note: AN2600-2). Soil samples were digested in 10 mL of a 4:1 mixture of concentrated H2SO4/HNO3 followed by dilution in BrCl. Similar to litterfall analysis, EPA Method 1631 was used to analyze the aqueous solutions for Hg concentration. Additional tests performed on the soil samples included the determination of pH, soil texture, carbon (C), and nitrogen (N) content. A 2:1 soil/deionized water slurry was made to measure the soil pH of each sample with an Orion sure-flow pH electrode. Soil texture was determined by aggregating all of the sample material within each catchment since a high volume of material is needed for the hydrometer method (Bouyoucos 1962). Total C and N content in soils was also analyzed using a Carlo Erba 1160. All statistical analysis was calculated using SPSS version 18.0. For both the leaf and soil samples, analysis of variance (ANOVA) was used to determine if
1511, Page 6 of 13
Water Air Soil Pollut (2013) 224:1511
there were statistically significant differences between the two catchments. The ANOVA tests were applied to the populations of the 14–15 measurements made in each catchment. Linear regression and Student’s t test analyses were conducted to determine the correlation and level of significance of any relationships between Hg concentrations and various topographic and soil chemical predictor variables. ANOVA was also applied to look for differences in pH, g C/g soil, and g N/g soil between catchments. For soils, an analysis of covariance was conducted to determine if any differences in soil Hg concentrations between catchments could be attributable to sampling biases. All statistical tests were deemed significant if p0.05) in litterfall Hg concentrations between the two catchments.
Fig. 2 a Litterfall and b soil Hg concentrations measured within the two study catchments. Bars show ±1 standard error from the means. While litterfall Hg concentrations were similar between the two catchments, significant differences were observed in soil Hg concentrations (p