Topological Properties of Stock Networks Based on Random Matrix Theory in Financial Time Series Cheoljun Eom,1, ∗ Gabjin Oh,2 Hawoong Jeong,3 and Seunghwan Kim2 1
Division of Business Administration,
arXiv:0709.2209v1 [q-fin.ST] 14 Sep 2007
Pusan National University, Busan 609-735, Korea 2
NCSL, Department of Physics, Pohang University of Science and Technology,
Pohang, Gyeongbuk, 790-784, Korea & Asia Pacific Center for Theoretical Physics, Pohang, Gyeongbuk, 790-784, Korea 3
Department of physics, Korea Advanced Institute
and Science and Technology, Daejeon 305-701, Korea
Abstract We investigated the topological properties of stock networks through a comparison of the original stock network with the estimated stock network from the correlation matrix created by the random matrix theory (RMT). We used individual stocks traded on the market indices of Korea, Japan, Canada, the USA, Italy, and the UK. The results are as follows. As the correlation matrix reflects the more eigenvalue property, the estimated stock network from the correlation matrix gradually increases the degree of consistency with the original stock network. Each stock with a different number of links to other stocks in the original stock network shows a different response. In particular, the largest eigenvalue is a significant deterministic factor in terms of the formation of a stock network. PACS numbers: 89.65.Gh, 89.75.Fb, 89.75.Hc Keywords: econophysics, stock network, minimal spanning tree, random matrix theory
∗
Electronic address:
[email protected]
1
I.
INTRODUCTION
The financial market has been known to be the representative complex system which forms a pricing mechanism according to the interaction between various assets. In order to understand the pricing mechanism of a financial market, we need to understand the interaction between assets traded on the market. A correlation matrix is the representative measurement used to quantify the interaction between assets in the field of finance. However, because the correlation matrix reflects the dynamic properties of financial markets which are formed by the process of creation, growth, and decline of various assets, the analysis and classification of the significant interactions between assets from the correlation matrix is very difficult to undertake. Theories and methods created to improve this problem have been introduced in the past. Among these, the random matrix theory (RMT), which is able to remove random properties from the correlation matrix, was introduced as well as applied to the field of finance [1-2]. In addition, a stock network method based on the minimal spanning tree (MST) method, which extracts the significant information from the correlation matrix in viewpoint of the classification of the connected relationship between stocks, was introduced and applied to the field of financial research [3-4]. According to correlation matrixes having various properties created from the RMT method and applied to stock networks, we empirically investigated the topological properties of stock networks. Some previous researchers have investigated the topological properties of stock networks using created data from a pricing model, widely acknowledged in financial literature. Major pricing models include the one-factor model [5], three-factors model [6], and multi-factors model [7]. The purpose of the previous studies was to discover the possible deterministic factors which have significantly influenced the formation of a stock network [8-13]. Stock network methods based on the MST method use the correlation matrix as an input variable. Therefore, after creating a correlation matrix having various eigenvalue properties calculated by the RMT method, we exhibit the stock networks using those as an input variable. We investigated the topological properties of stock networks through a comparison of the original stock networks with the estimated stock networks. We used the individual stocks traded on the representative stock market indices of Korea, Japan, Canada, the USA, Italy, and the UK, respectively. We discovered that as the correlation matrix reflects the more eigenvalue property, the estimated stock network from the corre2
lation matrix gradually increases the degree of consistency with the original stock network. The interesting point is that each stock with a different number of links to other stocks in the original stock network shows a different response. When we did not include the property of the largest eigenvalue in the correlation matrix estimated by RMT, even though it reflected all eigenvalue properties except the largest eigenvalue, the estimated stock network could not adequately explain the formation of an original stock network. These results suggest that the largest eigenvalue is a significant deterministic factor in terms of the formation of a stock network. In the next section, we describe the data and methods of the verification process used in this paper. In section III, we present the results obtained according to our research aims. Finally, we summarize the findings and conclusions of the study.
II.
DATA AND METHODS
A.
Data
To investigate the properties of stock networks by using the RMT method, we used the individual stocks traded on the representative stock market indices of Korea, Japan, Canada, the USA, Italy, and the UK, respectively. That is, we used the daily prices of 127 stocks in the KOSPI 200 index of the Korean stock market, 202 stocks in the Nikkei 225 of Japan, 118 stocks in the TSX of Canada, 378 stocks in the S&P 500 of the USA, 111 stocks in the Milan Comit of Italy, and 69 stocks in the FTSE 100 of the UK. The individual stocks that had daily prices for the last 15 years, from January 1992 to December 2006, were selected from each country. The returns, Rt , are calculated by the logarithmic change of the price, Rt = ln(Pt ) − ln(Pt−1 ), where Pt is the stock price at day t.
B.
Methods
The test procedure in this paper can be explained by the following three steps. First, we determined input data that is needed to create a stock network. That is, we determined the estimation process of a correlation matrix reflecting various eigenvalue properties estimated by the RMT method. Second, we created a stock network using the MST method. Third, we calculated the survivor ratio to compare stock networks. 3
In the first step, we examine the estimation process of a correlation matrix reflecting various eigenvalue properties estimated by the RMT method. It is not difficult to create a correlation matrix having various eigenvalue properties as the number of stocks N using the RMT method. Using the eigenvalue, λS(i) , and eigenvector, VS(i) , we estimated the correlaS(i)
T tion matrix, Ci=1 = λS(i) .VS(i) .VS(i) , reflecting various eigenvalue properties, i = 1, 2, · · · , N.
That is, among the eigenvalues estimated by the RMT method, we repeatedly created a correlation matrix reflecting the properties of eigenvalues included in each range, S(i) = 1 ∼ i, from the fixed starting point of the largest eigenvalue, λi=1 , to the minimum eigenvalue, S(1)
λi=N . For example, Ci=1 is a correlation matrix reflecting only the largest eigenvalue propS(N )
erty, while Ci=1
is a correlation matrix reflecting the eigenvalues within the ranges from S(N )
the largest eigenvalue to the smallest eigenvalue. That is, Ci=1
is a correlation matrix
reflecting all the eigenvalues; therefore, this correlation matrix in the last range is the same as those created using the real stock returns. In the second step, we examine the creation process of stock networks by using the MST method. The stock network visually displays the significant N − 1 links among all possible links, N(N − 1)/2, based on the correlation matrix between stocks. It does this by using the MST method. We created two-type stock networks according to our research purposes. The stock networks are the original stock network, NetO , using the correlation matrix estimated from the actual stock return, Rj , and the estimated stock network, NetE i , S(i)
using the correlation matrix, Ci=1 , created by the RMT method. In order to create a stock p network, the metric distance, di,j = 2(1 − ρi,j ), relates the distance between two stocks to their correlation coefficient, ρi,j [14]. In our study, the MST is the spanning tree of the shortest length using the Kruskal algorithm [15]. Therefore, it is a graph without a cycle connecting all nodes with links. The correlation coefficient can vary between −1 ≤ ρi,j ≤ +1, while the distance can vary between 0 ≤ di,j ≤ 2. Here, small values imply strong correlations between stocks. In the third step, we calculated the survivor ratio to measure the degree of consistency between the original stock network and the estimated stock network by utilizing the RMT P T O O method. The survivor ratio, rs,L≥k ≡ 1/M M NetE L )]/[F Qj (NetL )], is j=1 [F Qj (NetL a ratio of frequency showing that stocks such as F Qj [NetO L ] that are directly linked with a specific stock, j, in the original stock network have the same links with those in the T estimated stock network, F Qj [NetO NetE L L ]. This is the case among the number of M 4
stocks with more than degree, k = 1, 2, · · · , Max, in the original stock network [13, 16]. Here, the survivor ratio can vary between 0.0 ≤ rs ≤ 1.0. If rs = 0, two stock networks have a completely different structure; however, if rs = 1, they have the same structure. We calculated the survival ratio according to the various number of links tp other stocks in the original stock network, L ≥ k. Thus, the observation that there is an increase in the number of links makes it possible to confirm whether stocks having a number of links different from those of other stocks are influenced differently by correlations having various eigenvalue properties.
III.
RESULTS
In this section, we present the observed results for stock network properties using the RMT method. Using the N individual stocks traded on the stock market index of each country, we estimated the stock network by utilizing the MST method. We estimated the S(i)
correlation matrix, Ci=1 , reflecting various eigenvalue properties as well as the individual stock numbers of each country. In addition, we investigated whether the largest eigenvalue property estimated by the RMT plays an important role in terms of the formation of a stock network. That is, we tested the original stock network and compared it to the estimated stock network from the correlation matrix reflecting all the eigenvalue properties except the largest eigenvalue. In order to calculate the degree of consistency between the original stock network and the estimated stock network, we used the survivor ratio, rs . The results are presented in Fig. 1. In Fig. 1, the x-axis indicates the number of eigenvalues. The axis x denotes the normalized number of eigenvalues, L∗ = (Li −LM in )/(LM ax − LM in ) − 1, from -1 to +1 using the minimum, LM in , and maximum, LM ax , of the number of eigenvalues of each country. This is because the number of eigenvalues for each country is different. Axis y represents the average of the survivor ratio. Fig. 1(a) shows that the survivor ratio of stocks having a number of links to other stocks is more than one, L ≥ 1. It represents a degree of consistency for all stocks which exist in a network. Fig. 1(d) is the survivor ratio of stocks having the largest number of links, L ≥ Max; therefore, it shows a degree of consistency for stocks having the greatest number of links in a network. Figs. 1(c) and 1(d) are the same as Figs. 1(a) and 1(b), respectively. The difference is that the fixed starting point of the eigenvalue used to estimate the correlation matrix is the second largest 5
(a)
(b)
Normalized number of eigenvalue
Normalized number of eigenvalue
(c)
(d)
Normalized number of eigenvalue
Normalized number of eigenvalue
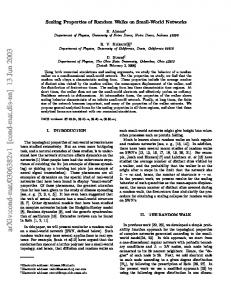
FIG. 1: Figs. 1(a) and (b) show the survivor ratio between the estimated stock network from the RMT and the original stock network. (a) shows that the survivor ratio of stocks having a number of links to other stocks is greater than one. (b) is the survivor ratio of stocks having the largest number of links. Figs. 1(c) and (d) are the same as Figs. 1(a) and (b), respectively. The difference is that the fixed starting point of the eigenvalue used to estimate the correlation matrix is the second largest eigenvalue. That is, we did not include the largest eigenvalue property. We normalized the number of eigenvalues from -1 to +1 using the maximum and minimum number of eigenvalues of each country, because the number of eigenvalues for each country is different. The circles (red), triangles (magenta), diamonds (cyan), stars (blue), squares (green), and pentagrams (black) indicate Korea, Japan, Canada, the USA, Italy, and the UK, respectively.
eigenvalue, λi=2 . That is, we did not include the largest eigenvalue property. The circles (red), triangles (magenta), diamonds (cyan), stars (blue), squares (green), and pentagrams (black) indicate Korea, Japan, Canada, the USA, Italy, and the UK, respectively. According to the results, regardless of the data, as the correlation matrix reflects the more eigenvalue property, the estimated stock network from the correlation matrix gradually increases the degree of consistency with the original stock network [Fig. 1a]. The interesting
6
point is that in Fig. 1(b), stocks having the largest number of links show a significant change before and after the eigenvalue range, λRM ≤ λi ≤ λRM − + . This is predicted by the RMT, where λRM and λRM are maximum and minimum eigenvalues of the RMT, respectively. + − That is, when the correlation matrix includes the eigenvalue properties deviating from the range, λRM < λi ≤ λi=1 , the survivor ratio increases rapidly. Significantly, the survivor ratio + decreases as the correlation matrix reflects the more eigenvalue property within the ranges, while the survivor ratio increases again as the correlation matrix reflects the more eigenvalue property within the range, λi=N ≤ λi < λRM − . These results suggest that each stock with a different number of links to other stocks in the original stock network exhibits different behavior in terms of the correlation matrix reflecting various eigenvalue properties. In Fig. 1(c), although the correlation matrix reflects all the eigenvalue properties except the largest eigenvalue, the estimated stock network can explain 40 ∼ 60% of the interactions between stocks with the original stock network. In particular, in Fig. 1(d), stocks having the largest number of links directly influence the largest eigenvalue property because the survivor ratio is 0. These results suggest that the largest eigenvalue, which reveals the market index as a representative single factor in the financial literature, is a significant deterministic factor in terms of the formation of a stock network. However, we also found that this property alone cannot sufficiently explain the interaction between stocks.
IV.
CONCLUSIONS
We investigated the topological properties of stock networks through a comparison of the original stock networks with the estimated stock networks using a correlation matrix having various eigenvalue properties calculated by the RMT method. We used the individual stocks traded on the representative stock market indices of Korea, Japan, Canada, the USA, Italy, and the UK, respectively. Regardless of the data of the countries involved, as the correlation matrix reflects the more eigenvalue property, the estimated stock network from the correlation matrix gradually increases the degree of consistency with the original stock network. The interesting point is that each stock with a different number of links to other stocks in the original stock network shows a different response before and after the range of eigenvalues predicted by the RMT. In particular, when we did not include the property of the largest eigenvalue in the correlation matrix estimated by RMT, although it 7
reflected all eigenvalue properties except the largest eigenvalue, the estimated stock network could not adequately explain the formation of an original stock network. Through these results, we have demonstrated that the largest eigenvalue, which reveals the market index as a representative single factor in the field of finance, must be a significant deterministic factor in terms of the formation of a stock network. However, the properties of the largest eigenvalue alone cannot fully explain the interaction between stocks.
[1] L.Laloux, P.Cizeau, J.P.Bouchaud, and M.Potters, Phys. Rev. Lett. 83 (1999) 1467. [2] V.Plerou, P.Gopikrishnan, B.Rosenow, L.A.Amaral, and H.E.Stanley, Phys. Rev. Lett. 83 (1999) 1471. [3] R.N.Mantegna, Eur. Phy. J. B 11 (1999) 193. [4] R.N.Mantegna, and H.E.Stanley, An Introduction to Econophysics : Correlations and Complexity in Finance, Cambridge University Press, 2000. [5] F.Black, M.Jensen, and M.Scholes, Working Paper (from SSRN), 1972. [6] E.F.Fama, and K.R.French, J. Financial Econ. 33 (1993) 3. [7] S.A.Ross, J. Econ. Theory 13 (1976) 343. [8] G.Bonanno, G.Caldarelli, F.Lillo, S.Micciche, N.Vandewalle, and R.N.Mantegna, Eur. Phy. J. B 38 (2004) 363. [9] R.Coelho, S.Hutzler, P.Repetowicz, and P.Richmond, Physica A, 373(1) (2007) 615. [10] G.Bonanno, G.Caldarelli, F.Lillo and R.N.Mantegna, Phys. Rev. E 68 (2003) 046130. [11] Cheoljun Eom, Gabjin Oh, and Seunghwan Kim, J. Korea Phys. Soc. 51(4) (2007). [12] W.J.Ma, C.K.Hu, and R.E.Amritkar, Phys. Rev. E 70 (2004) 026101. [13] Cheoljun Eom, Gabjin Oh, and Seunghwan Kim, Physica A, 382 (2007) 111. [14] J.C.Gower, Biometrika 53 (1966) 325. [15] J.B.Kruskal, Proc. Am. Math. Soc. 7 (1956) 48. [16] Uncheol Lee, Seunghwan Kim, and Ki-Young Jeong, Phys. Rev. E 73 (2006) 041920.
8